RESEARCH ARTICLE
Evaluating the Current State of Pedestrian Facilities in Peri-Urban and Urban Areas: A Case Study of Pietermaritzburg City
Wealthy Tsembile Maseko1, Jacob Adedayo Adedeji1, *, Ndakhona Bashingi2, James Honiball3
Article Information
Identifiers and Pagination:
Year: 2024Volume: 18
E-location ID: e26671212268070
Publisher ID: e26671212268070
DOI: 10.2174/0126671212268070240402062351
Article History:
Received Date: 13/11/2023Revision Received Date: 31/01/2024
Acceptance Date: 21/02/2024
Electronic publication date: 26/04/2024
Collection year: 2024

open-access license:
Abstract
Background
Pedestrian infrastructure is pivotal for advancing the movement of nonmotorized road users and plays a transformative role in transitioning toward sustainable transportation, especially in rural territories influenced by urban dynamics and interconnected by daily commuter flows. Both walking and cycling stand out as paramount sustainable transport means, offering substantial health and environmental benefits, including reduced noise and air pollution. Multiple factors, such as convenience, safety, accessibility, service cost, flexibility, and the quality of pedestrian pathways, shape individuals' propensity to walk. Notably, in peri-urban contexts, the cost of service becomes a significant determinant, as a notable proportion of the population earns minimal wages or faces unemployment.
Objective
This study sought to examine the current state of pedestrian walkways within Pietermaritzburg and surrounding areas, through which the accessibility, availability, and quality of these facilities were assessed. The study has suggested possible solutions to address the challenges faced by pedestrians.
Methods
By conducting semi-structured interviews and leveraging ArcGIS mapping utilities, this research has delineated the existing scenario and offered an initial redesign tailored to pedestrian requirements.
Results
The data have starkly revealed pervasive inadequacies in the existing pedestrian infrastructure. The functionality and safety of current amenities have been manifestly undermined by these shortcomings. The continuing use of these dilapidated facilities may pose alarming threats not only to pedestrians, but also to other road users.
1. INTRODUCTION
1.1. Pedestrian Walkway
Pedestrian walkways play a crucial role in connecting communities, ensuring safe and accessible mobility for both pedestrians and cyclists. Walking and cycling have emerged as paramount sustainable means of transportation, offering significant health and environmental benefits, including reduced noise and air pollution, and social benefits [1, 2]. Various factors, such as convenience, safety, accessibility, service cost, flexibility, and pedestrian walkway quality, shape individuals' inclination to walk [2, 3]. However, amidst the ongoing global push for sustainability, addressing transportation's current contribution of 14% to greenhouse gas emissions and exacerbating climate change is imperative [4, 5]. Hence, there is an emerging need to promote nonmotorized transportation methods [4].
Approximately 26% of all road traffic fatalities involve pedestrians and cyclists, who are considered vulnerable road users [3]. This percentage is even more alarming in Africa, where more than 40% of such deaths occur [6, 7]. When examining specific African cities, walking constitutes 70% of the trips in both Addis Ababa and Kinshasa, 63% in Harare, Zimbabwe, 62% in Ugandan cities, 61% in Cape Town (particularly among the lower-income population), and 53.2% in the Ogun State, Nigeria [8, 9]. Overall, walking and cycling account for 50% of transportation journeys across the continent [9]. In the South African context, walking is more prevalent in rural areas than in urban areas. Approximately 62% to 80% of children walk to school every day [4, 10-12].
The dominant reason for the elevated walking rates in Africa is low income, coupled with the necessity of accessing public transportation rather than purely sustainability-driven motives. Despite the significant percentage of pedestrians in South Africa, the infrastructure supporting them remains subpar [13-16], especially in peri-urban and rural locales. Pietermaritzburg, the focus of this study, is one such city where the quality and availability of pedestrian walkways are pivotal to its liveability and sustainability. Recently, the city has experienced rapid growth, resulting in an increased demand for pedestrian connections between its peri-urban and urban sectors [17]. This research endeavoured to meticulously analyse the status of pedestrian walkways in Pietermaritzburg, assessing pedestrian availability, accessibility, and quality. Moreover, it aimed to pinpoint challenges related to pedestrian mobility within a city and propose viable solutions.
1.2. Study Area: Pietermaritzburg
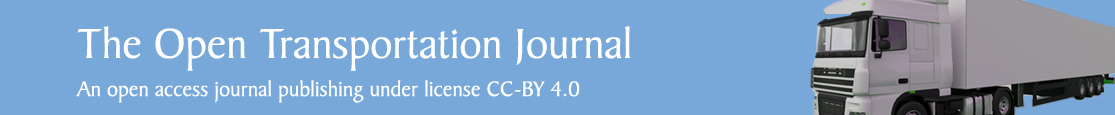
Located in the UMgungundlovu district of the KwaZulu-Natal Province, Pietermaritzburg lies approximately 80 kilometres inland from Durban, a major coastal city [18, 19]. As the second-largest city in KwaZulu-Natal, it nestles within a valley surrounded by hills, sitting at an elevation of approximately 600 metres above the sea level. The city strategically positions itself on the N3 national highway, a vital artery connecting Durban to Johannesburg. Furthermore, Oribi Airport serves Pietermaritzburg, facilitating domestic flights to various South African cities [18] (Fig. 1).
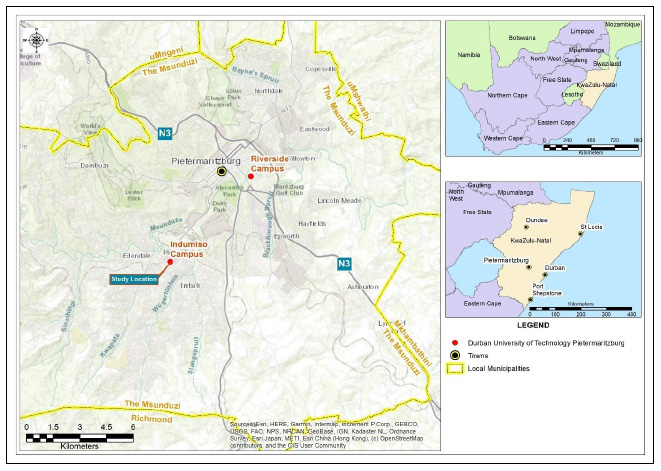 |
Fig. (1). Location of the study area (source: author compilation). |
Given its geographical placement, Pietermaritzburg stands as a pivotal transportation nucleus and an economic powerhouse in the region, bridging the coast with South Africa's inland territories. Its proximity to natural wonders, such as the Midlands Meander and the uKhahlamba-Drakensberg Park, enhances its appeal, drawing tourists and outdoor aficionados alike.
1.3. Quality of Pedestrian Walkways and Choice of Walking
Studies have consistently indicated a positive correlation between the likelihood of choosing walking as a mode of transportation and the quality of pedestrian walkways [20-25]. Albers et al. [20] and Ewing et al. [21] highlighted the importance of various design elements, including sidewalk width, lighting, landscaping, and accessibility, in promoting walking. Saelens et al. [22] asserted that visually appealing and well-maintained sidewalks attract more pedestrian traffic, creating an environment conducive to physical activity. Additionally, a sense of safety significantly influences the decision to walk. Lizárraga et al. [23] reported that individuals, particularly students, are more inclined to walk if they perceive walkways as safe and secure. Traffic calming measures, night vision lighting, pedestrian crossings, and well-defined pathways contribute to a heightened sense of safety, impacting walking choices positively [20, 24, 25].
Furthermore, Ferreira et al. [26] emphasized that the availability of well-maintained sidewalks, aesthetically pleasing landscapes, and safe crossings significantly influence pedestrians' willingness to walk. Bonaccorsi et al. [27] reported that neighbourhoods with well-connected and accessible walkways experience greater rates of walking, contributing to improved physical health. Hassen and Kaufman [28], along with van den Berg et al. [29], underscored the role of pedestrian infrastructure in promoting social interactions and community engagement. This may foster a sense of safety and belonging, motivating individuals to choose walking as a mode of transport. Additionally, pedestrian infrastructures facilitate unexpected encounters with strangers, and repeated interactions over time can promote open-mindedness, tolerance, and acceptance of cultural diversity [30]. In contrast, inadequate pedestrian facilities may act as deterrents, limiting the appeal of walking and leading to a sedentary lifestyle [31, 32].
Overall, the decision to walk is not solely determined by one specific attribute of the walkway. The risk varies across study locations and is influenced by factors, such as lifestyle, travel distance, environmental conditions, and the state of the public transportation system. However, expanding pedestrian facilities reduces the perceived distance from fellow city dwellers, enhances subjective feelings of proximity, and promotes a stronger sense of community and well-being [33].
2. METHODOLOGY AND DATA COLLECTION
2.1. Method
To fulfill the study's objectives, this study adopted a comprehensive mixed-methods approach, seamlessly integrating both qualitative and quantitative research techniques (Fig. 2). For the qualitative component, an exhaustive site survey was conducted, meticulously assessing pedestrian walkways spanning from selected peri-urban to urban areas. On the quantitative front, structured surveys were distributed to pedestrians actively utilizing the designated routes, capturing valuable data regarding their experiences and patterns of usage.
2.2. Sampling Design and Questionnaire Design
In this study, a quantitative research methodology was employed. Questionnaires were designed based on a predetermined sample size, considering a specified margin of error, to accurately represent the population of pedestrians traversing the chosen route. This method ensured a confidence interval that bolstered the reliability of this study's assessments [34].
Two hundred paper-based questionnaires were distributed to pedestrians navigating the peri-urban space to the urban pathway in the study area. Out of these, 192 were returned within 14 days. The questionnaire was structured to align with the research objectives as follows:
1. The first section solicited sociodemographic details, including age, gender, educational background, occupation, and monthly income.
2. The second section focused on walk trip attributes, such as the purpose of the trip, distance covered, and travel frequency.
3. In the third section, participants were asked to rate their satisfaction with the current state of the pedestrian walkway. Ratings were recorded on a 5-point Likert scale: 1 (highly dissatisfied), 2 (dissatisfied), 3 (neutral), 4 (satisfied), and 5 (highly satisfied).
Notably, the study's design, involving the distribution of nonintrusive paper-based questionnaires to participants in a public setting, was crafted with a commitment to minimizing risk. In alignment with the principles outlined in the Helsinki Declaration, ethical considerations took precedence, emphasizing voluntary participation, robust privacy protection, and the provision of an option for withdrawal. These principles, coupled with the careful avoidance of sensitive data collection, collectively support and align with the ethical standards advocated by the Helsinki Declaration, and justify exemption from formal ethical clearance [35].
2.3. Data Analysis
The data collected were statistically analysed using the Statistical Package for Social Sciences (SPSS) package, and the results were analysed using MS Excel. Further analysis was performed through the Relative Importance Index (RII) [36, 37] and the chi-square test to establish the importance level and relationship between variables, respectively. The RII has significant value for this study, as its outcome signifies the ranked degree of relevance of a particular aspect. It proves especially useful for surveys utilizing a Likert scale [37]. As illustrated in Eq. (1), the RII formula was integrated into Microsoft Excel, which enabled us to calculate the index for distinct sets of responses or items.
 (1)
(1)
where w= weighting given to each factor by respondents (ranging from 1 to 5);
n5-n1 = number of respondents for very safe to very unsafe;
A = the highest weight (i.e., 5 in this study); and
N = total number of respondents.
The RII ranges from 0 to 1, with 0 not inclusive. The higher the RII is, the more important the walkway attributes are, and vice versa. To compare the RII with the relevant relevance level, Chen et al. [38] presented a transformation matrix (Table 1).
 |
Fig. (2). Research methodology flow chart (source: author compilation). |
| High (H) | 0.8 < RII < 1.0 |
| High-Medium (H-M) | 0.6 < RII < 0.8 |
| Medium (M) | 0.4 < RII < 0.6 |
| Medium-Low (M-L) | 0.2 < RII < 0.4 |
| Low (L) | 0.0 < RII < 0.2 |
Furthermore, the chi-square test was used to assess the hypotheses related to respondent demographics and the states of the pedestrian walkway-related questions. As a result, the null and alternative hypotheses for testing were as follows:
Ho: ” Pedestrians’ characteristics and perceptions of pedestrian walkway conditions are independent of each other.”
Hi: “The null hypothesis is not true.”
The expected cell frequencies were compared with the observed cell frequencies using the chi-square test, as estimated using Eq. (2) below.
 (1)
(1)
Where, X2 = chi-square;
Oij = observed frequency of the cell in the ith row and jth column; and
Eij = expected frequency of the cell in the ith row and jth column
The calculated chi-square results were compared with the critical chi-square value with (r-1) × (c-1) degrees of freedom to determine the acceptance or rejection of the null hypothesis [39].
3. RESULTS AND DISCUSSION
3.1. The State of Peri-Urban to Urban Pedestrian Facilities
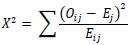
The study commenced with a meticulous examination of pedestrian traffic along a designated route, as illustrated in Fig. (3). The initial focus was to quantify pedestrian movement through a comprehensive traffic count. The analysis brought to light a significant discrepancy in traffic volumes between weekdays and weekends. On weekdays, there was a substantial increase in pedestrian activity, contrasting with a notable decline during weekends. Further dissection of the data exposed distinct surges during the early morning hours (6:00 to 8:00) and late afternoons (16:00 to 18:00), indicative of peak periods. During these peak times, an estimated average of 130 pedestrians were observed along the route, while off-peak hours saw a drastic reduction to only 30 pedestrians.
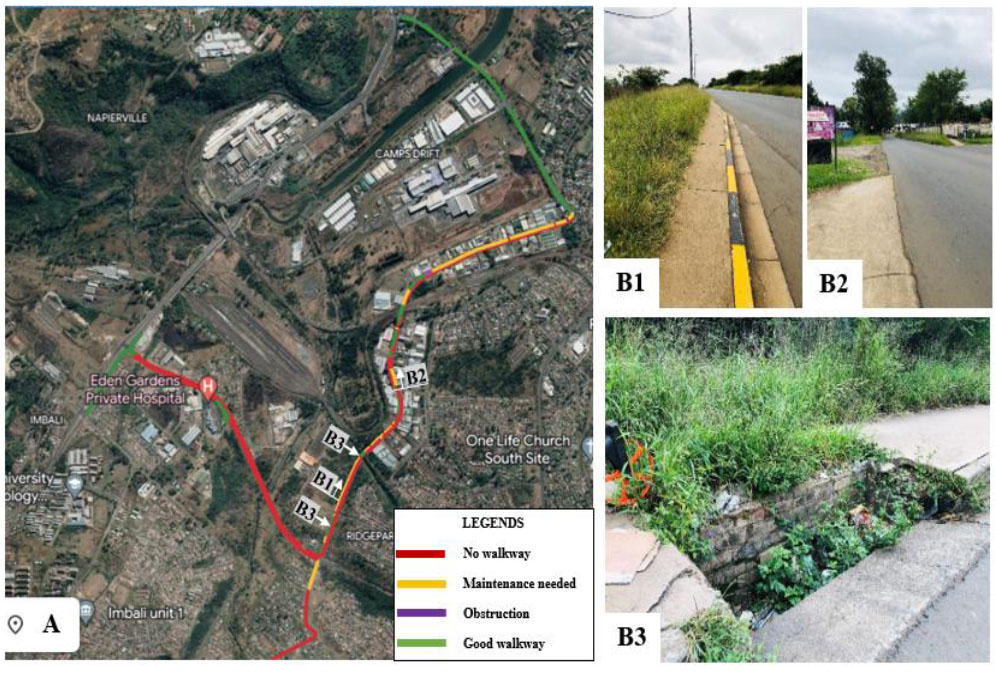 |
Fig. (3). (A and B). State of pedestrian facilities (source: author compilation). |
With a comprehensive understanding of pedestrian movement, the study then undertook an on-site observational visit to assess the current state of pedestrian facilities. Precise measurements of the pedestrian walkways were meticulously recorded and subsequently benchmarked against the standards recommended by the South African Pedestrian and Bicycle Facility Guidelines, a set of directives outlined by the Department of Transport. The findings, along with the physical condition of the walkways, were generated using ArcGIS, as illustrated in Fig. (3A).
An alarming revelation emerged during this assessment, pointing to the absence of critical infrastructure elements, such as manhole covers and drainage grates (Fig. 3B3), and a reduction in the lane width of the walkway (Fig. 3B1). Additionally, a missing link in the pedestrian walkway was observed (Fig. 3B2), hence leaving the pedestrians with no choice but to cross to the other side of the road with no pedestrian facilities provided. This conspicuous absence poses a tangible hazard, significantly elevating the potential for accidents involving pedestrians. The current conditions of the pedestrian walkways, as exposed by the analysis, underscore the urgent need for substantial maintenance and improvements.
Notably, the study discerned a misalignment between the existing conditions and the standards outlined in the South African Pedestrian and Bicycle Facility Guidelines. This inadequacy in conformity heightens the risk of accidents, placing pedestrians in precarious situations where the likelihood of traffic incidents or near misses becomes more pronounced. A particularly disconcerting finding is that, for approximately 50% of the route, pedestrians are compelled to walk on the road pavement. This direct usage of the road significantly amplifies the chances of interactions and potential collisions between vehicles and pedestrians, particularly during peak rush hours.
In essence, the comprehensive analysis of pedestrian traffic and facilities along the specified route underscores the urgency of addressing the existing deficiencies. The discordance between observed conditions and established guidelines highlights a critical need for infrastructure enhancement and adherence to established standards. Immediate attention is warranted to mitigate the heightened risks faced by pedestrians, especially during peak periods, and to create safer environments conducive to sustainable urban mobility.
3.2. Sociodemographic and Walk Trip Characteristics
A total of 192 respondents participated in the survey (Table 2). A significant majority (81.7%) were male. The age distribution revealed that only 9.9% of the participants were older than 45 years, whereas the oldest age bracket was in the 25–34 years, encompassing 34.2% of the respondents. Regarding employment status, 40.9% of the participants identified as unemployed, 46.7% were employed either full- or part-time, 4.7% were students, and 6.2% considered themselves self-employed. The demographics of the respondents influenced their preferred mode of transportation.
Furthermore, there has been found a discernible link between educational background and economic standing, with both of these aspects playing pivotal roles in determining a road user's transportation choice. Table 3 elucidates the relationship between respondents' monthly household earnings and their educational qualifications. A mere 3.1% of participants had not completed their high school education, while almost half, 48.7%, had achieved at least one matriculation qualification. Financially, 36.8% of the surveyed households reported no monthly income, whereas 9.9% claimed to earn at least R5000 monthly.
| Characteristic | Group | Percentage | N = 192 | Characteristic | Group | Percentage | N = 192 | |||
|---|---|---|---|---|---|---|---|---|---|---|
| Age | 16 – 18 | 6.2 | 12 | Occupation | Student | 4.7 | 9 | |||
| - | 18 – 24 | 20.7 | 39 | - | Part-time | 13.0 | 25 | |||
| - | 25 – 34 | 34.2 | 66 | - | Self-employed | 6.2 | 12 | |||
| - | 34 – 44 | 28.5 | 55 | - | Full-time worker | 33.7 | 65 | |||
| - | 45 – 54 | 5.2 | 10 | - | Unemployed | 40.9 | 79 | |||
| - | 55 or older | 4.7 | 9 | - | Retired | 1.5 | 3 | |||
| Gender | Male | 81.7 | 157 | - | - | - | - | |||
| Female | 18.3 | 35 | - | - | - | - | ||||
| Characteristic | Group | Percentage | N = 192 | Characteristic | Group | Percentage | |||
|---|---|---|---|---|---|---|---|---|---|
| Monthly Income (RANDS1) | No income | 36.8 | 71 | Level of education | No formal education | 3.1 | |||
| - | Less than R1500 | 17.6 | 34 | - | Grade 1-7 | 4.7 | |||
| - | R1500 – R2500 | 17.1 | 33 | - | Grade 8-11 | 29.5 | |||
| - | R2501 – R5000 | 18.1 | 35 | - | Matric | 48.7 | |||
| - | R5001 – R10 000 | 7.3 | 14 | - | Undergraduate | 6.2 | |||
| - | More than R10 000 | 2.6 | 5 | - | Postgraduate | 7.3 | |||
Currency conversion: 1 Rands= 0,048 Euro (www.google.com/finance/quote/ZAR-EUR?sa) Accessed 20/08/2023.
3.3. Walking Mode
To understand the modal split, respondents were questioned about their travel purpose and frequency. The results, illustrated in Fig. (4), indicate that the predominant reason for travel was work or school, accounting for approximately 55% of the respondents. An additional 30% travelled for miscellaneous reasons, including job hunting, shopping, accessing public services, and recreational activities. Notably, 10% of those using the route for exercise or leisure associated their choice with the Comrades marathon.
The primary mode of commuting, walking, can be attributed to several factors. These include the cost-effectiveness of walking since it is largely free, proximity to destinations, reaching the destination often faster by walking than public transport, and the absence of alternative means of transportation. While the principle of sustainability and environmental awareness drives the adoption of Nonmotorized Travel (NMT) in specific areas, particularly in developed cities with supportive NMT infrastructure, it is scarcely the motivating factor in underprivileged areas. In the context of the study area, the decision to walk is driven more by necessity and lack of alternatives than by environmental consciousness. In some instances, pedestrians simply cannot afford public transportation.
Further analysis revealed that 59.4% of the participants used the route daily. In contrast, 22.9% and 7.8% of the videos were traversed weekly and monthly, respectively. These data underscore the route's importance, with 52.1% of respondents indicating a high level of familiarity and comprehensive knowledge. Conversely, 10.9% of the surveyed individuals had been acquainted with the route for less than six months.
3.4. Relative Importance Indices of Walkway Attributes
To prioritize the concerns regarding the current state of the pedestrian walkway, a Relative Importance Index (RII) analysis was employed. This approach illuminated the most pertinent features in predicting the target variable. Based on the results, pavement irregularities, such as broken or uneven paving, emerged as the primary concern, with an RII value of 0.635 (high-medium importance) (Fig. 5). This was subsequently trailed by concerns about the safety and maintenance of the walkway (RII = 0.505, medium importance).
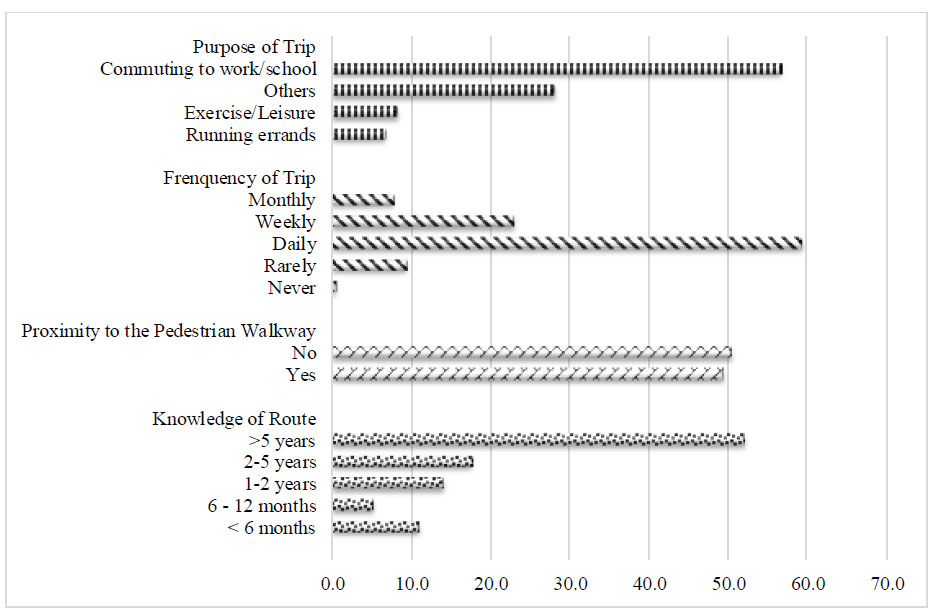 |
Fig. (4). Walking mode choice characteristics of respondents (source: author compilation). |
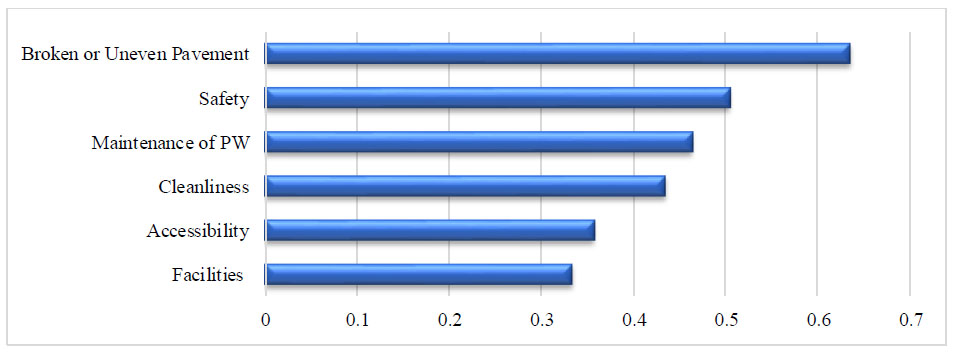 |
Fig. (5). Relative importance index of walkway attributes (source: author compilation). |
| - | χ2tab = 31.410 | χ2tab = 9.488 | χ2tab = 31.410 | χ2tab = 31.410 | χ2tab = 31.410 | χ2tab = 26.296 | χ2tab = 21.026 |
|---|---|---|---|---|---|---|---|
| State of the Pedestrian Walkway | Age (20) | Gender (4) | Level of Education (20) | Employment Status (20) | Monthly Household (20) | Knowledge of Route (16) | Purpose of the Trip (12) |
| - | |||||||
| Safety | 13.473 (20) | 1.510 | 20.599 | 23.268 | 37.888 | 32.409 | 21.926 |
| Accessibility | 22.361 | 4.334 | 18.418 | 27.454 | 35.905 | 32.176 | 13.196 |
| Infrastructure | 33.130 (15) | 2.215 (3) | 23.030 (15) | 25.615 (15) | 23.826 (15) | 11.354 (12) | 17.935 (9) |
| Maintenance | 21.613 | 2.757 | 17.214 | 22.321 | 21.949 | 29.160 | 19.005 |
| Cleanliness | 23.145 | 2.017 | 36.062 | 26.163 | 35.428 | 35.980 | 19.547 |
| Facilities | 23.970 | 5.524 | 31.765 | 23.894 | 14.867 | 32.773 | 18.594 |
Shaded portion: associated with each other; unshaded portion: independent or not associated with each other; (value): degrees of freedom (df).
Furthermore, the cleanliness (RII = 0.434) and maintenance (RII = 0.464) of the route also garnered significant attention from the respondents. In the ranking spectrum, accessibility appeared second to last, while facilities specific to pedestrians were the least concerning issue. However, it is essential to note that these viewpoints could vary depending on the stakeholder's perspective. From the pedestrians’ viewpoint, the comfort and walkability of pathways tend to take precedence.
3.5. Relationship between Respondent Demography and the State of the Pedestrian Walkway
To evaluate the interplay between respondents’ demographic characteristics and their perceptions of the condition of the pedestrian walkway, a cross-classification analysis was performed (Table 3). The decision rule for Table 4 is delineated as follows: “If χ2_tab > χ2_cal, accept Ho; otherwise, reject.” At a 5% level of significance, the chi-square critical values were 31.410, 9.488, 26.296, and 21.026 for degrees of freedom (df) of 20, 4, 16, and 12, respectively.
The observed chi-square values for the respondents' perceptions of the state of the pedestrian walkway exceeded the critical values when comparing age and employment status against infrastructure and level of education against cleanliness and facilities. This indicates these variables as significantly related.
Consequently, factors, such as respondent age and employment status, may play a role in shaping perceptions of pedestrian walkway conditions. Specifically, age and employment status have emerged as potential determinants influencing the perceived acceptable standard level of infrastructure service. However, gender did not appear to sway the respondents' perceptions of the walkway's condition. Furthermore, a respondent's level of education appeared to affect their views on cleanliness and the amenities present on the route.
When examining the condition of pedestrian walkways, the chi-square analysis revealed the elements, such as safety, accessibility, and cleanliness, to be related to the respondents’ monthly household income. Furthermore, the degree of familiarity with the route significantly influenced the respondents' perceptions of the pedestrian walkway's condition.
The majority of respondents, totaling 96%, expressed that the pedestrian walkway was devoid of essential amenities, including benches and water fountains. The South African Pedestrian and Bicycle Facility Guidelines, formulated by the Department of Transport, enumerate the hallmarks of exemplary walkways, categorizing them under various attributes: security, safety, traffic safety, accessibility, convenience, comfort, environment, and economy. Regrettably, an examination of the findings revealed that the walkway under study fell short across all these parameters.
CONCLUSION
This research has shed unprecedented light on the current state of pedestrian walkways in the peri-urban areas of Pietermaritzburg, offering invaluable insights that are instrumental for policymakers and stakeholders in pinpointing areas that demand immediate redress. Significantly, this study pioneers a baseline for prospective planning and development strategies aimed at the enhancement of pedestrian pathways within the city. Such endeavours can drive the city towards achieving greater liveability and sustainability for its denizens.
The data have starkly revealed pervasive inadequacies in the existing pedestrian infrastructure. The functionality and safety of current amenities have been manifestly undermined by these shortcomings. The continuing use of these dilapidated facilities may pose alarming threats not only to pedestrians, but also to other road users.
Despite these facilities glaringly falling short of the Department of Transport's guidelines, pedestrians persist in their utilization. This reality underscores the prevailing dissatisfaction with the current state, highlighting the compromised user experience. Most road users, especially pedestrians, find themselves shackled to their chosen mode of transport. Thus, deficiencies in these facilities may not necessarily catalyze a shift in transportation means, but may rather render users susceptible to heightened risks. Such vulnerabilities could be manifested through alternate route choices to bypass hazardous infrastructures or forced forays into vehicle lanes, further exacerbating potential encounters with vehicular traffic.
It is worth noting that frequent exposure to and familiarity with a route often arise from repeated traversal. These journeys, particularly bound by specific schedules, such as school or work timings, render many travellers tethered to walking, deeming it an indispensable conduit to their destinations. The compromised state of these pedestrian facilities, while possibly not precipitating a shift to alternate modes of transport, undeniably fosters dissatisfaction.
To summarize, this novel study has highlighted the pivotal role of pedestrian walkways in bridging communities, ensuring safe and accessible transit, and highlighting the pressing imperative for sustained enhancements and investments in pedestrian amenities. This paper has additionally proposed proactive measures, such as periodic cleaning of pavements, clearing roadside gutters and manholes to optimize visibility and safety, and consistent maintenance and mending of fractured pavements before they deteriorate further. Instituting these solutions can profoundly ameliorate the prevailing challenges, elevate pedestrian safety, and enhance the user experience.
CONSENT FOR PUBLICATION
Not applicable.
STANDARDS OF REPORTING
STROBE guidelines were followed.
AVAILABILITY OF DATA AND MATERIALS
Data will be available on request through the corresponding author.
FUNDING
None.
CONFLICT OF INTEREST
The authors declare no conflict of interest, financial or otherwise.
ACKNOWLEDGEMENTS
The authors would like to acknowledge Zinhle Sibisi, Sthembile Maphumulo and Thandiswa Ntinga for their valuable time and assistance in the data collection process.
REFERENCES
| [1] | M. Cieśla, and E. Macioszek, "The perspective projects promoting sustainable mobility by active travel to school on the example of the Southern Poland Region", Sustainability, vol. 14, no. 16, p. 9962, 2022. |
| [2] | E. Macioszek, A. Granà, and S. Krawiec, "Identification of factors increasing the risk of pedestrian death in road accidents involving a pedestrian with a motor vehicle", Arch. Transp., vol. 65, no. 1, pp. 7-25, 2023. |
| [3] | N. Bashingi, A.J. Adedeji, K.D. Das, and M.H.M. Mostafa, "Inclusivity of ICT based solutions to public transportation problems: Challenges and opportunities for bloemfontein", Put i traff., vol. 69, no. 3, pp. 19-26, 2023. |
| [4] | S. Khalili, E. Rantanen, D. Bogdanov, and C. Breyer, "Global transportation demand development with impacts on the energy demand and greenhouse gas emissions in a climate-constrained world", Energies, vol. 12, no. 20, p. 3870, 2019. |
| [5] | C.S. Okoro, and K. Lawani, "Optimising sustainable mobility: A performance assessment of non-motorised transport infrastructure in Johannesburg, South Africa", J. S. Afr. Inst. Civ. Eng., vol. 64, no. 2, pp. 1-10, 2022. |
| [6] | G. Yannis, D. Nikolaou, A. Laiou, Y.A. Stürmer, I. Buttler, and J.D. Karpa, "Vulnerable road users: Cross-cultural perspectives on performance and attitudes", IATSS Res., vol. 44, no. 3, pp. 220-229, 2020. |
| [7] | J. Ren, Y. Chen, F. Li, C. Xue, X. Yin, J. Peng, J. Liang, Q. Feng, and S. Wang, "Road injuries associated with cellular phone use while walking or riding a bicycle or an electric bicycle: A case-crossover study", Am. J. Epidemiol., vol. 190, no. 1, pp. 37-43, 2021. |
| [8] | C. Uzondu, and A.A. Etika, "The future of non-motorised transport in Urban Africa", Transport and Mobility Futures in Urban Africa., Springer International Publishing: Cham, 2022, pp. 297-312. |
| [9] | J. Lukenangula, "Peoples’ perspectives on the walking environment in rapidly growing cities: The case of Dar es Salaam City", African Journal on Land Policy and Geospatial Sciences, vol. 6, no. 1, pp. 163-187, 2023. |
| [10] | M.M. Mokitimi, and M. Vanderschuren, "The significance of non-motorised transport interventions in South Africa–a rural and local municipality focus", Transp. Res. Procedia, vol. 25, pp. 4798-4821, 2017. |
| [11] | S. Bulbulia, A.V. Niekerk, L.A. Swart, and M. Seedat, "Child pedestrian, drowning and burn mortality in Johannesburg", Int. J. Inj. Contr. Saf. Promot., vol. •••, pp. 1-7, 2022. |
| [12] | P. Onderwater, "Analysing NHTS on public transport aspects", Proceedings of the 40th Annual Southern African Transport Conference (SATC 2022), 2022. 4-7 July, 2022 |
| [13] | D. Das, and J. Honiball, "Evaluation of accessibility challenges of public parks in residential areas of South African cities-A case study of Bloemfontein City", Proceeding of the 35th Annual Southern African Transport Conference (SATC 2016), pp. 539-557. |
| [14] | N.R. Makgata, |
| [15] | D. Mukherjee, and P. Saha, "Walking behaviour and safety of pedestrians at different types of facilities: A review of recent research and future research needs", SN Social Sci., vol. 2, no. 5, p. 76, 2022. |
| [16] | D. Naicker, and M. Sinclai, "The effectiveness of sidewalks on pedestrian safety in a township environment", Proceedings of the 40th Annual Southern African Transport Conference (SATC 2022), pp. 1-13. |
| [17] | P. Singh, and C.T. Downs, "Hadedas in the hood: Hadeda Ibis activity in suburban neighbourhoods of Pietermaritzburg, KwaZulu-Natal, South Africa", Urban Ecosyst., vol. 19, no. 3, pp. 1283-1293, 2016. |
| [18] | Statistics South Africa (StatsSA), "General household survey", Available from: http://www.statssa.gov.za/ |
| [19] | P. Ramnarain, and S. Singh, "Public healthcare practitioners’ knowledge, attitudes and practices related to oral antibiotic prescriptions for dental use in Pietermaritzburg, KwaZulu-Natal", Health SA, vol. 27, p. 1832, 2022. |
| [20] | P.N. Albers, C. Wright, and J. Olwoch, "Developing a South African pedestrian environment assessment tool: Tshwane case study", S. Afr. J. Sci., vol. 106, no. 9/10, pp. 1-8, 2010. |
| [21] | R. Ewing, A. Hajrasouliha, K.M. Neckerman, M. Purciel-Hill, and W. Greene, "Streetscape features related to pedestrian activity", J. Plann. Educ. Res., vol. 36, no. 1, pp. 5-15, 2016. |
| [22] | B. Saelens, and S.L. Handy, "Built environment correlates of walking: A review", Med. Sci. Sports Exerc., vol. 40, no. S7, pp. S550-S566, 2008. |
| [23] | C. Lizárraga, M.C. Blanco, C.I. Pérez, and C.J. Olmo, "Do university students’ security perceptions influence their walking preferences and their walking activity? A case study of Granada (Spain)", Sustainability, vol. 14, no. 3, p. 1880, 2022. |
| [24] | A. Baobeid, M. Koç, and S.G. Al-Ghamdi, "Walkability and its relationships with health, sustainability, and livability: Elements of physical environment and evaluation frameworks", Front. Built Environ., vol. 7, p. 721218, 2021. |
| [25] | A. Montella, S. Chiaradonna, A.C.S. Mihiel, G. Lovegrove, P. Nunziante, and R.M. Riccardi, "Sustainable complete streets design criteria and case study in Naples, Italy", Sustainability, vol. 14, no. 20, p. 13142, 2022. |
| [26] | C.M. Ferreira, D.P. Costa, D. Abrantes, J. Hora, S. Felício, M. Coimbra, and T. Galvão Dias, "Identifying the determinants and understanding their effect on the perception of safety, security, and comfort by pedestrians and cyclists: A systematic review", Transp. Res., Part F Traffic Psychol. Behav., vol. 91, pp. 136-163, 2022. |
| [27] | G. Bonaccorsi, F. Manzi, M. Del Riccio, N. Setola, E. Naldi, C. Milani, D. Giorgetti, C. Dellisanti, and C. Lorini, "Impact of the built environment and the neighborhood in promoting the physical activity and the healthy aging in older people: An umbrella review", Int. J. Environ. Res. Public Health, vol. 17, no. 17, p. 6127, 2020. |
| [28] | N. Hassen, and P. Kaufman, "Examining the role of urban street design in enhancing community engagement: A literature review", Health Place, vol. 41, pp. 119-132, 2016. |
| [29] | D. Simandan, "Being surprised and surprising ourselves: A geography of personal and social change", Prog. Hum. Geogr., vol. 44, no. 1, pp. 99-118, 2020. |
| [30] | N. Basu, O.O. Trespalacios, M. King, M. Kamruzzaman, and M.M. Haque, "What do pedestrians consider when choosing a route? The role of safety, security, and attractiveness perceptions and the built environment during day and night walking", Cities, vol. 143, no. 104551, p. 104551, 2023. |
| [31] | N. Owen, E. Cerin, E. Leslie, L. duToit, N. Coffee, L.D. Frank, A.E. Bauman, G. Hugo, B.E. Saelens, and J.F. Sallis, "Neighborhood walkability and the walking behavior of Australian adults", Am. J. Prev. Med., vol. 33, no. 5, pp. 387-395, 2007. |
| [32] | D. Simandan, "Proximity, subjectivity, and space: Rethinking distance in human geography", Geoforum, vol. 75, pp. 249-252, 2016. |
| [33] | D.E. Gray, Doing Research in the Real World, 3rd ed.Sage, 2021, p. 100. |
| [34] | D.A. Tholibon, M. Md Nujid, H. Mokhtar, J.A. Rahim, N.F.A. Aziz, and A.A.A. Tarmizi, "Relative Importance Index (RII) in ranking the factors of employer satisfaction towards industrial training students", Int. Asian J. Educ, vol. 2, no. 4, pp. 493-503, 2021. |
| [35] | B. Shrestha, and L. Dunn, "The declaration of Helsinki on medical research involving human subjects: A review of seventh revision", J. Nepal Health Res. Counc., vol. 17, no. 4, pp. 548-552, 2020. |
| [36] | M.V. Sakhare, and M.B. Chougule, "Construction equipment monitoring: By using relative important indices (Rii) analysis", Int. Res. J. Eng. Technol., vol. 6, no. 11, pp. 261-263, 2019. |
| [37] | Y. Chen, G.E. Okudan, and D.R. Riley, "Sustainable performance criteria for construction method selection in concrete buildings", Autom. Construct., vol. 19, no. 2, pp. 235-244, 2010. |
| [38] | N. Pandis, "The chi-square test", Am. J. Orthod. Dentofacial Orthop., vol. 150, no. 5, pp. 898-899, 2016. |
| [39] | P. van den Berg, F. Sharmeen, and M. Weijs-Perrée, "On the subjective quality of social Interactions: Influence of neighborhood walkability, social cohesion and mobility choices", Transp. Res. Part A Policy Pract., vol. 106, pp. 309-319, 2017. |