
RESEARCH ARTICLE
Fatal Crash Occurrence Prediction and Pattern Evaluation by Applying Machine Learning Techniques
Saumik Sakib Bin Masud1, Abid Hossain2, *, Nazifa Akter1, Hemin Mohammed3
Article Information

Identifiers and Pagination:
Year: 2024Volume: 18
E-location ID: e26671212288201
Publisher ID: e26671212288201
DOI: 10.2174/0126671212288201240206074548
Article History:
Received Date: 19/10/2023Revision Received Date: 26/12/2023
Acceptance Date: 12/01/2024
Electronic publication date: 13/02/2024
Collection year: 2024

open-access license: This is an open access article distributed under the terms of the Creative Commons Attribution 4.0 International Public License (CC-BY 4.0), a copy of which is available at: https://creativecommons.org/licenses/by/4.0/legalcode. This license permits unrestricted use, distribution, and reproduction in any medium, provided the original author and source are credited.
Abstract
Background
Highway safety remains a significant issue, with road crashes being a leading cause of fatalities and injuries. While several studies have been conducted on crash severity, few have analyzed and predicted specific types of crashes, such as fatal crashes. Identifying the key factors associated with fatal crashes and predicting their occurrence can help develop effective preventative measures.
Objective
This study intended to develop cluster analysis and ML-based models using crash data to extract the prominent factors behind fatal crash occurrences and analyze the inherent pattern of variables contributing to fatal crashes.
Methods
Several branches and categories of supervised ML models have been implemented for fatality prediction and their results have been compared. SHAP analysis was conducted using the ML model to explore the contributing factors of fatal crashes. Additionally, the underlying hidden patterns of fatal crashes have been evaluated using K-means clustering, and specific fatal crash scenarios have been extracted.
Results
The deep neural networks model achieved 85% accuracy in predicting fatal crashes in Kansas. Factors, such as speed limits, nighttime, darker road conditions, two-lane highways, highway interchange areas, motorcycle and tractor-trailer involvement, and head-on collisions were found to be influential. Moreover, the clusters were able to discern certain scenarios of fatal crashes.
Conclusion
The study can provide a clear image of the important factors related to fatal crashes, which can be utilized to create new safety protocols and countermeasures to reduce fatal crashes. The results from cluster analysis can facilitate transportation professionals with representative scenarios, which will benefit in identifying potential fatal crash conditions.
1. INTRODUCTION
Although technology is developing rapidly, there are still many issues with highway safety that need to be resolved. A myriad of road crashes occur every year, making them one of the most common causes of fatalities and disabling injuries. In the US, motor vehicle crashes in 2020 were the leading cause of death for ages 4 to 21 and the second leading cause of death for ages 22 to 67 [1]. Currently, the zero deaths vision is the initiative adopted in the United States, which aims to eliminate fatalities and severe injuries in the transportation system and provide safe mobility for all road users using the Safe System approach [2].
The paramount importance of road safety, especially for Vulnerable Road Users (VRUs), such as pedestrians, bicyclists, moped riders, and motorcyclists, cannot be overstated. VRUs compete to use limited space in public transportation networks and have less physical protection than other transportation modes, and thus, they become more exposed to crashes [3].
The state-wide Strategic Highway Safety Plan (SHSP) relies on a Safe System approach, which recognizes that road users make mistakes, but those mistakes should not result in fatalities or serious injuries [4]. Implementing the Safe System approach requires anticipating human mistakes, thereby designing and managing transportation systems in a way that keeps the risk of a mistake and the consequences of a mistake at the lowest level. Thus, conducting fatal crash analysis using the most advanced methods and technologies is crucial to finding predictable patterns in these crashes and eliminating road fatalities [5].
Crash patterns continue to be stochastic because of the complexity of human behavior despite advancements in the field of transportation, such as Intelligent Transportation Systems (ITS). Although the exact sequence of events for each fatal crash is unique, there are inherent patterns that can depict the similarities of fatal crashes. Finding and prioritizing certain scenarios that result in fatalities and serious injuries is critical for transportation agencies that operate and execute safety policies. Cluster analysis, an ML technique, has been proven to be a useful method for examining the underlying patterns within a dataset [6, 7]. Cluster analysis finds subtle trends in each cluster, which makes it possible to interpret the attributes of variables within each cluster.
Crash severity depends on certain critical factors that may vary over time. Consequently, to get an updated picture of crash fatality, it is necessary to study the recent trends and the influencing factors of fatal crashes. Furthermore, fatal crashes may be anticipated by examining the crash patterns and the underlying causes, which can help in the development of effective preventative measures, like upgrading the condition of the pavement, updating vehicle designs, etc. Various research studies on measuring the crucial crash variables and foreseeing potential crash scenarios have been presented in the literature [8, 9]. Most of the earlier studies have applied different statistical analyses. However, as fatal crashes involve various scenarios and environments, it can be puzzling to capture the complex pattern of crash severity. Nonetheless, Artificial intelligence (AI) models are well known for capturing the complex stochastic relationships between the variables.
This study intended to develop cluster analysis and ML-based models using crash data to analyze the inherent pattern of variables contributing to fatal crashes and predict fatality. The models were developed utilizing the recent five years of crash data (from 2016 to 2020) provided by the Kansas Department of Transportation (KDOT). The analysis and prediction provide the
current crash fatality patterns and detect the most significant factors behind them. The study can provide a clear image of the important factors related to fatal crashes, which can be utilized to create new safety protocols and countermeasures to reduce fatal crashes.
This paper is structured in five sections. The introduction section introduces the study's objectives and theoretical underpinnings. The literature review section conducts an extensive literature review, emphasizing models and theories relevant to the research topic. The methodology section includes the specific models and analytical techniques used in the study. The analysis and result section presents and interprets the results obtained from these models, followed by conclusions discussing the significance of these findings.
2. LITERATURE REVIEW
In this section, previous findings related to the contributing factors behind severe crashes, pattern recognition of the crash, and crash severity prediction models have been vastly reviewed.
2.1. Factors Contributing to Injury Severity and Fatal Crash
Cerrelli quantified the impact of various driver and crash factors on the likelihood of fatal crashes, including driver age and sex, time of day, speed limit, vehicle type, and type of collision [7]. The study found that male drivers have 1.33 times higher odds of being involved in a fatal crash than female drivers, while drivers over 65 have odds 2.59 times higher than their younger counterparts. Similar findings were established by Pitta et al., who conducted a meta-analysis of 14 published studies between 2001 to 2018 and found that older drivers are more likely to be involved in fatal crashes [10].
Altwaijri et al. investigated the factors that contribute to the severity of road injury crashes in Riyadh, Saudi Arabia, using crash data collected over five years [11]. The study employed two logit models (multinomial and mixed) to analyze injury severity, with results suggesting the age and nationality of the driver, excessive speed, wet road surface, dark lighting conditions, and single-vehicle crashes to be associated with an increased probability of fatal crashes. Crashes at night-time, on roads with higher speed limits, and involving certain types of collisions (e.g., head-on or side) have significantly higher odds of being fatal [8]. The logit model was also applied by Macioszek et al., and the results have highlighted the importance of addressing factors, such as driving under the influence of alcohol, exceeding the speed limit, and the involvement of heavy vehicles in pedestrian accidents [3]. Ahmad et al. developed an ordered probit (OP) model using four levels of injury severity (property damage only, minor injury, major injury, and fatal injury) to investigate the risk factors behind crash severity. They found that the risk factors that increase the propensity of crash severity are speeding, drowsiness, head-on-collision, driving in the wrong direction, illegal pedestrian crossing, and increasing age of the drivers [12].
Tamakloe and Park conducted a study on fatal crashes in the hotspot zones in South Korea. They used GIS for spatio-temporal analysis of the crash hotspot zones and implemented machine learning models to understand the factors underlying fatal crashes. The study concluded minibusses/vans and construction vehicles to be responsible for single-vehicle pedestrian-involved crashes. Other factors, including nighttime variables and reckless driving, were also found to be significant in fatal crashes in the hotspot areas [13]. A study by Macioszek et al. concluded that the installation of traffic lights in the transportation network increases the safety level [14].
Gu et al. conducted a study to explore the contributing factors of multi-fatality crashes using a novel framework combining association rules mining and rules graph structures using 1,068 severe fatal crashes in China from 2015 to 2020. Their findings indicated that improper operations, passenger overload, fewer lanes, mountain terrains, and run-off-the-road crashes are the key variables for multi-fatality crashes. Moreover, they also concluded that human-vehicle-environment-road factors create more severe crashes than normal crashes [15]. A study aimed to identify factors contributing to injury severity in run-off-road (ROR) crashes using crash data from Ohio between 2008 and 2012. The study used a decision tree model that identified eight factors, including road condition, alcohol and drug use, road curves and grades, gender, posted speed limit, ROR crash types, and vehicle type, as significant predictors of injury severity [9].
In a study by Ghandour et al., a hybrid machine-learning model was created to examine the factors linked to fatal crashes. The model used data consisting of 8,482 road crashes and utilized variables related to the timing of crashes (hour, day, month) and the types of roads. The study revealed crash type, injury severity, and crash time (hour) as the main factors contributing to fatal crashes [16]. Hossain et al. used unsupervised learning techniques and found that alcohol impairment, exceeding the posted speed limits, and adverse weather conditions are associated with fatal crashes, severe collisions, and moderate injury crashes, respectively [17].
In summary, from the previous literature, various factors, such as driver’s demographic characteristics (age, gender), speeding, human factors (impaired driving, drowsiness), driving conditions (adverse weather conditions, night-time, dark lighting, etc.), type of collision (single vehicle, head-on, roadway departure), presence of traffic lights and heavy vehicles, etc., have been found to be crucial factors for fatal crashes. It is important to mention that the fatal crash-associated factors can vary across different regions and periods as well as with the availability of rich and accurate datasets.
2.2. Crash Pattern Recognition
Cluster analysis subjects the data to multivariate segmentation employing conceptual grouping techniques. In a study conducted by Saha et al., various clustering techniques and their corresponding parameters were examined to identify operational scenarios for different levels of crash severity [18]. The clustering techniques included K-means, K-prototypes, K-medoids, four different hierarchical methods, and a combination of Principal Component Analysis (PCA). The study analyzed six variables, namely traffic volume, speed, occupancy, travel lane blockage due to incidents, incident severity, and precipitation. Based on the results, the K-means clustering technique combined with PCA was found to be the most effective.
Implementing a hybrid approach combining cluster analysis and a Bayesian hierarchical model was another direction for investigating driver injury severity patterns. Li et al. used this approach to examine intersection-related crashes based on two-year crash data in New Mexico [19]. The results indicated that K-means cluster analysis was performed based on weather, roadway, and environmental conditions to reveal possible instability patterns of drivers under diverse external environments.
Rahimi et al. used the block clustering technique to detect crash patterns involving large trucks [20]. The analysis divided the heterogeneous crash dataset into subgroups. The resulting clusters were classified based on whether the crashes occurred in the same direction, in an opposing direction, or involved a single vehicle.
Yuan et al. conducted a study to understand the risk factors associated with truck-involved fatal crashes for different groups of truck drivers. They used the latent class clustering method to classify the truck drivers into three groups and found that adverse weather conditions, rural areas, curved alignments, tractor-trailer units, heavier weights, and various collision manners were significant in all driver groups [21].
Using Joint Correspondence Analysis (JCA) and Association Rule Mining (ARM), Hossain et al. found some behavioral patterns in teenagers, such as distracted driving, alcohol intoxication, using a cell phone while driving, and so on that can also contribute to fatal crashes [17].
2.3. Crash Severity Prediction Models
Although traditional statistical models are frequently used to analyze crash injury severity, they rely on assumptions about the data distribution and often use a linear function to connect the dependent and explanatory variables. If these assumptions are violated, the parameter estimations generated will be incorrect [22]. According to a study by Savolainen et al., the Ordered Probit (OP) model is the most commonly used modeling technique for analyzing crash injury severity [23]. Other common statistical models, such as the Multi-Nomial Logit (MNL) model and the Binary Logit (BL) model are being utilized for crash severity analysis [24]. Abdulhafedh (2017) suggested that traffic-related crash prediction models, such as the logit model and Artificial Neural Network (ANN), should be used by transportation agencies and researchers to better understand traffic crashes and the associated risk factors [24].
In the past few years, multiple ML models have been created to predict different levels of crash severity. Since crash severity is a heterogeneous variable having non-linear relationships with the most studied factors, it is a challenge to choose essential variables that are significantly correlated to detect and forecast crash severity. To address this issue, Machine Learning (ML) approaches are often employed to map the non-linear relationship between the variables. Iranitalab and Khattak compared four statistical and ML models to predict crash severity [7]. The study utilized data related to roadways, drivers, vehicles, crashes, and the environment, and concluded that the Nearest Neighbor Classification (NNC) approach was the most accurate in forecasting severe injury crashes. The statistical approach, Multinomial Logit (MNL), was found to be the weakest and least reliable method. A study focused on predicting rear-end crashes and found that the Support Vector Machine (SVM) method outperformed statistical models, such as the multinomial logit and mixed multinomial logit models [25]. Another study developed three ML algorithms to predict motorcycle crashes [26]. They found that all ML models showed greater accuracy than statistical models, with the Random Forest (RF) model performing the best among the other ML models in terms of accuracy.
Injury severity prediction was also investigated using the OP and ML models [Multi-Layer Perceptron (MLP) and fuzzy Adaptive Resonance Theory (ART), [27]. Among all the models, MLP produced the highest accuracy of 73.5% and the OP model provided the lowest accuracy. The study found that an accident's severity is influenced by factors, such as gender, vehicle speed, seat belt use, vehicle type, point of contact, and location type. Another study compared Neural Network (NN) models with other ML models, such as KNN, decision tree, RF, and SVM to predict real-time crashes using a dataset containing 284 crashes and 592 non-crash data [28]. The study revealed that Deep Neural Networks (DNN) produced the highest accuracy while evaluating crash severity with overall
accuracy, sensitivity, and specificity of 68.95%, 0.52, and 0.77, respectively. Rahim and Hassan (2021) conducted a comparison study between Deep Learning (DL) and ML techniques (SVM) to predict the crash severity based on crash data between 2014 and 2018 in Louisiana. They used the image transformation DL tool, CNN, to convert the variables into images. The study explored that the deep learning technique provided better accuracy than ML methods based on precision and recall [29]. Shiran et al. implemented Multiple Logistic Regression (MLR), Decision Tree (DT) techniques, and Artificial Neural Network (ANN) to predict the crash severity at five severity levels, including property damage only, fatality, severe injury, other visible injuries, and complaint of pain based on the traffic crash records for State Highways in California. The study found that a DT model, C5.0, produced the best performance among all the models (ANN, MLR, and MLP) [30]. Hossain et al. used unsupervised learning techniques (JCA and ARM) to investigate the injury and fatal crash patterns of teenagers [17]. According to the study, unsupervised learning techniques have the benefit of effectively managing noisy and missing data without decreasing the size of the dataset.
3. Data Overview
The data utilized in this research were provided by the KDOT database, consisting of 117,606 crashes, including 1,817 fatal crashes that occurred between 2016 and 2020. The dataset included a variety of environmental, highway, geographical, accident class, and other event information in addition to three degrees of accident severity (PDO, injury, and death). All variables were categorical. Table 1 provides a summary of the dataset.
| Variable Name | Variable Description/Levels |
|---|---|
| Accident severity | Property damage only; injury; fatal |
| Work zone category | Lane closure; lane shift - crossover; shoulder or median work; moving vehicles |
| Light conditions | Daylight; dark - no street lights; dark - street lights on; dawn; dusk |
| Weather conditions | No adverse conditions; rain, mist or drizzle; snow; freezing rain; strong winds; fog; snow and winds; sleet; rain and winds; smoke; rain and fog; sleet and fog |
| Surface type | Blacktop; concrete; gravel; dirt; brick |
| Collision with another vehicle - First Harmful Event (FHE) | Rear end; angle-side impact; sideswipe - same direction; head-on; sideswipe - opposite direction; backed into |
| Damage | Disabling; functional; destroyed; minor |
| Surface condition | Dry; wet; ice or snow packed; snow; mud, dirt, or sand; slush; standing or moving water |
| Accident location description | Non-intersection on the roadway; intersection on the roadway; roadside - no shoulder-off roadway; interchange area on the roadway; median-off roadway; shoulder; parking lot, rest area; toll plaza; crossover on roadway |
| Intersection type | 4-way intersection; part of interchange; T-intersection; 5-way or more; Y-intersection; roundabout; L-intersection; traffic circle |
| Accident class - First Harmful Event (FHE) | Collision with another motor vehicle; collision with a fixed object; collision with an animal; overturned; collision with a parked motor vehicle; other non-collision; collision with another object; collision with pedestrian; collision with pedal cycle; collision with railway train |
| Body type | Automobile; sport utility vehicle; pickup truck, van; tractor-trailer(s); motorcycle; large truck; farm equipment; camper-rv; transit (city); bus; cross-country bus; train |
| Maneuver | Strain-following road; left turn; stopped in traffic; slowing or stopping; avoiding maneuver; negotiating a curve; right turn; stopped awaiting turn; changing lanes; overtaking (passing); merging; U-turn; parking; disabled in roadway |
| Lane class | Four lanes divided; two lanes undivided; six lanes divided; eight lanes divided; four lanes undivided; seven lanes divided; five lanes divided; two lanes divided; nine lanes divided; three lanes undivided |
| Lane direction description | Northbound; eastbound; southbound; westbound |
| Median type | Depressed median; barrier; raised median with curbs; cable barrier median; raised with turning lanes; painted median |
| Rumble strips | Inside right; right shoulder; left and right; center; center, left and right; inside shoulder; left shoulder |
| Speed limit | 20 mph to 75 mph |
| On-road number of lanes | Two lanes; four to six lanes; seven or more; three lanes; one lane |
Some of the significant findings regarding fatal crashes include the following:
- Non-intersection fatal crashes are more frequent in dark conditions (43%) than at intersections or interchanges (29%).
- Pedestrian fatal collisions are almost twice as likely to occur in dark conditions (69%) compared to all fatal crashes (36%).
- Approximately 44% of all fatal collisions involving multiple vehicles and 72% of fatal angle collisions occur at intersections or are intersection-related.
- The head-on crashes that result in fatalities on two-lane, undivided highways account for 76% of all collisions.
3.1. Feature Selection and Data Preparation
Feature selection offers several benefits, including the reduction of overfitting, improved model accuracy, and decreased training time, which makes it a highly valuable process for our research. We utilized feature selection techniques to identify the most significant factors that contribute to fatal crashes. Our approach involved implementing three distinct techniques: the SelectKBest method, the chi-squared test, and the correlation matrix. By utilizing these methods, we were able to select the most appropriate independent variables, which served as the most accurate predictors for our dependent variable, namely, fatal crashes.
The scikit-learn library's SelectKBest method is a useful resource for obtaining the top features from a given dataset. With this classifier approach, features are chosen based on the k highest scores. This algorithm features a scoring function that employs the chi-squared formula. Speed limit, lane number, vehicle body type, collision with another vehicle - first harmful event (FHE), accident site, light condition, maneuver type, surface condition, surface type, and weather condition were among the top 10 variables generated by this approach. Fig. (1) depicts a correlation matrix to clearly explain how the variables are interconnected. The correlation coefficients were computed using the Pearson method. With the help of this correlation matrix, additional validation for the SelectKBest classifier was carried out.
The raw data require preprocessing and normalizing before feeding into the model so that the machine can effectively learn information from the data and predict accordingly. All the independent variables were categorical and were formed into several dummy variables. The crashes involving property damage had been removed from consideration for the three accident
severity groups (PDO, injury, and death crashes). This implies that the algorithms that have been used could clearly distinguish between crashes leading to injury and those leading to death, further allowing the models to distinguish the contributing factors behind fatal crashes and injury crashes. After feature selection and engineering, the dataset was imbalanced as the number of data points available for prediction classes (fatal and non-fatal crashes) was different. Synthetic Minority Over-sampling TEchnique (SMOTE), a resampling approach, had been used to address the issue of the unbalanced dataset. By combining over-sampling, the minority class, with under-sampling, the majority class, Chawla et al. developed this method to enhance classifier performance [31]. From SMOTE analysis, 3,634 observations were obtained, and they were equally distributed with positive and negative outcomes. After cleaning and preprocessing the data, 65%, 15%, and 20% of the total dataset were used for training, validation, and testing, respectively.
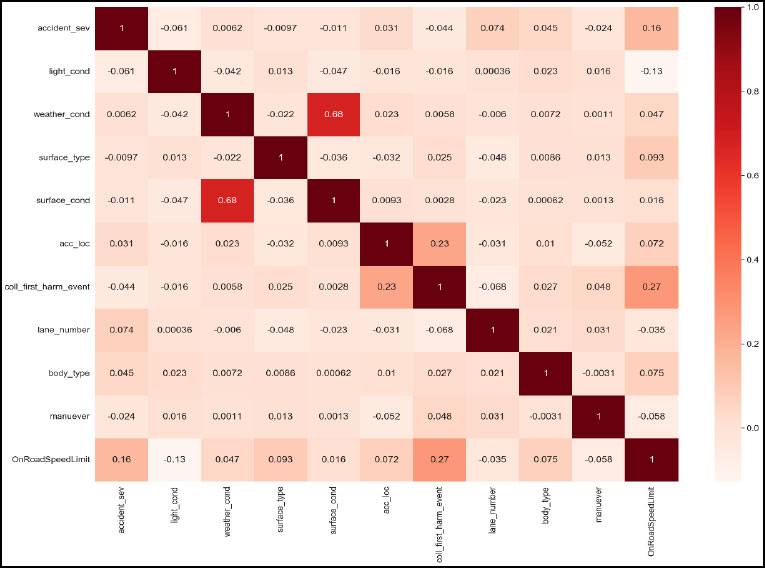 |
Fig. (1). Correlation matrix. |
4. METHODOLOGY
There were two major parts of the methodology used in this study. Fig. (2) depicts the methodology in a framework for providing a better understanding.
4.1. Prediction Models
In this study, a statistical model (multiple logistic regression), different types of ML models (random forest, XGBoost, support vector machine), and two neural network models (deep neural network, multilayer perceptron) were developed to classify the fatal crashes, and their prediction performances were compared.
4.1.1. Random Forest
The supervised ML algorithm, known as random forest, is based on decision tree algorithms and was originally introduced by Breiman [32]. This algorithm employs ensemble learning, which combines multiple classifiers to solve complex problems. By averaging or taking the mean of the outputs from multiple decision trees, the algorithm predicts outcomes. Random forest algorithms address the limitations of decision tree algorithms by minimizing overfitting. The bagging method is used by random forest to generate the necessary predictions. Bagging involves using multiple samples of training data instead of just one, which produces decision trees with different outputs. These outputs are ranked, and the highest is selected as the final output. Before using the method, the model's parameters, such as the number of trees and the number of variables selected at each split, must be established.
4.1.2. Support Vector Machine (SVM)
Support Vector Machine (SVM) is a popular machine learning algorithm developed by Boser et al. that can be used both for classification and regression analysis [33]. SVM tries to find the best hyperplane that separates different classes of data points. The hyperplane is selected based on the maximum margin between the closest data points from different classes. SVM can also handle non-linearly separable data by using kernel functions to transform the data into a higher-dimensional space. However, SVM is sensitive to the choice of kernel function and requires careful tuning of its parameters, making it computationally intensive and less suitable for large datasets.
4.1.3. XGBoost
XGBoost (eXtreme Gradient Boosting) is a popular ML algorithm that uses decision trees to model and predict outcomes. Developed in 2016 by Chen and Guestrin, it is an improvement of the Gradient-Boosted Decision Tree (GBDT) algorithm [34]. It works by iteratively training a sequence of decision trees to improve its predictions by minimizing a loss function. In each iteration, the algorithm adjusts the weights of misclassified data points to focus on harder-to-predict cases. It offers high flexibility, parallel tree boosting, and built-in cross-validation, including using regularization techniques to prevent overfitting, which is a common problem in decision tree-based algorithms. Previous research has demonstrated the successful application of XGBoost in crash severity analysis [35-37].
4.1.4. Deep Neural Network
Neural Networks (NN) are a form of AI that imitates the human brain's ability to identify complex patterns using algorithms. These networks use neurons, layers, and activation functions to cluster and classify labeled data. The conventional NN consists of three layers: an input layer, a hidden layer, and an output layer. In this study, the selected 10 important variables from the feature selection process have been fed forward to the input neurons (Fig. 3) and the output neuron has been set to a binary outcome, which indicated whether a crash is fatal or not (Fig. 3). When multiple hidden layers are employed, the model becomes a Deep Neural Network (DNN), which can learn more complex patterns and enhance prediction performance. Fig. (3) portrays the process of how information flows through a DNN. The DNN begins with input data that is directed toward neurons in the input layer. These neurons send the output to neurons in the hidden layers. The hidden layers then pass on their outputs to the output layer to produce the result as a binary number or probability. Each layer is equipped with an activation function and the connection between two neurons in consecutive layers has a weight assigned to it. During each training epoch, the learning rate and optimizer adjust these weights to reduce the loss function.
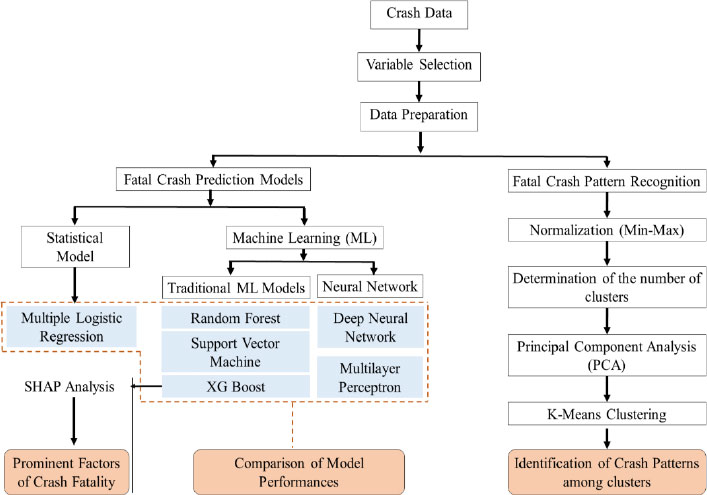 |
Fig. (2). Research methodology. |
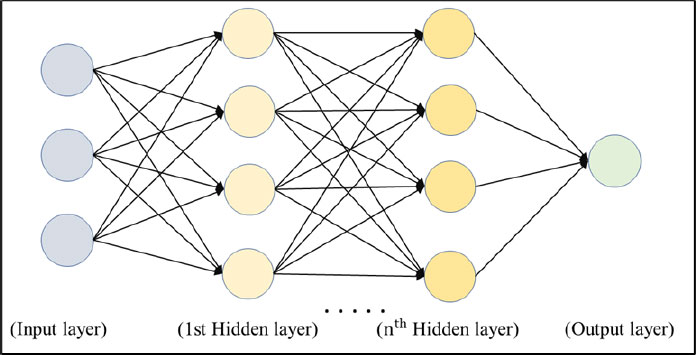 |
Fig. (3). Deep neural network. |
4.1.5. Multi-layer Perceptron
A Multi-Layer Perceptron (MLP) is a supervised learning algorithm. It involves an activation function of
 by training on a dataset, where m and 0 represent the number of dimensions for input and output, respectively. The network is composed of an input layer, one or more hidden layers, and an output layer, each containing multiple neurons (Fig. 4). Similar to the NN, in MLP, the input neurons represent the 10 selected independent variables and the output layer (f(X) in Fig. 4) indicates the binary outcome of a crash being fatal or not. During training, the algorithm adjusts the weights between neurons to minimize the loss function, using backpropagation to propagate the error signal through the network. The activation function of each neuron introduces nonlinearity to the model, allowing for the detection of more complex patterns in the data. Despite its effectiveness, MLP classifiers require careful tuning of hyperparameters and can be computationally expensive, especially for large datasets.
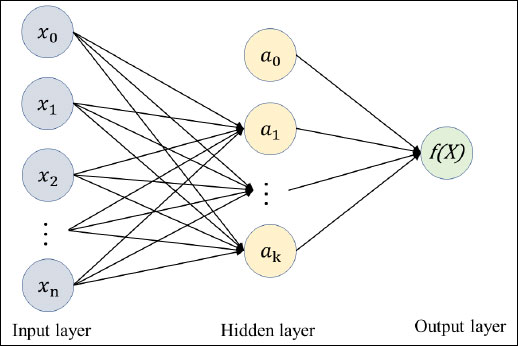 |
Fig. (4). Multi-layer perceptron. |
4.2. Model Selection Rationale
There are several reasons for choosing certain models. Firstly, the Multiple Logistic Regression (MLR) model was employed to assess the adequacy of the model in terms of capturing intricate and non-linear relationships in the crash dataset. Secondly, ML models were implemented to compare their performance with the BLR model in terms of accuracy and interpretability. Thirdly, the crash dataset generally consists of high-dimensional data with non-linear correlations. To address such data complications, the SVM model can be used, as it is effective for handling datasets with many features, capable of extracting non-linear relationships, and is less prone to overfitting [38, 39]. Fourthly, randomness and irregularities are common in crash occurrence data where true relationships between the variables can be obscured at times. The ensemble methods (RF and XGBoost) can be robust to irregularities and randomness and often produce higher accuracy as they combine multiple models [40-43]. RF can handle complex datasets, is less prone to overfit, and enables efficient parallelization, rendering it well-suited for the analysis of large datasets [31, 43-45]. Boosting algorithms (XGBoost) not only have the capability to integrate several models, but also possess gradients that enable the model to iteratively rectify the mistakes made by preceding models [41, 46-48]. Lastly, the neural network models are subsets of ML that have the capacity to capture complex patterns and relationships, are known for excelling in tasks involving large datasets and intricate patterns as they contain neurons, and are trained using the stochastic gradient descent optimization algorithm [49].
4.3. Performance Metrics
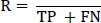
This study involved testing and evaluating various machine learning models using different performance metrics obtained from the confusion matrix. The models were developed for binary classification of fatal crashes. The performance metrics used in the study included accuracy, sensitivity, recall, and F1-score, which were calculated based on true positive (TP), true negative (TN), false positive (FP), and false negative (FN) outcomes (Fig. 5).
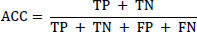
From the confusion matrix, the overall accuracy (ACC), Precision (P), Recall (R), and F1-score (F) have been calculated (equations 2-5) to use as the performance metrics for the developed models (Eqs 1-4).
 |
(1) |
 |
(2) |
 |
(3) |
 |
(4) |
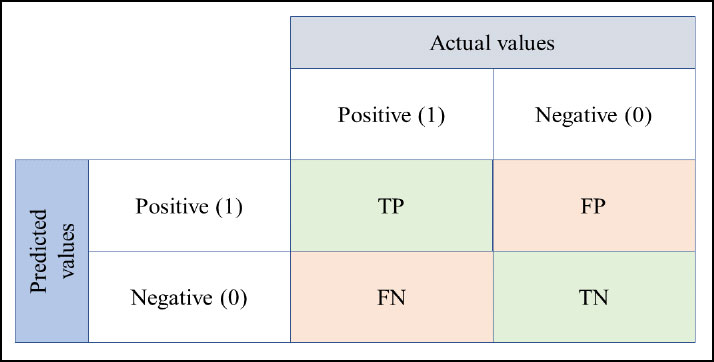 |
Fig. (5). Confusion matrix. |
4.4. Clustering Algorithm
A popular technique for grouping data based on both quantitative and qualitative variables is the K-means algorithm. The process is started by setting a set of centroids, and the method is based on an iterative algorithm. A squared Euclidian distance metric is then used to assign each data point to be clustered to its nearest centroid. The objective is to minimize the sum of average pair-wise distances within cluster dissimilarity before assigning a point to a cluster. The centroids are updated by averaging all the points assigned to each cluster. Therefore, the centroids are established by reducing the sum of squared errors. This process is repeated until there is no significant change in the assignment of data points to each centroid.
Principal Component Analysis (PCA) is a dimension-reduction technique that can be combined with K-means clustering [18]. After dividing the dataset into clusters, running the PCA can reduce the dimension of the clusters to better visualize the clusters. PCA-based dimension reduction picks up the dimensions with the largest variances [50]. The elbow method was used to determine the optimal number of clusters. The point where the elbow curve began to bend or lower the slope was considered the optimum number of clusters.
5. RESULT AND DISCUSSION
5.1. Model Performances and Comparison
The ML models contain various hyperparameters that require fine-tuning. Thus, we optimized these hyperparameters through the grid search method and multiple iterations. Our evaluation of model performance relied on previously established performance metrics. Among all the models, MLR performed poorly in detecting a fatal crash as the dataset contained complex non-linear relationships between the variables. Table 2 shows that the F1 score for the predicted fatal crashes was 0.49 for the MLR model, which is very low compared to other models.
Among the three ML models, XGBoost showed the best performance with an overall accuracy of 0.82. The F1 scores of this model were 0.83 and 0.81, both being higher than the other ML models. Random Forest (RF) exhibited the second-best performance in terms of accuracy and F1 score. However, the shortcoming of RF is that it takes a long time to train as it builds, analyzes, and combines a bunch of decision trees. SVM performed a bit faster than XGBoost, but XGBoost outperformed SVM in terms of overall accuracy and F1 scores.
Neural network models performed better than statistical and ML models. Deep Neural Network (DNN) outperformed all the models with an average accuracy of 0.85. Not only the overall accuracy but also the precision and F1-scores were greater than the rest of the models. This may be because deep neural networks have several deep layers and neurons that can refine information to produce more accurate output. This kind of model can extract the complex interrelationship between the predictor variables and the target variable and predict accordingly. As DNN can have loops and consists of a greater number of neurons and hidden layers than MLP, it takes a bit longer time to train, but produces higher overall accuracy than MLP.
5.2. Prominent Contributing Factors of Crash Fatality (SHAP Analysis)
The interpretability of ML models has been a limitation in understanding their predictions. To address this limitation, Lundberg and Lee (2017) recently introduced a new approach called “SHapley Additive exPlanations (SHAP) analysis,” which aims to explain the impact of input variables on the model's output [50]. In this study, the SHAP analysis was performed on the XGBoost to interpret the model prediction.
| Model Type | Model Name | Accuracy | Precision | Recall | F1 Score | Prediction | |
|---|---|---|---|---|---|---|---|
| Statistical model | Multiple Logistic Regression (MLR) | 0.67 | 0.73 | 0.79 | 0.76 | Non-fatal crash | |
| 0.53 | 0.45 | 0.49 | Fatal crash | ||||
| Machine Learning (ML) models | Gradient Boosting ML | XGBoost | 0.82 | 0.8 | 0.85 | 0.83 | Non-fatal crash |
| 0.84 | 0.79 | 0.81 | Fatal crash | ||||
| Traditional tree-based ML | Random Forest (RF) | 0.81 | 0.80 | 0.86 | 0.83 | Non-fatal crash | |
| 0.83 | 0.76 | 0.80 | Fatal crash | ||||
| Traditional supervised ML | SVM | 0.8 | 0.78 | 0.82 | 0.80 | Non-fatal crash | |
| 0.82 | 0.78 | 0.80 | Fatal crash | ||||
| Neural networks | DNN | 0.85 | 0.84 | 0.86 | 0.85 | Non-fatal crash | |
| 0.85 | 0.82 | 0.84 | Fatal crash | ||||
| MLP | 0.81 | 0.79 | 0.85 | 0.82 | Non-fatal crash | ||
| 0.85 | 0.75 | 0.80 | Fatal crash | ||||
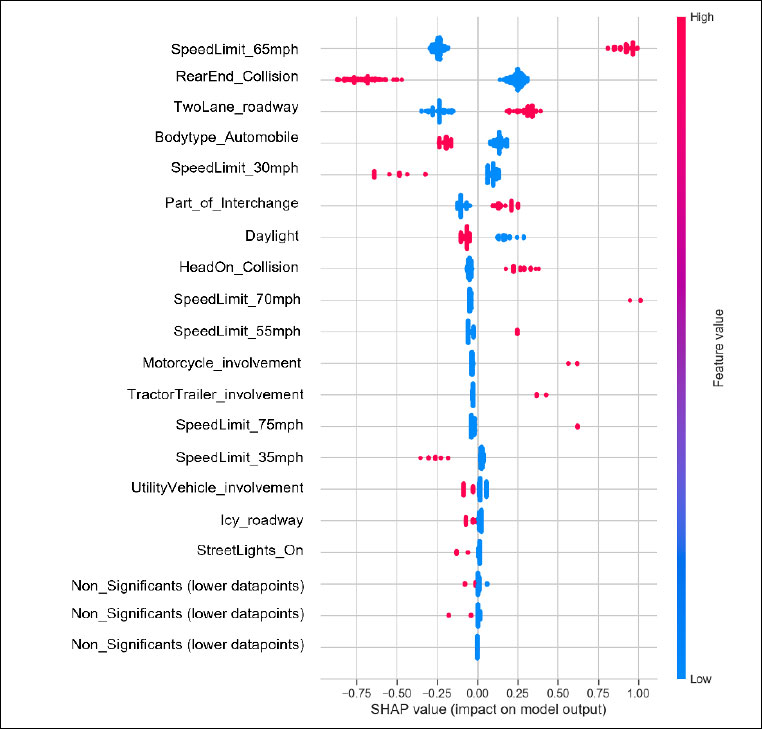 |
Fig. (6). Beeswarm graph from SHAP. |
Fig. (6) illustrates the relative effect of some important variables on the model output (crash fatality). The blue and red colors represent the lower and higher values of a feature, respectively, and the x-axis shows the SHAP value of the features. From Fig. (6), it can be observed that the speed limit of 65 mph has the highest impact on prediction where the relationship between this feature and crash fatality is proportional. On the contrary, the reciprocal relationship between the speed limit of 30 mph and crash fatality indicates that, when the speed limit is 65 mph, there is a higher probability of a fatal crash occurrence than driving on a posted speed limit of 30 mph.
Rear-end collision has been found to have a lower probability of leading to a crash fatality, whereas head-on collision has been found to be one of the most prominent factors for crash fatality. The two-way road has been found as the second most influential feature for fatality occurrence. In addition, in the middle of an interchange, the chances of fatal crash occurrence increase compared to the average model prediction. Fig. (6) shows that even though a small amount of data were present involving bike accidents (lower red and blue dots for motorcycles), the probability of fatal crash occurrences was higher in number than non-fatal crashes. This indicates that, when a motorcycle or tractor-trailer is involved in a crash, it is more likely to be a fatal crash. It can also be seen that the daylight and the presence of streetlights lower the chance of getting into a fatal crash. This visual representation describes, on a global scale, how each characteristic contributes to the average model forecast of fatality occurrences.
5.3. K-means Clustering with PCA
Prediction of a fatal crash and recognizing the underlying pattern is a fundamental need with the advent of numerous data. The underlying pattern of the crash might reveal the characteristics of the crash, which may be related to those variables that can aid traffic safety measures.
Based on the feature selection results, eight important variables (road surface type, number of lanes, weather condition, accident location, vehicle body type, light condition, vehicle maneuver, and on-the-road speed limit) were selected to conduct K-means clustering. Clusters were further visualized based on each level of the variables in the data. The optimum number of clusters was determined using the elbow method shown in Fig. (7).
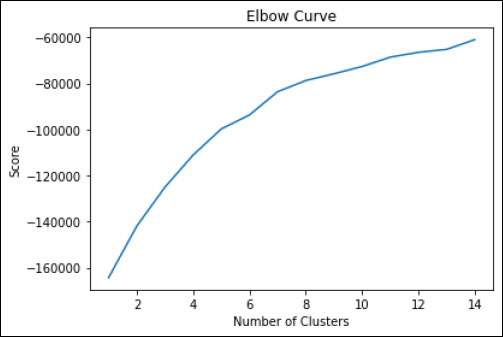 |
Fig. (7). Elbow curve to determine the optimum number of clusters. |
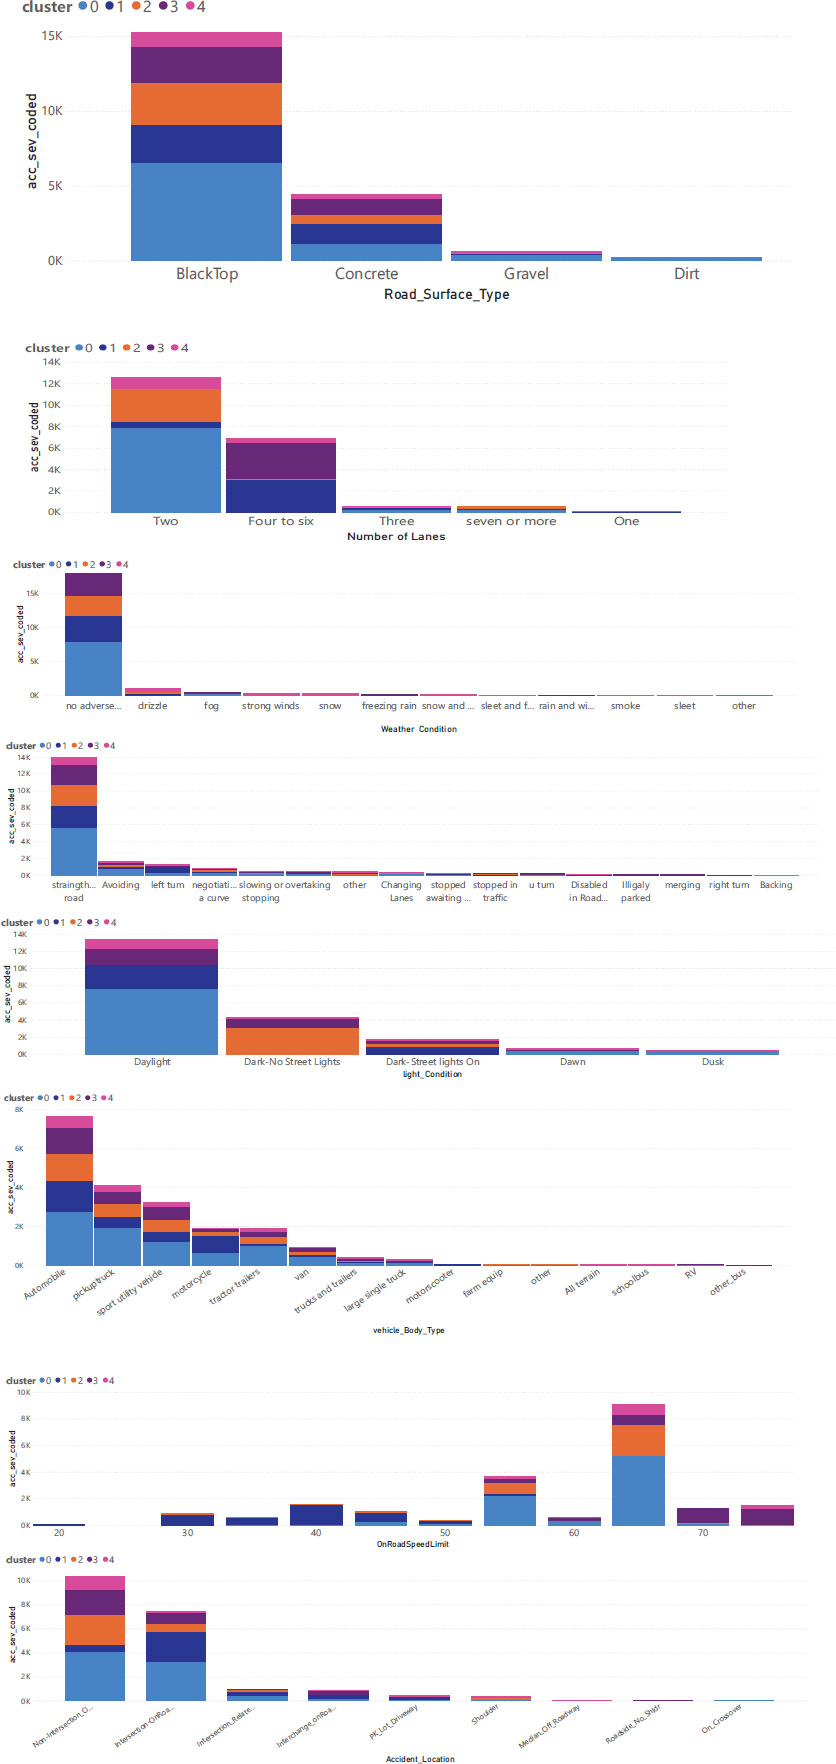 |
Fig. (8). Visualization of clusters. |
Fig. (7) shows a bend in the curve approximately after 5 clusters. Therefore, 5 clusters were taken for analysis. The clusters are further visualized in Fig. (8). A practitioner can get an idea from visualization like this about which variables are prominent in which cluster.
Based on Fig. (8), the representative scenario from each cluster can be described below:
Cluster 0 implies mostly blacktop or concrete surface, two to six lanes, both intersections and roadways, and a wide range of vehicles. Since this cluster contains mostly usual conditions, this cluster does not imply much about special conditions or indications.
Cluster 1 implies both blacktop and concrete surfaces, two to six lanes, both intersections, and roadways, but mostly on intersections, a wide range of vehicles, daylight or with streetlights, straight or left turns, and a speed limit of 30 to 45 mph. This cluster emphasizes the fatal crashes at intersections. Also, the speed limit is between 30 to 45 mph, which emphasizes local streets. It can be observed that left turns are one of the crucial maneuvers in terms of the occurrence of fatal crashes. Streetlights have also been found to be very significant.
Cluster 2 implies mostly blacktop surface, 2 lanes, drizzle or normal conditions, non-intersection roadway, and intersections, straight following a road, a speed limit of 65 mph, and dark with no streetlights. This cluster gives a notion that a blacktop surface during drizzle conditions on a two-lane road has more probability of a fatal crash. The cluster indicates dark with no street light conditions, which are vital for two-lane highways since the speed limit is 65mph. Also, the maneuvers include avoiding and negotiating a curve, which is very crucial on two-lane highways that may lead to a fatal crash. Considering these factors, practitioners can take specific countermeasures to mitigate fatal crashes on two-lane highways.
Cluster 3 implies blacktop or concrete surface, four to six lanes, straight following road, non-intersection, intersection on roadways, and a speed limit above 70 mph. It focuses on high-speed limits with four to six lanes, which may represent interstate highways.
Cluster 4 implies a blacktop or concrete surface on two-lane highways, with special conditions, like drizzle, strong winds, or snow. This emphasizes adverse weather conditions on two-lane highways. A clear difference is that cluster 2 mostly involves dark conditions, whereas cluster 4 represents daylight.
Each cluster emphasizes certain aspects of the variables that make them unique.
CONCLUSION AND RECOMMENDATIONS
Traffic deaths are a major issue worldwide, particularly among younger people. The United States has been working to combat this problem for many years and has adopted the “zero deaths” initiative, which aims to eliminate traffic fatalities and improve safety for all road users. Using advanced techniques, such as ML and neural networks, to predict fatal crashes could be a valuable tool in eliminating traffic deaths. While several studies have been conducted on crash severity, few have analyzed and predicted specific types of crashes, such as fatal crashes. Identifying the key factors associated with fatal crashes and predicting their occurrence can help to prevent them from happening.
In this study, several branches and categories of supervised ML models have been implemented and their results have been compared. Different categories of ML models have their advantages and shortcomings. The suitability and feasibility of an ML model heavily depend on the data structure and the goal of the study. Therefore, it is ideal to develop various ML models utilizing the same dataset to get a comprehensive understanding of each model’s capability in relation to a specific dataset and the desired goal. This study aimed to develop five different ML models to predict fatal crashes, with neural networks and MLR showing the best and the worst performances, respectively, among all the models in terms of model accuracy, precision, recall, and F1-score. Neural networks excel at capturing complex patterns and relationships in data, making them particularly effective in scenarios with intricate interactions between variables. The DNN outperformed all the other models producing an accuracy of 0.85, with XGBoost and MLP models coming second with an accuracy of 0.82 and 0.81, respectively. Although MLP and RF showed similar accuracy in prediction, the F1-score was higher in MLP than in RF. This indicates that MLP was able to identify fatal crashes more effectively than RF. These models were designed to identify fatal crashes in a dataset that included both injuries and fatalities, which can help researchers and practitioners better understand the causes and nature of fatal crashes. The predicted models can be useful for improving road safety, as they provide insight into the likelihood of the occurrence of fatal crashes, which can help policymakers take appropriate measures to prevent them. In addition to prediction, SHAP analysis was used to identify the most significant factors related to fatality. The analysis identified that the speed limit lower than 40 mph minimized the chances of fatal crashes and 65 mph produced the highest fatal crashes in Kansas. Moreover, nighttime, darker road conditions, two-lane highways, highway interchange areas, motorcycle and tractor-trailer involvement, and head-on collision have been found to be influential factors for fatal crash occurrences in Kansas.
This study has also employed clustering analysis to recognize patterns of fatal crashes using K-means clustering with PCA. The clusters were able to discern certain scenarios of fatal crashes. Based on the results, some of the special patterns for fatal crashes can be interpreted as below:
- Intersections with speed limit 30 to 45 mph, vehicle maneuvering left turn, and no light condition on street.
- Two-lane highways, speed limit of 65 mph and drizzle condition, no street light condition, and vehicle maneuvers, including avoiding and negotiating a curve.
- Two-lane highways with a speed limit of 65 mph, daylight conditions, drizzle, strong wind or snow conditions, straight following road, or avoiding maneuvers.
The results obtained from cluster analysis can facilitate transportation professionals with representative scenarios, which can benefit in identifying potential fatal crash conditions.
The study has some noteworthy limitations. The data regarding roadway design parameters and human factor parameters were unavailable. Additionally, the inclusion of crash data from different regions would broaden the inference of the crash prediction model and expand the boundaries by which the results could be considered more reliable. K-means clustering has been proven to work better for quantitative variables. Therefore, other clustering methods, like K-prototypes or K-medoids, etc., should be explored to compare the reliability. It may also be beneficial to group variables into fewer levels to interpret clusters more specifically. Future research and further exploration of the capabilities of AI will be greatly impactful on the efforts to improve traffic safety through crash prevention.
LIST OF ABBREVIATIONS
| KDOT | = Kansas Department of Transportation |
| VRUs | = Vulnerable Road Users |
| SHSP | = Strategic Highway Safety Plan |
CONSENT FOR PUBLICATION
Not applicable.
AVAILABILITY OF DATA AND MATERIALS
The data that support the findings of this study are available from the corresponding author [A.H] on special request.
FUNDING
None.
CONFLICT OF INTEREST
The authors declare no conflict of interest, financial or otherwise.
ACKNOWLEDGEMENTS
The authors wish to express gratitude to KDOT for providing the data.
REFERENCES
| [1] | Deaths by Age and Cause - Data Details, Available from:https://injuryfacts.nsc.org/all-injuries/deaths-by-demographics/deaths-by-age/data-details/ (Accessed 9.3.23). |
| [2] | FHWA, "Zero Deaths and Safe System", Available from:https://highways.dot.gov/safety/zero-deaths (Accessed 9.3.23). |
| [3] | E. Macioszek, A. Granà, and S. Krawiec, "Identification of factors increasing the risk of pedestrian death in road accidents involving a pedestrian with a motor vehicle", Arch. Transp., vol. 65, no. 1, pp. 7-25, 2023. |
| [4] | FHWA, "Strategic Highway Safety Plan (SHSP)", Available from:https://highways.dot.gov/safety/hsip/shsp (Accessed 9.3.23). |
| [5] | A.E. Ezugwu, A.M. Ikotun, O.O. Oyelade, L. Abualigah, J.O. Agushaka, C.I. Eke, and A.A. Akinyelu, "A comprehensive survey of clustering algorithms: State-of-the-art machine learning applications, taxonomy, challenges, and future research prospects", Eng. Appl. Artif. Intell., vol. 110, p. 104743, 2022. |
| [6] | A. Iranitalab, and A. Khattak, "Comparison of four statistical and machine learning methods for crash severity prediction", Accid. Anal. Prev., vol. 108, pp. 27-36, 2017. |
| [7] | E.C. Cerrelli, Fatal crash involvements--What are the odds?", National Center for Statistics and Analysis–Research and Development, NHTSA Research Note, Washington, D.C., USA, 1997. |
| [8] | D. Eustace, O. Almutairi, and P. Hovey, "Modeling factors contributing to injury and fatality of run-off-road crashes in ohio", Adv. Transp. Stud. Sect. B 40, pp. 53-68, 2016. |
| [9] | L.S.R. Pitta, J.L. Quintas, I.O.A. Trindade, P. Belchior, K.S.D. Gameiro, C.M. Gomes, O.T. Nóbrega, and E.F. Camargos, "Older drivers are at increased risk of fatal crash involvement: Results of a systematic review and meta-analysis", Arch. Gerontol. Geriatr., vol. 95, p. 104414, 2021. |
| [10] | S. Altwaijri, M.A. Quddus, and A. Bristow, "Factors affecting severity of traffic crashes in riyadh city", Transportation Research Board 90th Annual Meeting,. Washington DC, United States, 23-27 Jan, 2011. |
| [11] | N. Ahmad, A. Ahmed, B. Wali, and T.U. Saeed, "Exploring factors associated with crash severity on motorways in Pakistan", Transport, vol. 175, no. 4, pp. 189-198, 2022. |
| [12] | R. Tamakloe, and D. Park, "Factors influencing fatal vehicle-involved crash consequence metrics at spatio-temporal hotspots in South Korea: application of GIS and machine learning techniques", Int. J. Urban Sci., vol. 27, no. 3, pp. 483-517, 2023. |
| [13] | E. Macioszek, and D. Iwanowicz, "A back-of-queue model of a signal-controlled intersection approach developed based on analysis of vehicle driver behavior", Energies, vol. 14, no. 4, p. 1204, 2021. |
| [14] | C. Gu, J. Xu, C. Gao, M. Mu, G. e, and Y. Ma, "Multivariate analysis of roadway multi-fatality crashes using association rules mining and rules graph structures: A case study in China", PLoS One, vol. 17, no. 10, p. e0276817, 2022. |
| [15] | A.J. Ghandour, H. Hammoud, and S. Al-Hajj, "Analyzing factors associated with fatal road crashes: A machine learning approach", Int. J. Environ. Res. Public Health, vol. 17, no. 11, p. 4111, 2020. |
| [16] | M.M. Hossain, X. Sun, E. Mitran, and M.A. Rahman, "Investigating fatal and injury crash patterns of teen drivers with unsupervised learning algorithms", IATSS Res., vol. 45, no. 4, pp. 561-573, 2021. |
| [17] | R. Saha, M.T. Tariq, M. Hadi, and Y. Xiao, "Pattern recognition using clustering analysis to support transportation system management, operations, and modeling", J. Adv. Transp., vol. 2019, pp. 1-12, 2019. |
| [18] | Z. Li, C. Chen, Y. Ci, G. Zhang, Q. Wu, C. Liu, and Z.S. Qian, "Examining driver injury severity in intersection-related crashes using cluster analysis and hierarchical Bayesian models", Accid. Anal. Prev., vol. 120, pp. 139-151, 2018. |
| [19] | A. Rahimi, G. Azimi, H. Asgari, and X. Jin, "Clustering approach toward large truck crash analysis", Transp. Res. Rec., vol. 2673, no. 8, pp. 73-85, 2019. |
| [20] | Y. Yuan, M. Yang, Y. Guo, S. Rasouli, Z. Gan, and Y. Ren, "Risk factors associated with truck-involved fatal crash severity: Analyzing their impact for different groups of truck drivers", J. Safety Res., vol. 76, pp. 154-165, 2021. |
| [21] | J. Zhang, Z. Li, Z. Pu, and C. Xu, "Comparing prediction performance for crash injury severity among various machine learning and statistical methods", IEEE Access, vol. 6, pp. 60079-60087, 2018. |
| [22] | P.T. Savolainen, F.L. Mannering, D. Lord, and M.A. Quddus, "The statistical analysis of highway crash-injury severities: A review and assessment of methodological alternatives", Accid. Anal. Prev., vol. 43, no. 5, pp. 1666-1676, 2011. |
| [23] | A. Abdulhafedh, "Road crash prediction models: different statistical modeling approaches", J. Transp. Technol., vol. 7, no. 2, pp. 190-205, 2017. |
| [24] | A. Ahmadi, A. Jahangiri, V. Berardi, and S.G. Machiani, "Crash severity analysis of rear-end crashes in California using statistical and machine learning classification methods", J. Transp. Saf. Secur., vol. 12, no. 4, pp. 522-546, 2020. |
| [25] | L. Wahab, and H. Jiang, "Severity prediction of motorcycle crashes with machine learning methods", Int. J. Crashworthin., vol. 25, no. 5, pp. 485-492, 2020. |
| [26] | M.A. Abdel-Aty, and H.T. Abdelwahab, "Predicting injury severity levels in traffic crashes: A modeling comparison", J. Transp. Eng., vol. 130, no. 2, pp. 204-210, 2004. |
| [27] | A. Theofilatos, C. Chen, and C. Antoniou, "Comparing machine learning and deep learning methods for real-time crash prediction", Transp. Res. Rec., vol. 2673, no. 8, pp. 169-178, 2019. |
| [28] | M.A. Rahim, and H.M. Hassan, "A deep learning based traffic crash severity prediction framework", Accid. Anal. Prev., vol. 154, p. 106090, 2021. |
| [29] | G. Shiran, R. Imaninasab, and R. Khayamim, "Crash severity analysis of highways based on multinomial logistic regression model, decision tree techniques, and artificial neural network: A modeling comparison", Sustainability, vol. 13, no. 10, p. 5670, 2021. |
| [30] | N.V. Chawla, K.W. Bowyer, L.O. Hall, and W.P. Kegelmeyer, "SMOTE: Synthetic minority over-sampling technique", J. Artif. Intell. Res., vol. 16, pp. 321-357, 2002. |
| [31] | L. Breiman, "Random forests", Mach. Learn., vol. 45, no. 1, pp. 5-32, 2001. |
| [32] | B.E. Boser, I.M. Guyon, and V.N. Vapnik, "A training algorithm for optimal margin classifiers", Proceedings of the Fifth Annual Workshop on Computational Learning Theory, COLT ’92. New York, NY, USA, 1992, pp. 144-152. |
| [33] | T. Chen, and C. Guestrin, "XGBoost: A scalable tree boosting system", Proceedings of the 22nd ACM SIGKDD International Conference on Knowledge Discovery and Data Mining, KDD ’16,. New York, NY, USA, 2016, p. 2939785. |
| [34] | H. Chen, H. Chen, Z. Liu, X. Sun, and R. Zhou, "Analysis of factors affecting the severity of automated vehicle crashes using XGBoost model combining POI data", J. Adv. Transp., vol. 2020, pp. 1-12, 2020. |
| [35] | M. Guo, Z. Yuan, B. Janson, Y. Peng, Y. Yang, and W. Wang, "Older pedestrian traffic crashes severity analysis based on an emerging machine learning XGBoost", Sustainability, vol. 13, no. 2, p. 926, 2021. |
| [36] | S. Wu, Q. Yuan, Z. Yan, and Q. Xu, "Analyzing accident injury severity via an extreme gradient boosting (XGBoost) model", J. Adv. Transp., vol. 2021, pp. 1-11, 2021. |
| [37] | S. Ketabchi, H. Moosaei, M. Razzaghi, and P.M. Pardalos, "An improvement on parametric $$$$ ν -support vector algorithm for classification", Ann. Oper. Res., vol. 276, no. 1-2, pp. 155-168, 2019. |
| [38] | M. Stamp, "A survey of machine learning algorithms and their application in information security", Guide to Vulnerability Analysis for Computer Networks and Systems., Springer, 2018. |
| [39] | S. Das, S. Datta, and B.B. Chaudhuri, "Handling data irregularities in classification: Foundations, trends, and future challenges", Pattern Recognit., vol. 81, pp. 674-693, 2018. |
| [40] | M. Sewell, "Ensemble learning", RN, vol. 11, pp. 1-34, 2008. |
| [41] | J. Yan, Y. Xu, Q. Cheng, S. Jiang, Q. Wang, Y. Xiao, C. Ma, J. Yan, and X. Wang, "LightGBM: accelerated genomically designed crop breeding through ensemble learning", Genome Biol., vol. 22, no. 1, p. 271, 2021. |
| [42] | Z. Yang, L. Li, X. Xu, B. Kailkhura, T. Xie, and B. Li, "On the certified robustness for ensemble models and beyond", Conference paper at ICLR.. 2022. |
| [43] | G. Biau, and E. Scornet, "A random forest guided tour", Test, vol. 25, no. 2, pp. 197-227, 2016. |
| [44] | A. Cutler, D.R. Cutler, and J.R. Stevens, "Random forests", Ensemble Machine Learning., Springer, 2012. |
| [45] | E. Al Daoud, "Comparison between XGBoost, LightGBM and CatBoost using a home credit dataset", Int. J. Comput. Inf. Eng., vol. 13, pp. 6-10, 2019. |
| [46] | N.H.A. Malek, W.F.W. Yaacob, Y.B. Wah, S.A.M. Nasir, N. Shaadan, and S.W. Indratno, "Comparison of ensemble hybrid sampling with bagging and boosting machine learning approach for imbalanced data", Indones. J. Electr. Eng. Comput. Sci., vol. 29, pp. 598-608, 2023. |
| [47] | X. Wen, Y. Xie, L. Wu, and L. Jiang, "Quantifying and comparing the effects of key risk factors on various types of roadway segment crashes with LightGBM and SHAP", Accid. Anal. Prev., vol. 159, p. 106261, 2021. |
| [48] | S.S.B. Masud, "Traffic time headway prediction and analysis: A deep learning approach", PhD Thesis, The University of Texas Rio Grande Valley., 2020. |
| [49] | C. Ding, and X. He, "K-means clustering via principal component analysis", Proceedings of the Twenty-First International Conference on Machine Learning, ICML ’04,. New York, NY, USA, 2004, p. 29. |
| [50] | S. Lundberg, and S.-I. Lee, "A unified approach to interpreting model predictions", NIPS'17: Proceedings of the 31st International Conference on Neural Information Processing Systems,. 2017. |