All published articles of this journal are available on ScienceDirect.

Road Safety Management ‒ The Need for a Systematic Approach
Abstract
In order to achieve significant improvements in road safety at the national level, there is a need for a systematic approach to road safety management with clear responsibilities and accountability. In this paper – after a review of the literature on guidelines, recommendations and research findings – twelve essential elements of such a systematic approach are pointed out, and corresponding relevant issues are discussed. These elements are: 1) Define the burden and nature of road casualties; 2) Gain commitment and support from decision makers; 3) Establish road safety policy; 4) Define institutional roles and responsibilities; 5) Identify road safety problems; 6) Set road safety targets; 7) Formulate a strategy and action plan; 8) Allocate responsibility for measures; 9) Ensure funding; 10) Apply measures with known effectiveness; 11) Monitor performance; and 12) Stimulate research and capacity building. The main conclusions are that: a) Monetary values of statistical life have to be established; b) The police register of accidents should be combined with the hospital register; c) Exposure data for all types of road users is necessary; d) The three-dimensional analysis of road safety problems should be employed; e) Safety performance indicators should be used; f) Only countermeasures with known effectiveness should be applied; g) Performance of countermeasures should be monitored on a yearly basis; and h) Commitment from decision makers is decisive!
1. INTRODUCTION
Human civilization is burdened by casualties from road traffic accidents and their costs to individuals and society. Some countries have managed to make progress in mitigating the number and severity of road accidents, but the situation in most countries is alarming and even getting worse [1]. There are some attempts to do something, but it turns out in many cases that these undertakings are non-systematic, fragmented and not knowledge-based, resulting in ineffective actions. There are a lot of opinions from decision makers, based on their own beliefs of what should be done, so road safety work often ends up with information campaigns, showing that decision makers are doing something. (The personal experience of the author during consultancy work with a road safety programme in a developing country was, for example, where resources were repeatedly redirected from installing low-cost engineering measures outside schools to educational measures directed at school children). These campaigns try to get the road user to behave in a safe way (in a system that has been built to be inherently unsafe). However, the effects of general campaigns are questionable; Vaa et al. [2], using meta-analysis, found that pure mass media campaigns (TV, radio, newspapers) have no effect on accidents. People have always made mistakes and will make mistakes, and information campaigns cannot make mistakes disappear. Hence, in a system built in a way in which mistakes can lead to accidents, accidents will occur [3]. Vaa et al. [2], analysing the effects of information, found no significant effects of campaigns aimed at pedestrians on accidents involving pedestrians.
Other transport modes do well; for a comparative analysis see [4]. In air traffic management, the slogan – “safety first” – is of paramount importance: safety comes first, then mobility (i.e. no safety -> no mobility). It is given that human errors or technology failure or organisational failure shall not lead to serious events. Non-conformity is handled promptly, professionally and continuously.
When it comes to road safety management (RSM), even if there is accumulated knowledge among road safety specialists on best practice and efficient countermeasures, the question is whether decision makers have the commitment to do something, and whether they are ready to engage in a systematic work and conscious of what such a systematic project should look like.
The aim of the work presented in this paper is to review the literature on guidelines, recommendations and research findings concerning road safety management at the national level, to point out essential elements for a systematic approach involving these elements, and to discuss some of the significant issues.
2. A REVIEW OF THE LITERATURE ON ROAD SAFETY MANAGEMENT
2.1. What do the Guidelines/Recommendations Tell Us?
The OECD [5] road safety report defines safety management as “a systematic process aimed at reducing the number and severity of road-related crashes” (p.97). Papadimitriou & Yannis [6] in their review of the literature, conclude that road safety management systems are complex, as they include various components (structures, plans, processes, outputs, tools, etc.) which make them difficult to describe in a standardised way. Nevertheless, effective organisation of RSM is seen as a prerequisite for achieving good road safety results.
The OECD [5] report identifies five main steps of planning procedure for developing and implementing road safety programmes. These main steps are: 1) Road safety visions and targets; 2) Road safety plans and programmes; 3) Best practice road safety measures; 4) Organisational roles and co-ordination of activities; and 5) Monitoring and evaluation of the effects of road safety measures. The report also refers to a number of tools available to support RSM. The WHO report [7] on road traffic injury prevention concludes with six principal recommendations for national road safety work: 1) Identify a lead agency to guide the national road safety effort; 2) Assess the problem, policies and institutional settings relating to road traffic injury and the capacity for road traffic injury prevention in the country; 3) Prepare a national road safety strategy and plan of action; 4) Allocate financial and human resources to address the problem; 5) Implement specific actions to prevent road crashes, minimize their consequences and evaluate the impact of these actions; 6) Support the development of national capacity and international co-operation.
An ETSC report [8] presents a methodological approach to the effective development and implementation of national road safety policies in EU member countries. A checklist is put forward in order to help decision makers and practitioners at a national level by enabling them to assess the current road safety situation and detect potential deficiencies. The checklist considers 22 items, such as Political support and commitment; Public and private sector awareness and involvement; Road safety legislation; Traffic safety vision or philosophy; Strategy; Performance targets; Public health approach; Systemic perspective; Road safety action plan; Scientific choice of measures; Institutional roles and responsibilities; Allocation of responsibility for countermeasures; Funding; monitoring and evaluation; Accident data; Safety performance indicators and exposure data; Research; Best practice exchange; Training; Enforcement; Emergency response; Holistic approach. The report also stresses that the application of the ideas presented there requires taking the specific country’s features into account, but best practice visions and strategies adopted elsewhere could be adapted to the specific cultural, social and institutional features of each country in question. The report also states that “no matter how technically well-founded it may be, no action can really be implemented without political will and commitment” (p.8).
The SUPREME handbook [9] presents a large variety of best practice road safety measures in the EU member states as well as in Switzerland and Norway. RSM-relevant topics covered in the report are: 1) Institutional organisation of road safety and specifically road safety visions; 2) Road safety programmes and targets; 3) Efficiency analysis; 4) Resource allocation processes.
An OECD report [10] gives a review of short-term and long-term measures to significantly improve road safety in OECD countries. It ensures that major road safety gains are possible through 8 enabling points, such as: 1) Improved data collection; 2) Setting robust interim targets; 3) Ambitious long term vision; 4) Adopting a Safe System approach; 5) Improving key institutional management functions; 6) Supporting research and development through knowledge transfer; 7) Establishing adequate funding for effective safety programmes; 8) Meeting management challenges, especially building political support. The report recommends the “Safe System” approach to be adopted by all developed countries. This approach addresses all elements of the road transport system in an integrated way so as to ensure that road users are never subject to impact energy levels that can cause fatal or serious injury. It focuses on interventions to reduce crash risk and mitigate severity by managing the interfaces between the road user, the traffic infrastructure and the vehicle. It relies on adequate institutional management capacity to prioritise road safety, and requires shared responsibility and accountability between system designers and road users. Examples of the safe system approach are the “Sustainable Safety” vision in the Netherlands and “Vision Zero” in Sweden.
In its Global Status Report [11] the WHO recommends that national governments ensure that: 1) The responsible institutions for road safety actions have the necessary human and financial resources to act effectively; 2) They develop and endorse a national strategy with realistic targets and earmarked funding for implementation; 3) They promote multi-sectoral collaboration in road safety work; 4) They promote collaboration between the different sectors involved in collecting data on road traffic injuries.
Bliss & Breen [1] in their Guidelines for RSM state that it is a country’s safety management capacity that sets the limits to improvements in road safety. They also state that an RSM system at the country level should address three inter-related elements: “institutional management functions, interventions and results, with prime importance being placed on institutional management functions, and more specifically the role of the lead agency” (p.xvi). Also, Bliss & Breen [1] promote the Safe System approach, and put forward seven institutional management functions providing the foundation for an effective national RSM system: 1) Results focus – a strategic orientation that links all actual and potential interventions with results; 2) Coordination; 3) Legislation; 4) Funding and resource allocation; 5) Promotion; 6) Monitoring and evaluation; 7) Research, development and knowledge transfer.
The SafetyNet [12] report, after reviewing the literature, presents detailed recommendations on the most relevant issues in RSM. Many of those are based on the recommendations from two previous reports, i.e. [1, 10]. The report is a useful “manual”, compiling the recommendations from earlier reports, and it adopts the view of Bliss and Breen [1] on the RSM system having three levels, i.e. 1) Institutional management functions which produce 2) Interventions, which in turn produce 3) Results. The institutional management functions comprise: 1) Results focus, which is the overarching function; 2) Coordination; 3) Legislation; 4) Funding and resource allocation; 5) Promotion; 6) Monitoring and evaluation; 7) Research, development and knowledge transfer. The important role of the lead agency is emphasized. Interventions consist of planning, design and operation of the road network for vehicles and road users, as well as the recovery and rehabilitation of crash victims. Results are expressed as quantitative long term goals and interim targets. The report describes these issues in detail and gives “good practice” examples for them.
Johnston [13], exploring research on RSM, put forward the four well-known “Cs” as keys to best practice: 1) Constituency – unless the public demands action, appropriate resources will not be applied; 2) Commitment – without political will from the top, success will be limited; 3) Cooperation – RSM demands actions from a large number of stake holders; 4) “Coordination is vital to integration and synergy across institutional efforts” (p.1180).
The Global Status Report on Road Safety [14] points out a number of areas that need to be addressed by governments. The recommendations outlined include: 1) Officially endorsed targets and indicators; 2) Improving the quality of data on fatalities, injuries and interim indicators; 3) Coordination of efforts by a well-resourced lead agency; 4) A multi-sectoral national strategy that includes specific targets; 5) Monitoring and evaluation of outputs and outcomes.
Muhlrad [15] describes 6 components of road safety policies which are the outcome of policy formulation and policy adoption which will govern implementation: 1) A long-term vision - preferably to be decided by the parliament so that it becomes law; 2) A medium-term strategy which creates the framework in which successive road safety intervention programmes will be designed and implemented; 3) Short-to-medium term (four to five year) quantitative targets of injury reduction to be used for calibrating further efforts; 4) A road safety programme coordinating all interventions planned to meet the targets; 5) A funding mechanism ensuring annual financing of the action programme and support activities; 6) Setting up implementation conditions to ensure that human, technical and financial resources are available when needed.
The Road Safety Manual issued by PIARC [16] builds on best-practice experience and gives hands-on recommendations for RSM, where chapters of relevance are: 1) The road safety management system focusing on results and the importance of governmental and top management leadership and management capacity; 2) The Safe System approach; 3) Effective management and use of safety data; 4) Road safety targets, investment strategies, plans and projects; 5) Roles, responsibilities, policy development and programmes; 6) Intervention selection and prioritisation; 7) Monitoring and evaluation of road safety interventions.
2.2. Research Findings on Road Safety Management Components
A number of studies analysed the impact of RSM components on road safety performance at the national level.
Wegman et al. [17] analysed the road safety situation of nine European countries representing three different regions with their different stages in road safety development and – based on their findings – put forward recommendations concerning the individual countries’ RSM systems. Some of the countries clearly missed some of the relevant functions for a functional RSM system, such as 1) Define clearly which of the ministries has the main responsibility for road safety; 2) Consider the establishment of a central road safety agency with proper funding to coordinate/manage road safety activities; 3) Set quantified road safety targets; 4) Increase the resources for road safety improvement; 5) Encourage stakeholders to be involved in road safety management processes; 6) Establish an independent national road safety observatory for monitoring progress; 7) Collect data on road safety performance indicators and on risk exposure in terms of kilometres travelled; 8) Improve the procedures and data bases.
Muhlrad [18] – based on an overview of experience gathered in European, OECD and some low-and middle income countries on RSM practices – presented a diagnosis methodology, including a comprehensive checklist for data collection, for comparing road safety practices and needs in different countries. The book by Muhlrad [18] may serve as an introduction to RSM.
Elvik et al. [19] made an attempt to summarise and present information about the effects of RSM-relevant organisational measures and of quantified road safety targets and road safety programmes. Organisational measures included: 1) Empowering public agencies to introduce road safety measures, 2) Incentive systems for allocation of resources in the public sector, 3) Formalising responsibility for introducing road safety measures, 4) Defining the extent of legal responsibility for the design and maintenance of public roads. The authors arrived at the conclusion that “it is extremely difficult to judge the costs and benefits of organisational measures” (p.1017). It was also found difficult to assess the effects of quantified road safety targets and road safety programmes, partly because relatively few countries had adopted quantified road safety targets, but also because no effective safety programmes had been implemented, so the targets mostly had a symbolic function.
An ETSC report [20] overviewing European countries’ road safety performance, concluded that, for achieving long term effects, road safety policy should be reinforced with an effective institutional management.
Elvik [21] surveyed the use of 10 formal tools for RSM in 18 European countries by means of a questionnaire sent to national highway agencies, and made an attempt to determine whether a relationship existed between use of the tools and safety performance. These tools were: Accident modelling, “Black-spot” identification and analysis, In-depth accident studies, Monitoring of road user behaviour, Network screening, Road safety impact assessment, Road safety audit, Road safety inspection, Road protection scoring, Traffic conflict studies and Naturalistic driving studies. Use of the management tools was found to vary. Elvik could not find clear support for the hypothesis that “the more extensive use a country made of the safety management tools, the better would be its safety performance” (p.1). However, Elvik recognised that the study had considerable limitations, mainly due to a small sample, and recommended that “the analyses should not be interpreted as supporting less use of safety management tools” and expected that a study with “a larger sample of countries could produce more meaningful findings” (p.6).
Papadimitriou & Yannis [6] argued that RSM could be described on the basis of three composite indicators, i.e. 1) Vision and strategy; 2) Budget, evaluation and reporting; and 3) Measurement of road user attitudes and behaviours. They analysed the relationship between RSM and road safety performance at country level for 30 European countries based on the theoretical framework of the “SUNflower” pyramid, which describes RSM systems in terms of a five-level hierarchy: 1) Structure and culture; 2) Programmes and measures; 3) Intermediate outcomes; i.e. Safety Performance Indicators (SPIs); 4) Final outcomes, i.e. fatalities and injuries; and 5) Social costs. For each of the five levels of the hierarchy, a composite indicator was implemented. The results suggested that RSM indicators did not directly affect fatality outcomes. However, the existence of a dedicated budget for road safety, the systematic evaluation of the results of road safety programs and the regular measurement of road user attitudes and behaviour were positively associated with the operational level of road safety (SPIs) of a country. Surprisingly, the composite indicator: “Existence of a road safety vision and strategy”, was associated with a lower score on SPIs. As the authors commented, it may take several years for a road safety vision to show effects and the existence of a vision and strategy does not necessarily implies that effective measures are implemented at all (see e.g. the first period of the Swedish Vision Zero, discussed below in Chapter 3). On the other hand, some of the best performing countries (e.g. UK, Netherlands, and France) were found not to have high scores on vision and strategy.
The DaCoTA EU-project [22] defined Policy-making as a cyclical series of tasks of 1) Agenda setting with recognition and definition of a significant public problem; 2) Policy formulation with selection of objectives to reduce the problem; 3) Policy adoption including appropriation by the stakeholders involved (agreement at the higher levels of decision making and consultations to ensure that the citizens accept and support the policy); 4) Policy implementation, i.e. putting into use all the interventions planned in the policy; 5) Policy evaluation, i.e. monitoring to check if is working according to plan and is likely to reach the objectives.
The DaCoTA project investigated the RSM framework in European countries to help promote “good practice” [23]. A RSM investigation model proposed by Muhlrad et al. [22] was used. The relationship between road safety management and road safety performance was analysed based on five “good practice” elements of management on the national level, such as 1) Institutional organisation, coordination and stakeholders’ involvement; 2) Policy formulation and adoption; 3) Policy implementation and funding; 4) Monitoring and evaluation; 5) Scientific support and information and capacity building. It was concluded that it was not possible to identify a single “good practice” element and that “the establishment of a structure and process alone was not sufficient for effective road safety management” [24, p.5]. However, “road safety management systems based on strong departments of ministries, or using government agencies specifically established for this purpose, with a clear responsibility for the government’s road safety policy, are more effective” (p.5). The majority of the countries studied had adopted some kind of road safety vision, such as “Safe Systems”, “Sustainable Safety” or “Vision Zero”. Systematic consultations with regional authorities, NGOs, stakeholders and the public were found to largely affect the effectiveness of road safety management [24]. Elements that emerged as the most problematic “good practice” criteria were implementation, funding and monitoring of performance. Critical issues to keep the processes going were coordination and budget. Monitoring and evaluation mostly consisted of collecting information when a programme ended. National road safety observatories exist in most of the countries studied; however, there is great variation in their type, role and operation. Also, lack of information on implementation costs of countermeasures and lack of knowledge about appropriate methods to calculate these costs were pointed out. As Muhlrad et al. [24] formulated it, “Capacity building and training of road safety actors is seldom a systematic procedure with a dedicated budget” (p.7). It can be discussed if these five “good practice” elements are covering all and the only relevant issues in road safety management, as the outcome of the analyses showed that countries ranked as best in road safety management were not always the countries with the best road safety performance [24]. However, even if no direct relationship between RSM and the final accident outcome could be found, “road safety management was found to be associated with safety performance indicators (SPIs), reflecting the operational level of road safety in each country” [24, p. 5], which advocates the usefulness of SPIs as intermediate safety measures.
A subsequent analysis [25] concluded that it was impossible to identify single best working RSM structures at the national level; the individual countries could be compared when the RSM areas were considered separately. The countries were ranked into a number of groups, where the availability of individual RSM components reflected the level of RSM in the country in terms of its correspondence to the “good practice” criteria. A positive correlation between the higher level of the RSM system and better safety performance of the countries was found. Among the countries with a high availability level of individual RSM components, the presence of the “good practice” features, such as 1) A strong lead agency; 2) A national medium-term road safety programme; 3) Quantitative targets; 4) NGOs or government agencies actively advocating for taking road safety action were common. Weak points of the RSM systems were found in 1) Most policy implementation and funding components, such as the lack of a dedicated budget and insufficiency of human resources; 2) Poor distribution and coordination of responsibilities between various management levels; 3) Unavailability of sustainable and results-focused structures which would enable effective implementation, funding, monitoring and evaluation of the road safety activities.
Alfonsi et al. [26], based on the findings of the DaCoTA project, i.e. that “the weakest components of RSM systems in Europe are policy implementation and funding and the lack of knowledge-based road safety policy making” (p.2064), carried out a study on the relationship between funding and research models on the one hand and performance in RSM on the other. Their preliminary results show a positive correlation between funding and research models and performance in RSM. Countries were ranked on the basis of a composite index of three indicators (Number of published papers per population, citations per paper and EC-funded road safety projects joined per population), where the highest rank was achieved by Sweden and Norway (countries with the lowest fatality rates per population).
Loo et al. [27] put forward a nine-component analytical framework for developing, comparing, and evaluating road safety strategies. The nine components are: 1) vision; 2) objectives; 3) targets; 4) action plan; 5) evaluation and monitoring; 6) research and development; 7) quantitative modelling; 8) institutional framework; 9) funding. The framework was used for benchmarking road safety strategies in six selected countries. Some countries were found to be best according to some of the components and some other countries were found to be best in some other components.
Elvik [28] estimated that the implementation of a hypothetical complete Vision Zero program in Norway could reduce the number of traffic fatalities from about 300 per year to about 90 per year. He applied the statistical value of income loss from an additional death and found that “implementing the entire hypothetical Vision Zero programme would increase general mortality by about 1355” (p. 279), showing that efforts to eliminate a certain cause of death, in this case traffic accidents, may be so expensive that they may erode the available resources to eliminate other causes of death, which may lead to the increase in general mortality. Elvik concludes that “the possibility cannot be ruled out that a massive effort to eliminate traffic deaths would be counterproductive in terms of overall mortality” (p. 279). These findings generate a moral dilemma for the Vision Zero approach, asking whether injury prevention efforts can go too far.
Koornstra et al. [29] examined the underlying elements in the policies and programmes of three European countries with the lowest accident levels, i.e. Sweden, United Kingdom, and the Netherlands (labelled as the SUN countries). The main conclusions from the study were that safety activities were organised in a similar way in the three countries, with “each having a willingness to debate safety issues in Parliament, a strong central co-ordinating ministry, good vertical co-ordination of safety activities from central to local groups, with supporting finance, and influential non-governmental/non-profit organisations with a strong interest in safety” (p. 25). Also, road safety policies were based on quantified targets for the reduction of fatalities and serious injuries.
Elvik [30] analysed priority setting in RSM and found that strict and consistent cost-effective road safety policies could reduce the number of road fatalities by between 50 and 60% in both Norway and Sweden during a 10-years period (2002-2011) compared to current policies, which were assumed to prevent only about 10 to 15% of the fatalities during the same period. Elvik [30] also identified a number of sources of inefficiency in road safety policy, such as: 1) lack of power, i.e. when a national government does not have the formal authority to introduce a certain road safety measure (the case of EU-countries); 2) social dilemmas (e.g. cost-effective measures from a societal point of view are not cost-effective from the point of view of individual road users; 3) priority given to other policy objectives, e.g. regional development.
Elvik [31], comparing the safety performance of Norwegian counties having quantified road safety targets with counties with only qualitative targets, found that “setting ambitious quantified road safety targets can help policy making by making it easier to implement effective countermeasures and set priorities effectively” (p.569). The OECD [32] report concludes that the existence of targets and targeted road safety programmes increases the prospect that safety policies will be implemented, and that they can lead to better integration of institutional efforts and can produce a more focused allocation of resources.
Wong et al. [33] evaluated the effectiveness of quantified road safety targets in 14 countries during the period 1981-1999. The findings showed that the majority of countries with quantified road safety targets experienced a reduction in road fatalities in the period studied. They concluded that “the setting of quantified road safety targets helps to raise concern about road safety in societies, encourages decision-makers to formulate effective road safety strategies, and ensures that sufficient resources are allocated to road safety programs” (p. 1004).
Wong & Sze [34] assessed the effectiveness of the quantified road safety targets set by a number of OECD countries over the long term. The results indicated that “target setting in seven OECD countries was associated with a substantial positive effect on the time-series trend in road fatalities during the period in which the targets were in effect” (p.1187), which implies an increase in road safety improvement over time.
Elvik [35] analysed the Norwegian “management by objectives” system, and concluded that, while the system had a number of good features, it also had weak points. The system looked exemplary: the accident targets were clear and ambitious and the targets for road safety indicators covered all important road safety problems. However, some of the targets for road safety indicators referred to outcomes that could not be influenced by the Norwegian government, and there was a lack of support among politicians for quantified road safety targets.
Hakkert et al. [36] elaborated on the theory behind the development of Road Safety Performance Indicators (SPIs) and put forward SPIs in seven major areas, such as Alcohol and drug-use; Speeds; Protection systems; Daytime running lights; Vehicles; Roads; and Trauma management. These areas were considered as central to achieving significant improvements in road safety in the EU countries.
Wegman et al. [37] developed a comprehensive set of indicators – a Composite Road Safety Performance Index - to measure the road safety performance of a country. The index comprises three types of indicators: 1) Road safety performance indicators, including a) final outcomes (numbers of killed and injured), b) intermediate outcomes (SPIs) and c) social costs; 2) Policy performance indicator, consisting of the two components a) the quality of conditions (strategies, programs, resources, coordination, institutional settings, etc.) and b) the quality of action plans and individual countermeasures; 3) Implementation performance indicators. Wegman et al. [38] concluded that the composite index was realistic and meaningful as it gave a more enriched picture of road safety than a ranking based only on data on fatality rates. However, it was recommended that improvements in the index should be made by developing indicators for the implementation performance and improved procedures for availability of high quality national data.
Holló et al. [38], examining the explanatory value of SPIs, concluded that these cannot provide a full understanding of road safety trends, since – besides the established and often used SPIs – there are a number of other explanatory variables (e.g. demography, technological development, etc.) for the safety outcome at the national level. Hence, they proposed that the various aspects of the complex socio- technical road safety system, organisational and structural factors should be included in the analysis of the road safety situation.
Gitelman et al. [39] developing a composite road safety indicator for benchmarking countries’ road safety performance considered four groups of basic safety indicators referring to: 1) Policy performance (road safety programs); 2) Final road safety outcomes (fatality and injury rates); 3) Intermediate outcomes (rates of wearing seat belts, crashworthiness of vehicles, etc.); 4) Background characteristics of countries (motorization level, population density). The basic safety indicators with a clear contribution to the final composite safety indicator were: 1) Fatality rates; 2) Quality of national safety programmes; 3) Rates of wearing safety belts; and 4) Median age of cars. These were concluded being a core set of basic indicators for assessing the safety performance of a country. It was found that ranking of countries based on the composite indicators was not necessarily similar to the ranking based on fatality rates only. The general conclusion was that the use of a composite road safety indicator provides a more nuanced picture of a country’s road safety situation than a ranking based only on fatality rates.
Bax et al. [40] elaborated a composite Road Safety Index (RSI) on the country level consisting of performances on three levels of the target hierarchy for road safety, i.e. 1) final outcomes (injuries and crashes); 2) intermediate outcomes (SPIs) and 3) policy output (safety measures and programs). The method was found useful for comparing a country with the ‘best of class’, “making it clear which layer-index has to be improved in order to reach the performance level of the best performing countries” (p.146). It was pointed out that SPIs should be revised periodically and be complemented with new, risk factors not recognised today that are found to have a strong relationship with road crashes and their severity.
Schulze and Kossmann [41] reviewed how a scientifically based RSM system, comprising strategic elements, tools and measures was applied in Germany. They concluded that such a RSM system includes a scientific research programme targeting the safety issues raised in the political road safety programme and – based on research results – the development and implementation of adequate road safety measures. The efficiency of the measures applied should be scientifically monitored. Schulze and Kossmann [41] concluded that, in order to ensure the efficiency of the proposed safety measures, they should be derived from research evidence. Also, research is needed to regularly monitor the impact of road safety management tools.
Elvik et al. [42], estimating the benefits to society of road safety research funded by some of the Swedish research boards during the period 1971-2004, concluded that, even if the study had several limitations, the various road safety measures originating from research efforts had very probably contributed to a major part of the reduction in road accident fatalities in Sweden. Hence, “the benefits of applied road safety research are likely to be greater than the costs of conducting this research and implementing road safety measures developed by research” (p.387).
Summing up the findings in the literature reviewed, it can be concluded that a number of important issues are pointed out by the different guidelines and recommendations. Even if these recommendations do not always overlap, and the individual documents do not cover all the aspects of importance, see Table 1, they together form a good base for a complete set of recommendations.
| Issue | Publication | ||||||||||||||||||||
|---|---|---|---|---|---|---|---|---|---|---|---|---|---|---|---|---|---|---|---|---|---|
| OECD 2002 [5] |
Koornstra et al. 2002 [29] |
WHO 2004 [7] |
Wegman et al. 2005 [17] |
Loo et al. 2005 [27] |
ETSC 2006 [8] |
SUPREME 2007 [9] |
OECD 2008 [10] |
Elvik 2008 [35] |
WHO 2009 [11] |
Bliss & Breen 2009 [1] |
SafetyNet 2009 [12] |
Johnston 2010 [13] |
Muhlrad et al. 2011 [22] |
Jost et al. 2012 [20] |
WHO 2013 [14] |
Muhlrad 2014 [24] |
Muhlrad 2015 [15] |
PIARC 2016 [16] |
Gitelman and Doveh 2016 [25] |
Alfonsi et al. 2016 [26] |
|
| Political commitment | √ | √ | √ | √ | √ | ||||||||||||||||
| Agenda setting | √ | ||||||||||||||||||||
| Road safety vision | √ | √ | √ | √ | √ | √ | √ | √ | |||||||||||||
| Policy formulation | √ | ||||||||||||||||||||
| Best practice | √ | √ | |||||||||||||||||||
| Problem assessment | √ | ||||||||||||||||||||
| Public health approach | √ | ||||||||||||||||||||
| Systemic perspective | √ | ||||||||||||||||||||
| Holistic approach | √ | ||||||||||||||||||||
| Safe System approach | √ | √ | |||||||||||||||||||
| Results focus | √ | √ | √ | √ | |||||||||||||||||
| Objectives | √ | √ | |||||||||||||||||||
| Quantified targets | √ | √ | √ | √ | √ | √ | √ | √ | √ | √ | √ | √ | |||||||||
| Strategy/Programme/Action plan | √ | √ | √ | √ | √ | √ | √ | √ | √ | √ | √ | √ | |||||||||
| Legislation | √ | √ | √ | ||||||||||||||||||
| Promotion | √ | √ | √ | ||||||||||||||||||
| Organisational roles | √ | √ | √ | √ | √ | √ | √ | √ | √ | √ | √ | √ | √ | ||||||||
| Lead agency | √ | √ | √ | √ | √ | √ | |||||||||||||||
| Allocation of responsibility | √ | ||||||||||||||||||||
| Co-ordination | √ | √ | √ | √ | √ | √ | |||||||||||||||
| Co-operation | √ | √ | √ | √ | |||||||||||||||||
| Stake holder involvement | √ | √ | √ | ||||||||||||||||||
| Interventions | √ | √ | √ | ||||||||||||||||||
| Scientific choice of measures | √ | ||||||||||||||||||||
| Constituency | √ | ||||||||||||||||||||
| Funding/Dedicated budget | √ | √ | √ | √ | √ | √ | √ | √ | √ | √ | √ | √ | √ | √ | |||||||
| Monitoring and evaluation | √ | √ | √ | √ | √ | √ | √ | √ | √ | √ | √ | ||||||||||
| Road safety observatory | √ | ||||||||||||||||||||
| Data bases (accident, exposure) | √ | √ | √ | √ | √ | √ | |||||||||||||||
| Safety Performance Indicators | √ | √ | √ | √ | |||||||||||||||||
| Efficiency analysis | √ | ||||||||||||||||||||
| Research and development | √ | √ | √ | √ | √ | √ | |||||||||||||||
| Capacity building | √ | √ | √ | √ | √ | √ | √ | √ | √ | ||||||||||||
The recommendations are clear and straightforward and have been found to be working well in a few countries – where there has been a will to implement them! There is no doubt that following the steps of a systematic approach in RSM will lead to significant road safety improvements. The guidelines and recommendations for RSM may be exemplary; however, without political will and commitment they cannot be implemented successfully. As the OECD report [10] on ambitious road safety targets emphasises, “strong political commitment to a results focused approach to road safety management has a critical role in determining the achievement of a country’s road safety ambition and related targets” (p.17). Unfortunately, there is a huge barrier already at the very first steps of the systematic approach, and that is to get decisions makers to realise the burden of road casualties on the national socio-economy and gain their commitment to road safety work.
3. THE SYSTEMATIC APPROACH IN ROAD SAFETY MANAGEMENT
To achieve significant improvements in road safety at the national level, there is a need for a systematic approach with clear responsibilities and accountability. The essential elements of such a systematic work are as follows:
- Define the burden and nature of road casualties
- Gain commitment and support from decision makers
- Establish Road Safety Policy
- Define institutional roles and responsibilities
- Identify road safety problems
- Set Road Safety Targets
- Formulate Strategy, Action plan
- Allocate responsibility for measures
- Ensure funding
- Apply measures with known effectiveness
- Monitor performance
- Stimulate research and capacity building
3.1. Define the Burden and Nature of Road Casualties
The first step is to define the burden of road casualties in the country. Part of defining the burden is the monetary valuation of the prevention of a fatality/injury accident. Such “values of statistical life” have been derived in a number of countries (see Fig. 1). However, there is a large variation among these. Interestingly, a negative correlation seems to exist between the monetary valuation of a statistical life and the road safety situation of a country, namely, countries with low “values of statistical life” have poor road safety situation and vice versa (see Figs. 1 and 2).

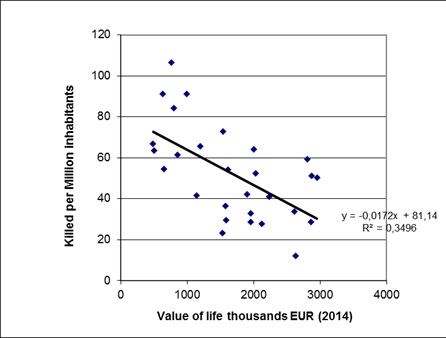
Monetary values of statistical life are also necessary in socio-economic assessments of infrastructure investments. The expected changes in accident costs (direct costs for damage, medical treatment, administration, loss of productive capacity, loss of welfare) are to be compared to other cost items (such as travel time savings/losses, environmental costs, etc.) that can be monetised. So, monetary values of statistical life are a necessary base for informed decisions on infrastructure investments. Still, these values are missing in many countries.
3.2. Gain Commitment and Support from Decision Makers
There is accumulated knowledge among road safety scientists on which strategies and measures are the most efficient, but without commitment from the decision makers, these will not be realized. Elvik [35], after analysing the Norwegian “management by objectives” system, concluded that RSM by objectives is an attractive idea, but successful road safety management by objectives requires a firm commitment from the top management. “In the absence of this support, the system becomes nothing more than a paper tiger” [35, p.1122]. The ETSC report [8] concluded that “no action can really be implemented without political will and commitment” (p.8). Also, the SUPREME handbook [9] states that: “If there is commitment and funding, a road safety vision directs road safety actions and forms the basis of road safety plans and programmes” (p.9).
Nevertheless, “where there’s a will there’s a way”; a good example to illustrate this is the case of France, having a poor safety performance among European countries until the President of the country “suddenly” became “… absolutely horrified that French roads are the most dangerous in Europe…” [45], and ordered tough road safety measures (automatic speed cameras programme, graduated driving licence system) resulting in unpreceded improvements in France’s road safety situation [46]. However, this effort still was not part of a systematic RSM project.
3.3. Establish Road Safety Policy
With the commitment of decision makers, a Road Safety Policy or Vision can be established. An example of such a policy is the Vision Zero in Sweden, whose parliament passed the Road Traffic Safety Bill in 1997, stating that “No one will be killed or seriously injured within the road transport system” [47]. It is important to emphasise that it was the parliament who made this decision on the vision, not the government, thereby not giving the succeeding government an opportunity to discard or change the road safety policy. Another example is the “Sustainable safety” policy in the Netherlands which states that “The transport system shall be adjusted to the limitations and possibilities of road users” [48]. The Safe System approach to be adopted, which means a results focused evidence based approach, building upon well-documented scientifically supported best practices. Such policies constitute a good base to mandate the responsible body for road safety on the national level to develop a road safety strategy.
3.4. Define Institutional Roles and Responsibilities
A crucial issue here is the existence of such a responsible body for road safety on the national level. This body could be a National Road Safety Committee/Commission, which should comprise the relevant departments (Transport, Police, Justice, Health, Planning, Education, Industry), and most importantly be chaired by a committed person respected by all parties. The solution for a responsible body for national road safety can be different in different countries depending on the way that state administration is organised. In Sweden, for example, where departments are small and government agencies have considerable power delegated to them, the responsible body for supervising road safety work is the Swedish Transport Agency with overall responsibility for producing regulations and ensuring compliance encompassing all modes of transport, i.e. roads, railways, aviation and shipping. Under the supervision of the Swedish Transport Agency it is the Transport Administration who is the responsible body for coordinating road safety work.
Institutional roles and responsibilities for important functions of road safety management to be defined, i.e. who should be the responsible for the accident data register, road maintenance, vehicle inspection, vehicle register, driver training, driver testing, driving-license register, enforcement of traffic rules, emergency assistance, traffic safety analyses, research and documentation services, training of professionals.
3.5. Identify Road Safety Problems
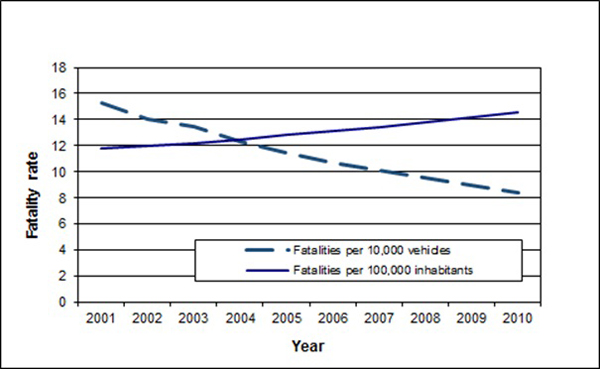
As a basis for road safety actions and countermeasures, the road safety problems of the country should be identified in a systematic way. When presenting the road safety situation for a country or region, often used risk values build on the number of casualties related to some exposure measure. Some of these exposure measures (number of motor vehicles or motor vehicle kilometres) give a misleading picture of the situation as they neglect the existence of pedestrians and bicyclists, who in many countries carry the casualty burden of motorised traffic. Relating the number of casualties to the number of motor vehicles or motor vehicle kilometres may be misused to show a positive year-by-year development in the country with an increase of motorisation, showing a decreasing rate of casualties related to the number of motorised vehicles, and neglecting the fact that it is the motorised vehicles which harm the vulnerable road users, whose presence in traffic is not included in this kind of exposure measure, see Fig. (3).
To illustrate the problem of using exposure measures based on the number of motor vehicles or motor vehicle kilometres, we can look at international comparative statistics on road accident fatalities, see [46]. When looking at road accident fatalities per billion vehicle kilometres, e.g. the USA is among countries with middle level road safety, but when we look at road accident fatalities related to the population of the country, the USA ends up among countries with the worst road safety record.
So, what exposure measure is to be used for risk assessment, where the risk is defined as “the number of persons killed related to some kind of exposure”? Among the often-used exposure measures, the “number of motor-vehicles” and “number of kilometres driven” are not good ones, as they relate the number of “victims” to the number of prevalence of “perpetrators”. To have a fair assessment of risk, the prevalence of all types of road users should be considered; hence, we need the measure “person-kilometres” per year of all types of road users (pedestrians, cyclists, passengers of public transport and users of individual motorized vehicles).
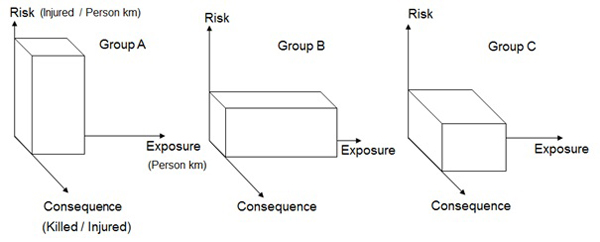
Access to exposure data for all types of road users allows us to perform the so called three-dimensional analysis of road safety problems. The dimensions “exposure” (person-kilometres per year), “risk” (number of injury accidents per person-kilometres per year) and “consequence” (number of killed per number of injury accidents per year), see Fig. (4), help us to get a good picture of the character of the road safety problems. Multiplying the units of the three axes (km*injured/km*killed/injured) gives the number of killed in road accidents in the country. This number itself does not reveal much of the road safety problems behind it. To illustrate the usefulness of the three-dimensional analysis, let’s take the examples in Fig. (4), where all three bodies (A, B, C) have the same volume, i.e. the number of fatalities are the same. Let us assume that the three groups A, B, C are different types of road user (but could also be different cities or regions). We can see that the major problem of group A is that it generates relatively many accidents, even if it does not have as much kilometrage per year as group B. Group B, on the other hand, has a large amount of yearly kilometrage, but it does not generate as many accidents per kilometre as group A, still the total number of fatalities is the same for both groups. Group C has smaller yearly kilometrage than group B, and it does not generate as many accidents per kilometre as group A, but when an accident occurs, the outcome is more severe than for those in the other two groups. Road safety countermeasures should be adapted to the specific problem of each group. To mitigate the problem of group A, countermeasures should be directed to reducing the risk of being involved in an accident (speed regulation, enforcement of compliance with regulations). To mitigate the problem of group B, countermeasures should be directed to reducing the exposure of this group (redirecting travel to modes of transport generating fewer accidents). To mitigate the problem of group C, countermeasures should be aimed at mitigating the consequences of an accident (protective devices). Examples of countermeasures acting on these three dimensions of road safety and directed to the infrastructure, the vehicle and the road are presented in Table 2.
| Countermeasures act on | Countermeasures directed to | ||
|---|---|---|---|
| Infrastructure | Vehicle | Road user | |
| Exposure | Improved public transportation | Increasing the cost of vehicle usage | Graduated driving licence |
| Risk (Probability of accidents) |
Speed bumps | Speed limiter in cars | Induce road users to comply with traffic regulations |
| Consequence of accidents |
Guard rails, crash cushions | Crash protection in the vehicle | Induce road users to use the seat belts |
However, even if this kind of approach provides a good tool for knowledge-based road safety work, several problems exist in only using accidents to analyse the road safety situation; the most obvious of them is that many accidents are never reported. The less the severity of the injury, the lower the reporting grade [19]. A study comparing police-registered injury accidents and traffic injuries registered at the regional hospital in Lund, Sweden, showed, that while the police register contained over 85% of injured car occupants, it only contained around 55% of injured cyclists and only around 22% of injured pedestrians [50]. The conclusion from this is that we have to combine the police register with the hospital register on traffic injuries. This is the case today in Sweden, where the STRADA database on traffic injuries combines the injury accident data of these two registers. Still, the coverage of the combined data base is far from satisfactory; Berntman & Modén [51] mapping the Police Records, Hospital Records and Hospital Discharge Register in the region of Skåne (southern Sweden) in 2004 found that Police Records and Hospital Records combined only contained 70% of the severely injured.
To analyse the traffic safety situation, we should also use non-accident-based Safety Performance Indicators (SPIs). SPIs are any measurements that are statistically related to accidents or injuries and are used in addition to accident or injury statistics in order to indicate safety performance or understand the process that leads to accidents. They also provide the link between the contributory factors to road accidents and the measures to affect them. SPIs are often referred to as “intermediate outcomes” since they fill the knowledge gap on causal relationships between interventions and accident outcomes. SPIs can give a more complete picture of the road safety situation, and hence are useful in developing countermeasures, even before the problems indicated by them result in accidents or injuries. They can be quantitatively measured and they allow comparisons between countries concerning the safety situation as well as comparisons before and after certain actions are taken. SPIs can be developed within each field of activity of the road traffic system which can be directly related to safety. SPIs can help us to monitor how the road safety situation is developing and allow us to make interventions at an early stage if they show an undesirable development [24, 36, 52, 53].
Besides the well-established SPIs, the Composite Road Safety Performance Index, proposed by Wegman et al. [37] and further elaborated on by Holló et al. [38], Gitelman et al. [39] and Bax et al. [40] can be employed. However, its use needs some further development work. SPIs should be revised periodically and be complemented when new risk factors are revealed that have a strong relationship with road crashes and their severity [40].
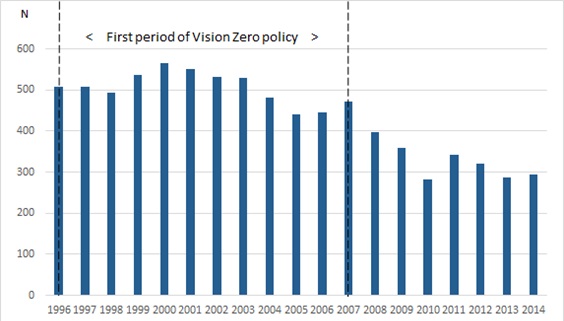
A very good indication of the usefulness of (or the problem of not having) SPIs in Road Safety Management is the outcome of the Swedish Vision Zero policy during its first period. The long-term vision was “zero killed in 2020”. According to the vision, the number of killed should decrease by 50% from the year 1996 to year 2007, see Fig. (5). As seen in the figure, road safety development in Sweden during the first period of Vision Zero policy – but with no quantified sub-targets – was not successful. The vision was innovative, but there were no measurable safety indicators of the development and no regular follow-ups. Consequently, this first period of Vision Zero policy failed. A road safety vision without quantified targets will not be effective.
3.6. Set Road Safety Targets
To be able to set Road Safety Targets of relevance, the most salient road safety issues should be identified. Typical problems based on experience from countries where the road safety situation has been analysed, ranked according to the size of their contribution to fatalities and injuries, are: speeding, poor vehicle crashworthiness, high risk of unprotected road users, drinking and driving, insufficient medical and rescue services for accident victims and roadside obstacles [19]. In Sweden, e.g., the following major road safety problems were identified [55]: 1) Speeding: Over 50% of drivers exceed the speed limits; 2) Drinking and driving: 25% of motor vehicle occupants killed died in alcohol-related crashes; 3) Non-use of protective devices: 50 to 60% of killed car drivers were not wearing a safety belt in the collision; 4) Vulnerability of bicyclists: 21% of severely injured traffic victims were bicyclists; 5) Unsatisfactory crash protection in vehicles: 28% of all fatalities were from frontal collisions and 23% of all fatalities from single accidents; 6) Frontal collisions on rural roads constituted 28% of all fatalities in the country.
With knowledge of the pattern of road safety problems, Road Safety Targets can be formulated. They should be directed at the road users, the vehicles and the infrastructure in a balanced way and include complementary, non-accident based indicators of the road safety situation i.e. SPIs. The SPIs adopted should reflect the country’s road safety problem, but there should not be too many targets in view of the available policy instruments designated to realise them [35]. Following this principle for the second period of Vision Zero policy (from 2008 to 2020) in Sweden, both Accident Reduction targets and SPI targets were formulated. The SPI targets – besides the accident reduction target of a 50% decrease in the number of killed year 2020, are as follows [56]: 1) 80% of all vehicle-kilometres within the speed limit; 2) 99.9% of all vehicle-kilometres driven by sober drivers (below the 0.2 pro-mille limit); 3) 99% of car occupants use the safety belt; 4) 70% of cyclists use a helmet; 5) 99% of moped riders use the correct helmet; 6) 100% of new cars haves the highest safety class according to Euro NCAP; 7) 70% of motorcycles are equipped with ABS; 8) 75% of all vehicle-kilometres, on roads with a speed limit over 80 km/h, are on roads with a central barrier. Each of these SPIs above answers an identified road safety problem in the earlier step of analysis of the situation in the country.
The SafetyNet report [52] on quantitative road safety targets gives guidelines and good practice examples of how to set institutional output targets, intermediate outcome targets and final outcome targets, how to avoid pitfalls in target setting and how to monitor target achievement.
Setting Road Safety Targets should done in cooperation with all relevant stake holders (municipalities, the police, NGOs, vehicle providers, transport companies, road user organisations, etc.). Involving all relevant stake holders and interest organisations is very important so that they feel they are part of the process, and it makes them more committed to contribute to the achievement of the targets. The government should endorse the targets and make a firm commitment to their realisation [35]. These principles have been followed under the ongoing second period of Vision Zero policy in Sweden (from 2008 to 2020), and consequently the outcome seems to be more favourable, see Fig. (5).
3.7. Formulate Strategy, Action Plan
When the Road Safety Targets are in place, a Road Safety Strategy and Action Plan can be formulated. The action plan should [35]: 1) be balanced (actions in all key areas); 2) have challenging, yet in principle achievable targets; 3) give priority to measures with known effectiveness; 4) consider costs and expected benefits; 5) be realistic (taking account of financial constraints); 6) have a time table.
Elvik [57] carried out a broad survey of potentially effective measures, comprising 132 measures for Norway and 139 for Sweden. These measures were combined to form four different road safety strategies, ranging from no new measures to maximum implementation, i.e. the Swedish Vision Zero strategy. All the strategies except the “business as usual” strategy were assessed as resulting in significant fatality reductions.
The Road Safety Toolkit [58] - an internet-based collection of recommendations – provides free information on road safety plans. The Road Safety Toolkit is the result of collaboration between the International Road Assessment Programme (iRAP), the Global Transport Knowledge Partnership (gTKP) and the World Bank Global Road Safety Facility.
3.8. Allocate Responsibility for Measures
The responsibility for each of the indicators/actions, such as e.g. “Speed limit compliance”, “Wearing of safety belt” “Use of children’s seat”, “Share of vehicles having 5 stars on NCAP scale”, “Safe road infrastructure”, “Rescue services within X minutes of accident occurrence”, as well as monitoring of performance and outcome of all the above should be allocated to one respective responsible body. The responsible bodies should receive incentives to ensure their commitment to the targets, and they should be given the authority to decide on how best to realise the targets.
3.9. Ensure Funding
Resource allocation is critical and it must be part of the road safety programme. The responsible bodies should be supplied with sufficient funding to implement cost-effective road safety measures [35] and to achieve the maximum benefit from the funds; they should be linked to the specific goals of the programme [9]. It is also essential to follow up the effectiveness of the funded measures and thereby preventing misuse of resources [9].
To ensure funding of Road Safety Work, there are various possible sources, such as e.g. a fuel levy, insurance tax, fines for traffic offenses or a number plate fee. One example is the Belgian Road Safety Fund, where the fund receives money from fines paid for traffic offences and gives financial support to police services for road safety actions (enforcement) that focus on speeding, drink driving, seat belts, heavy goods transport, dangerous parking, and aggressive behaviour in traffic [59]. Another interesting example is the Swedish Number Plate Fund, financing road safety projects. It was established by the Swedish Road Administration (predecessor of the Transport Administration) in 1988. Money for the fund comes from fees for passenger car personalized number plates. Currently, there are about 14,000 personalized number plates in Sweden.
3.10. Apply Measures with Known Effectiveness
When it comes to countermeasures, only those with known effectiveness should be applied. There is an accumulated experience of the effectiveness of a large number of road safety countermeasures published in the Handbook of Road Safety Measures [19], as well as in the Highway Safety Manual [60], which is a useful tool for practitioners to identify the most appropriate safety countermeasures based on Crash Modification Factors supported by the Clearinghouse web-based database [61]. However, even if these countermeasures have been tested in various countries, they should also be tested in the country in question, since there may be differences in geographical settings, traffic culture, regulatory aspects, norms and other preconditions that may influence the effect of any countermeasure.
3.11. Monitor Performance
A very important issue – most often neglected after the introduction of a countermeasure – is monitoring of performance. The status of the target indicators should be monitored on a yearly basis, and feedback on their performance should be given to the responsible bodies and to the national coordinating body; if any of them does not develop in the right direction, suitable countermeasures should be taken. Systematic monitoring of performance and evaluation of the effects of the applied measures instigate the implementation of the most effective safety measures [9], but also, the need for improving the quality of data on fatalities, injuries, interim indicators and exposure data was pointed out by several sources [8, 10, 11, 14, 15, 17, 37].
A good source of complementary information on the road safety situation in the country/region is gathering public opinion. To comprehend the risk perception of the population as well as popular support for safety measures, regular surveys are recommended to be carried out. This kind of survey is a good source for following changes in public attitudes to important traffic safety issues over time. The Swedish Transport Administration, which has overall responsibility for traffic safety work, carries out surveys yearly among the population to collect information on public attitudes. An important finding from these surveys is that, in general, it takes years before any major differences in attitudes can be traced [62].
3.12. Stimulate Research and Capacity Building
A road safety research programme should be a natural part of a scientifically based RSM system [41]. Elvik et al. [42] showed that the benefits of road safety research are greater than the costs of conducting such research and implementing road safety measures based on research findings.
Hauer [63] concluded that there is an emerging trend in RSM toward decisions based on facts and science, where RSM is based on factual knowledge maintained by well-trained professionals. To get there, there is a need for the systematic training of road safety professionals in road safety knowledge as well as in research methods. For capacity building, Muhlrad [15] proposes training to enhance the skills and knowledge of road safety stakeholders as well as development of support tools.
DISCUSSION
Twelve essential elements constituting a “package” of systematic road safety work on the national level have been put forward. The question may arise: which elements are the most important to reduce road traffic injuries? It is tempting to jump to “problem solving” and assume that implementing countermeasures is the most relevant thing to do. And this is the problem of the approach taken today! There is a lack of problem analysis to build a base for adequate, effective and cost-efficient countermeasures.
One of the biggest obstacles to carrying out successful knowledge-based traffic safety work is the opinion-governed interference by decision makers. When it comes to road traffic, everybody with a driver’s licence considers himself an expert. Decision makers are not exceptions and just like other self-appointed experts are convinced that a certain solution based on their beliefs should be prioritised, and they push for it. Also, many of them refer to the often cited “scientific fact” that the human factor is assumed to play a role in about 94% of accidents (referring to [64]). Then, the obvious countermeasure seems to be to teach and train humans to behave in a safe way and not make mistakes. However, humans cannot be trained not to make mistakes; we have always made and will always make mistakes and the most efficient countermeasure is not necessarily training or education to behave safely in a system that has been built in a way, that, sooner or later, an accident will inevitably occur. A well-designed traffic environment, adapted to the “weakest” road user, inviting to an appropriate behaviour for the current situation can affect road user behaviour faster than educational activities.
Road Safety Management would benefit from decision makers keeping to their business, i.e. formulating Road Safety Policy and staying away from trying to control details in traffic safety work, leaving the responsibility for it to transport professionals. Decision makers would never intervene in a surgeon’s profession, telling them what part of the body to operate on and how to do it. They recognise that they are not experts in medicine and they respect the medical profession, which seems not to be the case with the transport profession. The Swedish model seems to work in this respect; parliament decided on the road safety philosophy (the Vision Zero); it approved the road safety goals (put forward by transport professionals) and the government commissioned the Swedish Transport Agency to supervise road safety work on the national level. This model gives a certain degree of freedom to transport professionals to analyse the situation, to test new, unproven countermeasures (e.g. central barriers on rural roads, alco-gates in ports for screening drivers arriving with ferries) and implement them on a wide scale (there are now about 1,500 automated speed cameras installed on rural roads around the country).
On the other hand, it is the task of transport professionals to shed light on the external costs transports generate, among others, in the form of fatalities and injuries. This is necessary for showing the burden of road accidents on society in order to gain decision makers’ insight and get their commitment for improving road safety. Monetary valuation of the prevention of a fatality/severe injury accident will provide a good basis for knowledge-based decisions in the socio-economic assessments of infrastructure projects.
After having been commissioned by the government to coordinate road safety work at the national level, it is up to the responsible body to develop the Road Safety Targets. The involvement of all relevant stake holders in formulating the targets is of great value (e.g. the Swedish Transport Administration introduced the so called “OLA” working method inviting actors, who can have an influence on road safety, from all relevant sectors of the society to contribute to safety improvements [65]. The actors invited in dialogue develop concrete actions for improving traffic safety within a problem area of their field of activity; they can adopt the ISO 39001:2012 Road Traffic Safety (RTS) [66] management system to enable their organization to reduce deaths and serious injuries related to road traffic crashes which they can influence. The action plans are then presented through a mass media seminar or similar where the participants publicly display their intentions to act. Participating in these activities strengthens the image of the company/organisation. Examples of participating actors are transport companies, municipalities, motorcycle associations, associations of driving schools.
The establishment of a combined accident database based on the police register and the hospital register requires some effort. A basic issue here is how to encourage the police to register accident data properly and transfer the data to a national data base. In some countries, it is the police who are the responsible body for road safety. However, it should not be the same organisation responsible for road safety that maintains the accident data base. The eagerness to show improvements in road safety might lead to “data loss”. Another issue is how to motivate hospitals and accident and emergency departments to regularly provide data on traffic victims to a central database. Continuous motivation and feedback to the staff doing this recording is necessary so that they feel their contribution is of importance.
To keep momentum and motivation of those involved, regular follow-ups with the responsible bodies and actors involved are of importance.
It is impossible to point out one specific element of this “package” of 12 essential elements of systematic Road Safety Management as more important than any of the others. These elements are not part of a “smorgasbord” where you can pick the parts you think suit you. It is a “package” and Road Safety Management at the national level cannot be stronger than the weakest link of it. However, there is one element which is the most critical one, and that is getting commitment from decision makers. Without their commitment, no achievements of significance can be made.
CONCLUSION
In Road Safety Management, besides a systematic approach with clear responsibilities and accountability of the involved stake holders, there is a need for:
- Monetary values of statistical life.
- A combined police register and hospital register of accidents.
- Exposure data (person-kilometres) for all transport modes.
- The use of a three-dimensional analysis of road safety problems.
- The use of Safety Performance Indicators.
- Applying only countermeasures with known effectiveness.
- Monitoring performance of applied countermeasures on a yearly basis.
Commitment from decision makers is decisive!
CONFLICT OF INTEREST
The author confirms that this article content has no conflict of interest.
ACKNOWLEDGEMENTS
Declared none.

