All published articles of this journal are available on ScienceDirect.

Should Implications for Tourism Influence the Planning Stage of a New HSR Network? The Experience of Spain
Abstract
Transportation and tourism are two closely linked economic activities and the scientific common view is that promoting transportation infrastructure may contribute to the development of tourism industry. But in the case of the building of new High-Speed Rail (HSR) lines, their extremely high construction costs require empirical evidence (at least at the planning stage) that certain economic activities, like tourism, are reinforced.
The aim of this paper is to assess empirically the effects of HSR on tourism in Spain, using a ranking model of city pairs, in order to establish a better way of allocating financial resources for public investments. There is practically no literature on empirical methodologies to assess the effects of new HSR on tourism and the current literature on tourism demand is dominated by econometric models using a single-equation time-series based approach, where the reduction of the travel cost generated by transport infrastructure can be considered. In this paper, the new proposed methodology is tested by application to 1,176 city pairs in Spain, a country with over 20 years of operating experience and the longest HSR network in Europe, where tourism represents more than 10% of the GDP. Results clearly show that the implementation of a tourism variable in the model offers a more effective approach for determining the implications of tourism on HSR demand and should be taken into account by policymakers in the HSR planning process. Finally, studies at local level demonstrate that future research is needed to complement this planning stage methodology.
TRANSPORT, HSR AND TOURISM: LITERATURE REVIEW
The concept of tourism supply is complex [1] in terms of both the nature of the product and the process of delivery. It involves a number of elements that constitute tourism supply and there is a strong dependence on natural resources and historical and cultural sites. Moreover, tourism activity (often) has a seasonal character and consumers need to move towards the product. Some authors see tourism as a compound product [2] or a form of complementary demand for which the main components are transport, food, and accommodation [3].
Although there is practically no literature on empirical methodologies to assess the effects of new HSR on tourism, the “scientific common view” is that promoting transportation infrastructure may contribute to the development of tourism industry. For some authors, like Hall [4] or Albalate and Bel [5], transportation is not only responsible for positive effects on tourism. Hall points out that the role of tourist mobility can be critical for social issues like inequality and sustainability. Indeed, Albalate and Bel demonstrate how urban tourism mobility can produce negative externalities, as having residents and tourists competing for scarce and constrained transport supply. The HSR implications for tourism are also a matter of interest for the airlines market, given that airports are the main gateways of foreign tourists, and air transportation the main mode for long distance mobility while the evidence of a marked loss in airlines’ market shares and reductions of airline operations due to HSR openings are fully documented. For the above mentioned arguments, the extremely high construction costs of new HSR lines require empirical evidence that regional development is reinforced and this “scientific common view” on promoting transportation infrastructure should be revised and debated [6].
Tourism is, despite its complexity, an economic activity and has been analysed using traditional gravitational and iso-tourist line models in order to evaluate the scope and levels of the tourism market. Crampon [7] first introduced the gravitational model into tourism research, which was then adjusted and refined by others [8]. The only application of this approach to a HSR scenario took place in 2012: the projected effects (not validated) of the Chinese HSR on tourism were examined by applying the iso-tourist line from a time-space replacement concept [9]. They forecast the effects of the HSR network on three aspects: the redistribution and transformation of the tourist market, market competition on a larger scale, and reallocation of the urban tourism centre. New economic geography models have also been used to evaluate HSR experiences. These models [10] integrate the factor of the location of economic activities and take account of the costs of transport and the role of spatial competition. The core-periphery model introduced by Krugman [10] showed that a change in transport cost induces a change in the intensity of spatial competition, which in turn influences the location of firms. For a lower transport cost, agglomeration forces tend to dominate the dispersion forces, and firms agglomerate at a larger scale into a smaller number of locations serving an extensive hinterland. Using Krugman’s core-periphery model, Masson and Petiot [11] discussed the influence of the southern European high speed rail (HSR) between Perpignan (France) and Barcelona (Spain) on both tourism activity and economic development. Through a theoretical (not empirical) discussion using Krugman’s theory, they argued that HSR can facilitate the development of tourism activities, and particularly business and urban tourism.
Apart from economic geography models, the choice destination approach, based on Rugg’s model [12], has played an important role. Rugg was the first to introduce a time constraint, the modification of the budget due to the transportation cost between alternative destinations. Assuming that tourists usually have a fixed holiday budget, Prideaux [13], developed a model to demonstrate the dynamic relationship between holiday expenditure categories and the tourists’ point of origin. The model is based on a total holiday expenditure function which depends on the discretionary spending and accommodation costs at the destination, and the cost of transport to access the destination. The only approach to study the effects of HSR on tourist destination choice was developed by Delaplace et al. [14] On the basis of a survey of tourists in Paris and Rome, they demonstrated that HSR influences destination choice in different ways in the two cities. Data collected from the two surveys were used for a quantitative analysis using regression models.
However the notion that destination choice may be influenced by HSR is no proof that the construction of a new line will automatically reinforce a tourist destination and increase tourist-sector revenues in this city (accommodation, restaurants, museums and so on). It is therefore important to quantify the increase in tourism demand or tourism revenues in order to assess the influence of a new HSR line on tourism. Following this approach, the existing literature on tourism demand is dominated by econometric models that tend to follow a single-equation time-series approach [15-17] along with a few advanced studies of demand systems [18]. This type of models is fairly dependent on the existence of a sound database. The only approach of this type applied to HSR corridors was developed by Chen and Haynes [19]. Through a multivariate panel analysis, they investigated the impact of Chinese high-speed rail systems on the tourism industry, selecting only the numbers of incoming foreign tourists and tourism revenue as the dependent variables (as data on domestic tourism demand was not publicly available in China). The results of this research confirmed that during the period between 1999 and 2010, the emerging high-speed rail services had significantly boosted tourism in China. Provinces with high-speed rail services were likely to have approximately 20 percent more foreign arrivals and 25 percent higher tourism revenues than provinces without these systems. This model is fairly difficult to apply to European countries with HSR networks for two main reasons. Firstly, it does not consider domestic tourists, and this percentage is quite high in Europe. Secondly, there is not always a database available on tourists in each city in Europe. Moreover, the impacts of HSR on tourism in a country like China, where the interurban transport network is less developed than in Europe, are probably of a higher magnitude and easier to detect by an econometric demand model.
There are other research works with interesting results worth mentioning in the literature, apart from the above mentioned studies on the link between HSR and tourism (based on economic geography models and econometric models of destination choice and tourism demand). These research works describe specific HSR experiences (study cases) but do not lead to a general conclusion. Guirao and Soler [20] examined the impacts of HSR on the tourism industry in Toledo (Spain) through a survey approach, and found that tourism accounts for over thirty percent of weekday HSR ridership, and that this type of user finds it hard to obtain tickets due to the massive presence of commuters. Bazin et al. [21] studied the impact of HSR on urban and business tourism in French cities near Paris such as Lyon. In the Paris-Lyon relation, the daily expenditure of business tourists may be up to four times greater than that of leisure travellers. Business tourism is a key strategic orientation for cities and large urban areas, although the possibility of returning within the same day reduced the average length of the visitors’ stay.
In all ex post studies, there is no overall evidence of the HSR reinforcement of tourism: the link between HSR and tourism depends on the type of tourism. Indeed the different types of tourism differ in their length of stay, aims and transport used by tourists. The literature shows that urban and business tourism can benefit from HSR because they are short stay tourism needing fast transport. But even in this case, the effects of High-Speed Rail services on tourism are controversial [22]. Ex-post dynamism of urban and business tourism associated with a HSR service is sometimes observed, but this dynamism depends on the magnitude of the accessibility improvement, on valorisation policies and on collaborative strategies.
As can be seen from this review of the state of the art, the link between tourism and HSR needs new research approaches in order to point to a proposal for a generalised extrapolation to different countries. To obtain empirical evidence of the effect of HSR on tourism (as literature on this topic is practically non-existent in Europe), and assuming that construction of new HSR lines in any country should follow a prioritisation process in the planning stage, the authors of this paper propose the inclusion of a tourism variable in an existing and validated ranking model [23, 24] to be applied to Spain. Spain has more than 20 years’ HSR experience and operates the longest HSR network in Europe (2,900 km). It offers a good scenario for validation, as the tourism sector represents 10.2% of its Gross Domestic Product (GDP).
The main contribution of this paper to the limited existing literature is the assessment of the tourism as an influence factor in the planning stage on a new HSR network. The added value of this research lies in the design of a ranking model using current HSR traffic data and taking account of tourism as a variable. In order to describe the research as a whole, the article has been divided into the following parts: state of the art (in section 1); description of the ranking model together with the application to the Spanish case (in section 2); the modelling process and results including a tourism variable for the Spanish case (section 3); the study of a specific Spanish city, Toledo, at local level (section 4); and finally, presentation of the most important conclusions (last section).
USING A RANKING MODEL IN THE PLANNING STAGE OF A NEW HSR NETWORK
There has so far been little research exploring a methodology to rank new HSR corridors, although this tool should be essential as part of any planning process. The first attempt to develop a HSR prioritisation tool was made by two American urban planners, Hagler and Todorovich in 2009 [25]. The proposed methodology was based on the hypothesis that five main categories of variables determine the value of the Ranking Index (RI) to score corridors in order to evaluate their HSR potential demand: population size, urban transit connections, origin-destination distance, economic vitality and congestion. Eq. (1) shows how these five categories were weighted and added in order to allocate scores to 27,000 city pairs in the U.S., with New York-Washington coming top of the ranking. The equation was applied only to American cities of above 50,000 inhabitants, and this process included approximately 600 cities and towns. The city pairs were created using a geographic information system (GIS), connecting each city to all other cities located between 100 and 500 miles (160 km and 800 km) from the origin city. This yielded approximately 27,000 city pairs across the nation on which to base the analysis. Table 1 gives an explanation of the meaning of the variables used by Hagler and Todorovich in this equation and the values assigned to each variable by the authors can be found in the same paper (reference).The top city pairs appeared to be consistent from a potential demand approach, although the model was not validated with real data, as the US has not any HSR network.
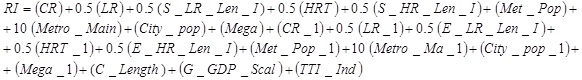 |
(1) |
Variables of the prioritization model of Hagler and Todorovich.
| Variable | Meaning |
|---|---|
| CR | Commuter rail at origin city |
| CR_1 | Commuter rail at destination city |
| LR | Light rail at origin city |
| LR_1 | Light rail at destination city |
| S_LR_Len_I | Origin city light rail system mileage |
| E_HR_Len_I | Destination city light rail system mileage |
| HRT | Heavy rail transit origin city |
| HRT_1 | Heavy rail transit destination city |
| S_HR_Len_I | Origin city heavy rail system mileage |
| E_HR_Len_I | Destination city heavy rail system mileage |
| Met_Pop | Metropolitan area population of origin city |
| Met_Pop_1 | Metropolitan area population of destination city |
| Metro_Main | Is the origin city the largest in the metropolitan area? |
| Metro_Ma_1 | Is the destination city the largest in the metropolitan area? |
| City_pop | Population origin city |
| City_pop_1 | Population destination city |
| Mega | Is the origin city located in a megaregion? |
| Mega_1 | Is the destination city located in a megaregion? |
| C_Length | Corridor length (miles) |
| C_GDP_Scal | Geometric mean of per capita GDP of the two metro regions (dollars) |
| TTI_IND | Combined TTI index of the two cities in city pair |
According to Equation 1, the model is fairly dependent on the weight allocated to each variable. As can be seen, the number of variables associated to the features of each city (urban structure, transit connection and population size) is greater than the combined variables associated to the corridor itself: distance, combined economic variable and combined congestion index. This approach prioritises the functional structure of the two cities over the interaction between them, and this fact will condition the modelling results. The values of the variables range from 0 to 3.0, and the authors logically give the maximum weight (10) to the variable Metro_Main (or Metro_Ma_1), which reflects whether the origin city (or destination) is the largest in the metropolitan area. The ranking index also aims to take into account urban form and population density by determining whether a city is located in a megaregion (also called megalopolis or the megapolitan area), an American concept [26], applied to networks of metropolitan regions (stretching over distances of roughly 300 miles - 600 miles in length) with shared economies, infrastructure and natural resource systems.
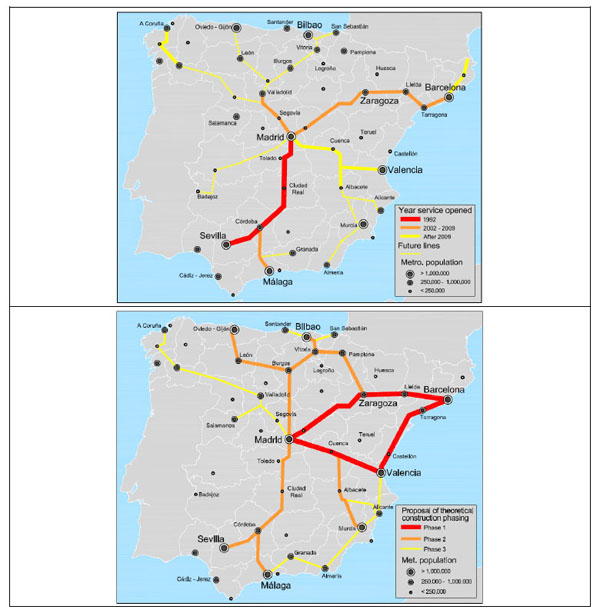
Guirao and Campa [23] and Guirao and Soria [24] used this approach to discuss and validate these ranking models in Spain, as there was therefore no real data available in the US to check the results. In Spain, with more than 20 years of operating experience and the longest HSR network in Europe (2,900 km), current HSR traffic allows to detect possible model deficiencies. In order to use similar criteria to the U.S. model, Spanish cities with over 50,000 inhabitants were selected, and city pairs were created by connecting each city to every other city located between 100 and 500 miles (160 km and 800 km) from the origin city. Spain, which can be considered a single megaregion, is administratively divided into 17 regions and 50 provinces, and all the capitals of the provinces were considered (after removing cities on Spanish islands). Two cities, not being capitals of province, were included in the data base because their population were greater than the capital itself: Jerez de la Frontera and Gijón. This selection process yielded 49 cities and 1,176 city pairs across Spain on which the analysis was based. Table 2 shows the top 50 Spanish city pairs obtained by applying the model. Fig. (1a) shows the current Spanish HSR lines in operation with their corresponding opening date while Fig. (1) shows a proposal for a theoretical phasing of construction based on the modelling results. In view of the fact the model was not devised to include a tourism variable, authors did not initially consider it, although this economic activity represents more than a 10% of the gross domestic product (GDP).
The connections between the three most populated cities (Madrid, Barcelona and Valencia) appear in the top ten of the ranking, showing a considerable difference (up to 3.0) in their scores compared to the following city pairs (the average difference between subsequent city-pair scores is 0.41). The present network covers the top ten city pairs with the exception of four important missing links: Barcelona-Valencia, Madrid-Bilbao, Barcelona-Bilbao and Madrid-Murcia. The model was validated by comparing these results to the current HSR network, and recording the traffic in each city pair in the top 50 that benefits from a HSR link. Table 3 shows the city pairs according to their position in the modelling ranking, indicating distance, travel time and annual traffic recorded in 2013.
Top 50 HSR city pairs in Spain according to the results obtained using the model of Todorovich and Hagler.
| Rank | City pair | Score | Rank | City Pair | Score |
|---|---|---|---|---|---|
| 1 | Madrid- Barcelona | 100.00 | 26 | Valencia - Murcia | 83.95 |
| 2 | Barcelona-Valencia | 96.73 | 27 | Valencia - Sevilla | 83.78 |
| 3 | Madrid-Valencia | 96.73 | 28 | Madrid - A Coru/a | 82.90 |
| 4 | Madrid-Bilbao | 93.01 | 29 | Salamanca - Madrid | 82.82 |
| 5 | Madrid-Sevilla | 92.81 | 30 | Madrid - Granada | 82.51 |
| 6 | Madrid-Zaragoza | 90.50 | 31 | Madrid - Almería | 82.14 |
| 7 | Barcelona-Bilbao | 90.44 | 32 | Barcelona- Castellñn | 82.14 |
| 8 | Madrid-Murcia | 89.81 | 33 | Madrid-Castellñn | 82.14 |
| 9 | Madrid-Malaga | 89.53 | 34 | Madrid-Cordoba | 82.14 |
| 10 | Barcelona-Zaragoza | 89.44 | 35 | Madrid -Lleida | 82.14 |
| 11 | Madrid-Gijñn | 88.21 | 36 | Madrid-Logroño | 82.14 |
| 12 | Barcelona-Murcia | 88.04 | 37 | Barcelona - Santander | 81.86 |
| 13 | Madrid-Alicante | 87.84 | 38 | Barcelona- Burgos | 81.62 |
| 14 | Barcelona-Alicante | 87.41 | 39 | Madrid-Tarragona | 81.46 |
| 15 | Madrid-Vitoria | 86.93 | 40 | Valencia - Málaga | 81.23 |
| 16 | Madrid-San Sebastián | 86.77 | 41 | Madrid - Albacete | 81.07 |
| 17 | Barcelona-San Sebastián | 86.16 | 42 | Barcelona-Logroño | 81.07 |
| 18 | Madrid-Santander | 85.71 | 43 | Madrid - Leñn | 81.07 |
| 19 | Barcelona-Vitoria | 85.24 | 44 | Valencia - Alicante | 80.98 |
| 20 | Valencia-Zaragoza | 84.64 | 45 | Barcelona - Valladolid | 80.13 |
| 21 | Barcelona-Pamplona | 84.27 | 46 | Madrid-Jerez de la Fontera | 80.13 |
| 22 | Madrid-Pamplona | 84.27 | 47 | Madrid - Badajoz | 80.01 |
| 23 | Valencia-Bilbao | 84.23 | 48 | Madrid - Huesca | 80.01 |
| 24 | Madrid-Burgos | 84.21 | 49 | Madrid-Teruel | 80.01 |
| 25 | Madrid-Valladolid | 84.00 | 50 | Sevilla - Malaga | 79.93 |
It can be seen that traffic decreases as we go down the ranking, with Madrid-Barcelona continuing to be the top origin-destination pair with more than 3.0 million passengers. In general terms, the results can be assumed to be consistent with recorded traffic, and the proposed model, which focuses mainly on the size and transit offer of metropolitan areas, can be used as a tool in a HSR network planning process. Nevertheless, Table 3 also shows some deficiencies in the ranking list that require explanation. Madrid-Valencia is second in the ranking list, but the recorded traffic in 2013 was lower than for Madrid-Seville (position 4); this may be for two main reasons. First, the Madrid-Seville line opened in 1992, and Madrid-Valencia in 2010; this latter connection had probably not yet reached its “maturity”. Furthermore, Seville has a considerable tourism attraction factor, and the model only considers (for each metropolitan region) population, transit and per capita GDP. These conclusions can be extended to another poor scoring connection, Madrid-Cordoba (ranking position 34), with 800,679 passengers. Tourism can be clearly a trip attractor variable, and particularly in countries where tourism is one of the main contributions to national GDP (over 10% in Spain).
Improving accessibility to a tourist city can be made a priority in the process of planning a new HSR network. Toledo and Segovia (in Spain) are good examples of this tourism-based approach, but in these two study cases, commuting is the main reason for the high registered traffic. For example, Madrid-Toledo was not considered by the model due mainly its proximity to Madrid (less than 160 km), although the size of the city (almost 78,000 inhabitants) would also condition his ranking position. However, HSR traffic in 2013 was 1,326,691 passengers, a higher figure than for city pairs with positions above 15 in the ranking. Toledo is a mid-sized city in central Spain, 70 km south of Madrid, and was declared a World Heritage Site by the UNESCO in 1986 for its extensive cultural and monumental heritage. Moreover, this city pair is successful in terms of traffic not only due to its HSR link to Madrid or the tourism attraction, but also because of the type of service provided by the operating company. Since 2005, Toledo has had over 10 daily HSR shuttles (30 minutes’ travel time), and this fact is also favoured by the availability of monthly tickets which are economically very advantageous compared to ordinary one-way tickets. This frequency, if the timetables are suitable (as is in fact the case), allows their use by commuters. The high traffic of Toledo is due mainly to a mix of commuting and tourism and neither of these two variables is considered by the model. All the HSR tourist destinations, as conclusion, do not have the same profile in terms of HSR services, attraction capacity (leisure, business products, urban environment) and length of the stay.
In relation with the methodology used, the first previous findings show the consistency of this ranking model as a preliminary approach to ranking pairs, mainly for the top first O-D relations; however (as showed above) the model fails to discriminate clearly between secondary groups of corridors, and needs improving. These deficiencies are chiefly due to the type of variables used by the model, which focus on metropolitan population size and local transit in each city, ignoring other factors affecting HSR demand, such tourism.
Long-distance HSR traffic for the only top 50 city pairs currently in operation (2013).
| Origin | Destination | Ranking position | Distance (km) |
Year service opened | HSR Travel time (min) |
Passengers 2013 |
|---|---|---|---|---|---|---|
| Madrid | Barcelona | 1 | 621 | 2008 | 150 | 3,070,184 |
| Madrid | Valencia | 2 | 391 | 2010 | 100 | 1,858,436 |
| Madrid | Seville | 4 | 471 | 1992 | 150 | 2,175,808 |
| Madrid | Zaragoza | 6 | 306 | 2003 | 75 | 1,176,841 |
| Madrid | Malaga | 9 | 513 | 2007 | 150 | 1,533,363 |
| Barcelona | Zaragoza | 10 | 260 | 2008 | 90 | 623,555 |
| Madrid | Cordoba | 34 | 345 | 1992 | 105 | 757,673 |
| Madrid | Valladolid | 25 | 180 | 2007 | 56 | 1,212,632 |
| Madrid | Lérida | 35 | 442 | 2003 | 125 | 231,582 |
| Madrid | Tarragona | 39 | 521 | 2006 | 150 | 300,918 |
| Madrid | Albacete | 41 | 322 | 2010 | 90 | 238,495 |
| Seville | Malaga | 50 | 270 | 2008 | 110 | 96,480 |
THE INTRODUCTION OF A TOURISM VARIABLE IN THE RANKING MODEL
In order to highlight the need to seek new variables for the ranking model, Guirao and Campa [27] conducted a sensitivity analysis, changing the weights of the variables under the four hypothesis and seeking to avoid some of the model’s weaknesses. In the first hypothesis, all the variables are given the same weight (1.0) to determine whether the top-ranked pairs are modified. In the second, more emphasis is given to the combined variables, while the third hypothesis awards the same importance to all the transit modes. Lastly, in the fourth hypothesis, all the weights are modified in order to obtain the same level of importance per block of variables (transit, population and combined variables). This weighting analysis, under various hypothesis applied to the Spanish network, revealed that the population variables have an excessive and even redundant influence on the results if we consider the clear relation of dependence between the size of a population and the length of its transit network. This sensitivity analysis also enabled the authors to present some specific suggestions for the generalized extrapolation of the methodology, which included the definition and introduction of new variables, such tourism.
The type of tourism variable needed in the model is relatively dependent on the availability of a tourism database in each country. The ranking model structure requires a variable that represents the tourism value of each city considered in our research (at the provincial capital level) and –as tourism is a compound product– one that should consider both the attraction capacity exerted by the city’s offering of leisure and business tourism products, along with the urban environment and local life. In Spain, the most comprehensive study on the tourism competiveness of Spanish cities is URBANTUR 2012 [28]. This document is the first to show the 20 most important Spanish urban destinations, obtained by assessing 57 city indicators classified into six categories (see Fig. 2, with the explanation of the ranking position of the city of Toledo):
- Category 1: Attraction capacity offered by leisure products
- Category 2: Attraction capacity offered by business tourism products
- Category 3: Competitive conditions offered by the urban environment and local life
- Category 4: Accessibility and mobility
- Category 5: Administration and strategic management
- Category 6: Economic and social results
Table 4 shows the final ranking obtained for the 20 previously selected cities based on the scores for each category in each city. Another important issue to discuss is the weight given the tourism variable to be added to the model and the values assigned to it.
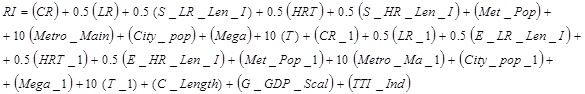
Guirao and Campa [27], in the sensitivity study conducted for the initial model, calculated the percentage of influence of each variable on the RI (Ranking Index) and on the maximum score for each block of variables (population, transit or combined variables). They reported that population variables can account for up to 70% of the RI value, while transit variables and combined variables (length, combined GDP and combined congestion) account for only 18%, and 12% of the total RI respectively. From this point of view, the level of influence of the combined variables is very low, and their evident insignificance does not seriously affect the final results. However the population variables have an excessive and even redundant influence on the results if we consider the marked relationship of dependence between the size of a population and the length of its transit network. In view of this, the tourism variable (T) has been given a weight of 10 in the model (see Eq. (2)) in order to balance the importance assigned to population variables. The maximum score for the tourism variable –3.0 (similar to the maximum score for the rest of the variables)– was assigned to Barcelona (see Table 4). The last city in the ranking –León– was assigned 1.0; and all other Spanish cities that do not appear in the URBANTUR ranking were assigned a value of 0.0. Cities on the URBANTUR list have been given a linear value between the maximum 2.0 and the minimum 1.0, according to their score in the URBANTUR ranking.
One of the drawbacks of the URBANTUR study is that it only considers 20 Spanish cities, two of which are not provincial capitals (Santiago de Compostela and Gijón). In order to adapt this ranking to our prioritisation model, we have assigned La Coruña the same tourist score as Santiago de Compostela (Santiago de Compostela does not appear in our model database although Gijón does).
Before the application of this equation to our case study, one of the deficiencies detected in the original model had to be amended: cities located within a 160 km radius from the centre of a major metropolitan area were not considered by the model data base. From the tourist point of view, in Spain, we have also are many touristic cities in that situation (Toledo, Salamanca, Burgos or Segovia). In the original model, city pairs were created using a geographic information system (GIS), connecting each city to all other cities located between 100 and 500 miles (160 km and 800 km) from the origin city. This index weighted the distance criteria such that it peaked between 200 and 300 miles and decreased to zero after 500 miles. The value began at 2 for corridor lengths of 100 miles, increased linearly, and peaked at 2.5 for corridor lengths between 150 – 300 miles, decreased linearly to 2 at lengths of 350, then decreased to 1.5 and continues decreasing linearly to a value of 0 for lengths of 500 miles. Attending this formulation, corridors with lengths lower than160 km. were not included in the model data base. The Spanish HSR experience shows that cities located within a 200 km radius from the centre of a major metropolitan area should be studied in detail in order to award higher values in the ranking result. In terms of high speed rail, this distance (200 km) is equivalent to approximately one hour’s travel time and in Spain we have registered high HSR commuter traffic in these corridors. In order to consider these cities, corridors with lengths of below 160 km have been introduced in the model database, and their distance variable has been given the value of 0.0. With these changes applied in the original equation, Table 5 shows the main results of the model after applying these changes to the original equation: the top 50 HSR city pairs in Spain according to the results obtained using a tourism variable and considering pairs O-D separated by less than 160 km.
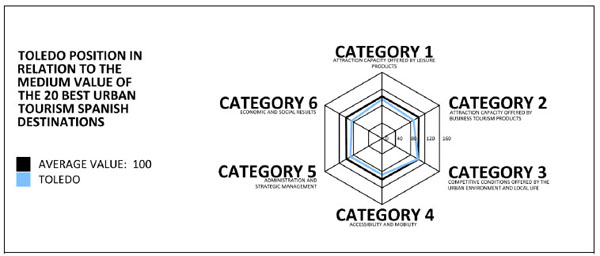
Example of the basis (categories) for Toledo’s position in the URBANTUR ranking.
URBANTUR ranking for the 20 top urban Spanish destinations (2012).
| City | Ranking 2012 | Score | City | Ranking 2012 | Score |
|---|---|---|---|---|---|
| Barcelona | 1 | 141,4 | Salamanca | 11 | 95,7 |
| Madrid | 2 | 139,1 | Gijón | 12 | 94,2 |
| Valencia | 3 | 111,0 | Córdoba | 13 | 93,9 |
| Sevilla | 4 | 104,3 | La Coruña | 14 | 92,4 |
| San Sebastián | 5 | 103,1 | Alicante | 15 | 91,9 |
| Málaga | 6 | 98,3 | Santander | 16 | 91,1 |
| Bilbao | 7 | 97,9 | Toledo | 17 | 90,8 |
| S. de Compostela | 8 | 97,3 | Burgos | 18 | 88,0 |
| Zaragoza | 9 | 96,6 | Oviedo | 19 | 86,4 |
| Granada | 10 | 95,9 | León | 20 | 85,7 |
 |
(2) |
If we compare these results to the current HSR network traffic (see Table 3), we can state that the changes applied in the original equation have clearly corrected some previous deficiencies, although the three top relations remains the same: Madrid-Barcelona, Barcelona- Valencia and Madrid-Valencia. The fourth pair has changed. When the tourism variable is considered, Madrid-Bilbao is replaced by Madrid-Seville, as Seville has a higher tourism score than Barcelona in the URBANTUR ranking. Madrid-Zaragoza goes from 6th to 11th position in the ranking, while Madrid-Málaga remains the same (9th position), and traffic validates this fact (Madrid-Malaga has higher HSR traffic than Madrid-Zaragoza). Other cities are clearly disadvantaged by the URBANTUR study (like Vitoria or Murcia): pairs such as Madrid-Murcia, Barcelona-Murcia or Madrid-Vitoria are relegated from the top HSR ranking. Other cities like Toledo are included on the list for the first time, and traffic figures validate this inclusion. Madrid-Cordoba also improves its position in the ranking list, as do other cities like Santander and Burgos
As can be seen, this model explains the relationship between HSR and tourism more effectively: tourism is a positive HSR demand factor and it should be taken into account and influence the planning stage of a new HSR network, especially when the assessment is based on a multi-criteria corridor selection methodology (Guirao and Campa [29]). One of the determining factors to go ahead with this approach and extrapolate this methodology to other countries is the existence of a data base focused on the tourism competiveness of cities; even the Spanish URBANTUR shows some limitations and only 20 Spanish cities are included in the study. With this data base, the model cannot establish any difference among the cities non being in this top ranking (like Segovia, Cuenca or Gerona), which also have some touristic attractiveness.
Nevertheless, there is still an unsolved issue in the ranking model that can affect tourism results: this is the way in which medium-distance HSR services (commercially called AVANT) are considered. We know that, for an O-D pair, not only the size of the population but the type of service offered can condition transportation demand in some specific cases of cities located within a 200 km radius from the centre of a major metropolitan area. The ranking model should be able to identify this demand variable, after the process of selecting the cities. In terms of high-speed rail, this distance (200 km) is equivalent to approximately one hour’s travel time, which allows it to be used by commuters. One important feature of these medium-distance services is the use of slower and cheaper HSR shuttles (260 km/h maximum speed trains) running frequently –with between 6 and 12 services per day– at lower fares. Single ticket fares for these medium-distance services are 0.10 euros/km (2010), almost half that of long-distance pure HSR service, and similar to medium-distance conventional rail fares. Although their frequency is lower than conventional suburban rail services, they offer similar discounts of between 20% and 50% for frequent travellers. Thanks to these advantageous operating conditions the AVANT services are often used for commuting.
Top 50 HSR city pairs in Spain according to the results obtained using a tourism variable and considering O-D pairs separated less than 160 km.
| Rank | City pair | RI | Rank | City Pair | RI |
|---|---|---|---|---|---|
| 1 | Madrid - Barcelona | 106,31 | 26 | Barcelona-Toledo | 81,12 |
| 2 | Barcelona- Valencia | 97,21 | 27 | Madrid- Toledo | 80,30 |
| 3 | Madrid -Valencia | 96,59 | 28 | León - Barcelona | 80,18 |
| 4 | Madrid- Seville | 92,95 | 29 | Valencia - Bilbao | 79,63 |
| 5 | Madrid - Bilbao | 91,32 | 30 | Zaragoza - Valencia | 79,47 |
| 6 | Barcelona- Bilbao | 90,73 | 31 | Valencia - San Sebastián | 78,59 |
| 7 | Barcelona- San Sebastián | 90,12 | 32 | Valencia - Málaga | 78,33 |
| 8 | Barcelona- Zaragoza | 89,91 | 33 | Valencia - Alicante | 76,49 |
| 9 | Madrid-Málaga | 89,79 | 34 | Oviedo - Madrid | 75,97 |
| 10 | Madrid- San Sebastián | 89,79 | 35 | Sevilla - Málaga | 75,91 |
| 11 | Madrid- Zaragoza | 89,79 | 36 | Valencia - Granada | 75,31 |
| 12 | Madrid- Gijón | 88,07 | 37 | Valencia - Salamanca | 75,30 |
| 13 | Barcelona - Alicante/Alacant | 87,69 | 38 | Gijón - Valencia | 75,26 |
| 14 | Madrid - Alicante/Alacant | 87,28 | 39 | Valencia - Córdoba | 74,43 |
| 15 | Madrid - Coruña, A | 86,41 | 40 | Valencia - Santander | 74,06 |
| 16 | Madrid- Santander | 86,06 | 41 | Valencia - Burgos | 74,02 |
| 17 | Madrid- Salamanca | 85,94 | 42 | Zaragoza - Bilbao | 73,70 |
| 18 | Madrid - Granada | 85,85 | 43 | Valencia - Toledo | 72,49 |
| 19 | Madrid - Córdoba | 85,14 | 44 | Sevilla - Granada | 72,23 |
| 20 | Barcelona- Santander | 84,87 | 45 | Zaragoza -San Sebastián | 72,17 |
| 21 | Madrid - Burgos | 84,52 | 46 | Sevilla - Alicante/Alacant | 72,09 |
| 22 | Burgos - Barcelona | 83,92 | 47 | Sevilla - Salamanca | 72,00 |
| 23 | Salamanca - Barcelona | 83,91 | 48 | Gijón - Bilbao | 71,97 |
| 24 | Madrid - León | 82,43 | 49 | San Sebastián - Bilbao | 71,70 |
| 25 | Valencia- Seville | 81,14 | 50 | Gijón - Sevilla | 71,55 |
As part of future research, the authors of this paper considers necessary to introduce in the model a commuting variable (for those cities separated less than 200 km from big metropolitan areas). This variable (commuting) explains the traffic in the Madrid-Valladolid corridor, but also part of the traffic in some tourist cities such as Toledo. Over 60% of the demand between Madrid and Toledo is from commuters and not tourists. As a line of future research, the authors consider it necessary to introduce a commuting variable in the model (for cities less than 200 km from major metropolitan areas). This variable will help separate two types of travel demand in the model: tourism and commuting. With the current equation, the model only considers the first, and some medium-distance HSR pairs with high traffic are missing (like Madrid-Ciudad Real). However, the improvements to the model are evident; it has been empirically demonstrated that tourism conditions HSR demand, and that the implications for tourism should be studied in detail and at the local level. Significant progress is being made with this last approach, which is described in next section.
CASE STUDY AT LOCAL LEVEL: TOLEDO AS AN EXAMPLE
Because it is possible that HSR generated local effects only contributing to the tourist activity, we should study what is the relationship between HSR lines openings and tourist outcomes. The main approach of this paper has been based on the study of the HSR traffic increase as a demand response to tourism, being tourism an attraction factor in certain destinations. But in the inverse order, it is also interesting to analyze whether tourism indicators at destinations have been influenced by the opening of new HSR lines.
We have selected Toledo, with almost 78,000 inhabitants, as our first case study at local level. Toledo is a mid-sized city in central Spain, 70 km south of Madrid, and was declared a World Heritage Site by the UNESCO in 1986.The HSR line Madrid-Toledo was opened in 2005, but (as Fig. 3 shows) rail traffic in the conventional line, before the construction works of the new line started, was not small (over 800.000 passengers in 2002). Nowadays, more than 60% of users of the HSR line Madrid-Toledo are commuters. The first indicator we tried to quantify was the evolution of the number of tourists in Toledo and we drew on tourism data provided by the Spanish National Statistical Institute (INE) that covers 50 provinces and a reduced number of touristic points (Toledo city is considered a touristic point by INE) within a time span of 15 years (1998-2013). The indicator “number of tourists” is calculated by INE using only results of a survey campaign to hotels, so we have to bear in mind that those city visitors not spending at least one night at destination are not registered as “tourists”. This drawback of the INE data base is very important for cities like Toledo, located close to big metropolitan areas (Madrid), in which the overnight stay is not so necessary. Taking this fact into account we sought for other indicators, as the number of Museums visitors (tickets sold) in Toledo and its evolution before and after the implementation of the new HSR line. As St. Tomé Museums is one of the most visited in the city, we recorded the data of the tickets sold by year. Fig. (3) shows the number of tourists and overnight stays in Toledo (before and after the inauguration of the HSR services in 2015) together with the evolution of rail passengers and the main Museum visitors.
(Fig. (3)) shows there is no evidence of the HSR influence on these tourism variables, although data provided by INE (linked to hotel overnight stays) are not very suitable for this type of city. Other circumstance to take into account is the socioeconomic climate after 2005: the Spanish financial crisis started in 2007 and tourism indicators for that period may be also affected by this fact. This data context helps to point out the difficulties to assess the HSR influence on tourism indicators. In order to look for more empirical evidence also analyzed the evolution of the number of restaurant licenses in the city of Toledo from the year 2000 (530 licenses) to 2013 (800 licenses) and we obtained that the evolution of the annual growth rate was quite similar to the HSR traffic one. This fact is one of the reasons why, in cases of HSR touristic nodes located within a 160 km radius from the centre of a major metropolitan area, other kind indicator different from the “number of tourists” provided by INE should be studied (like tickets sold at museums, restaurants or number of people in tourism employment). If we used the single-equation time-series approach to analyze the influence of HSR on tourism, selection of the best independent variables together with the data availability should be essential to assess the problem.
Whether HSR has helped to improve the image of a touristic city is very difficult to assess in the short run. Apart from the line Madrid-Seville, the majority of the Spanish HSR lines have less than 10 years of operation and it´s too soon to analyze this kind of “indirect effect”. As conclusion, apart from above mentioned difficulties to design a single-equation time-series model to assess the HSR influence on tourism, other type of indirect effects, like the improvement of a destination image together with the interaction between air transport and HSR at tourist cities need future research.
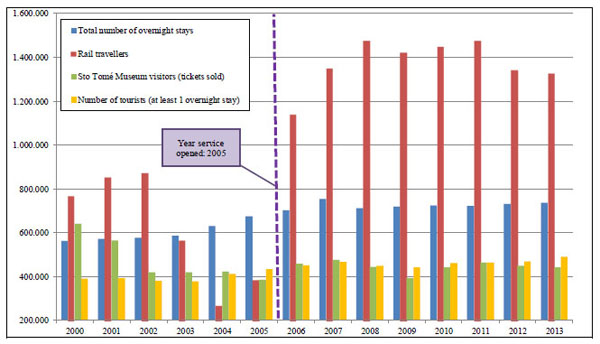
City of Toledo. Evolution of rail travelers versus the evolution of certain tourism indicators (annual number of overnight stays, number of tourists and number of Museum visitors).
CONCLUSION AND RECOMMENDATIONS FOR FUTURE RESEARCH
Empirical methodologies to establish the economic benefits of the HSR lines has become an important issue in countries having HSR systems and, for financial reasons, also in countries that do not yet have them. For that reason, ranking the construction of new HSR lines should be essential at the national planning stage of a new network. Tourism is for many countries, like Spain, an important economic sector, but the current ex-post studies show that the relationship between HSR and tourism is controversial. Apart from the economic geography and destination choice models, the existing tourism demand literature is dominated by econometric models which use to follow a single-equation time-series approach. Despite the existence of these tools, they have practically not been applied to HSR study cases and with the construction of new HSR lines, there has so far been little research exploring a methodology to rank HSR corridors taking into account a tourism variable.
An existent prioritization model is used by the authors of this paper to include a tourism variable and validate results with the current Spanish HSR network. After including corridors with lengths under 160 km., the Spanish URBANTUR data base was used to design a new tourism variable. Although URBANTUR has some drawbacks (only 20 Spanish cities are considered) results can be assumed to be consistent with the HSR recorded traffic in 2013. Moreover, we can state that the changes applied in the original equation have clearly corrected some previous deficiencies in the original model when applied to Spain. Madrid-Seville, Madrid-Málaga, Madrid-Córdoba are, for example, better ranked according to the recorded traffic. As conclusion, we can point out that tourism should influence the planning stage of a new HSR network or the assessment of an existing one.
Finally, in the last section, some reflections are presented at local level, taking Toledo case study as a preliminary research. The first difficulties found to design a model based on single-equation time-series approach are related to the tourism data base provided by INE in Spain, which is centred basically on the overnight stays at destination. This type of data is not significant for the cases of HSR touristic nodes located within a 160 km radius from the centre of a major metropolitan area, and the model needs other type of tourism indicators to be calibrated. Additionally, other kind of indirect effects, like the improvement of a destination image together with the interaction between air transport and HSR at tourist cities, will need future research in the next years.
DISCLOSURE
Part of this article has been previously published in Procedia - Social and Behavioral Sciences Volume 160, 19 December 2014, Pages 25–34; doi:10.1016/j.sbspro.2014.12.113
CONFLICT OF INTEREST
The authors confirm that this article content has no conflict of interest.
ACKNOWLEDGEMENTS
Declared none.

