All published articles of this journal are available on ScienceDirect.
Analysis and Validation of a New Access System to the Airport Salerno-Costa D'Amalfi
Abstract
Airport accessibility is an important criterion for airport choice and therefore also for an airport competition. When users choose an itinerary, they think about the transport chain from an origin to a destination. Therefore, the variables having an impact on their decision for a given alternative go beyond the price and quality of air services from one airport to another. The decision for or against a given air service and a given airport is to a certain extent dependent on the accessibility of the airport.
The objective of this manuscript is to propose an analysis and a validation of a new access system to the airport Salerno-Costa d’Amalfi in Campania region, in the south of Italy, due to its growing development. Three different scenarios are proposed and simulated. Performance indicators are provided in order to quantify the effects of the alternative interventions aiming at improving the accessibility of the airport itself. Policy-makers may be interested in a more accessible airport since these interventions may have impacts on the regional socioeconomic development.
1. INTRODUCTION
Until almost two decades ago, the choice of an airport was relatively easy for travellers. Indeed, usually only one airport provided flights to a given destination [1]. Nowadays, on the other hand, users can choose between several airports when arranging a trip. Regional airports have grown very fast over the last decade(s) and are now providing flights to many destinations. The motivation of this trend lies in the rise of low-cost airlines that have concentrated their business in these airports.
Several airports in Europe are approaching their capacity limits (i.e. physical limitations in terms of runway; handling capacity; environmental limitations in terms of noise, gases or particles). In this context, policy makers can face this situation in several ways, for example it is possible to reduce the demand for air transport (e.g. by promoting the use of alternative transport modes), but also stimulate the effective use of the existing capacity. Moreover the expansion of the physical capacities of the airport represents an opportunity when possible, through the building of new runways and/or terminals. However, the last option is a major investment and the space is not always available. Alternatives might include building a new airport in an another location and attracting more traffic to existing airports in the neighborhood (either by attracting airlines to these airports, by collaboration between the airports, or by out placing flights to these other airports [1].
Making alternative airports more accessible, through extra roads, better public transport, and new high-speed rail connections, reprisents a real challenge and this is the focus of this manuscript.
Indeed, increasing the accessibility is another important issue from a policy point of view. Most airports are located close to large cities or metropolitan areas [2-4]. As a result of the increase in traffic, congestion is becoming a major issue and hence, the accessibility (and the competitive position) to the airport. Improving the accessibility of the airport could be a challenge for policy makers also in terms of the subsequent socioeconomic benefits for the region served.
Ground accessibility to airports plays a dominant role as demonstrated in the work by Skinner [5]. A series of models was calibrated using a air passenger survey data. These models were related to the probability that a given airport was selected based on ground accessibility measures associated with each available airport. A variety of measures for ground accessibility were tested and they turned out to be significant and dominant ones.
This is the case of Campania region, where Capodichino airport has always been the only choice for travellers. Policy-makers are now investing and expanding the other passengers airport, located in the same region, i.e. the Salerno-Costa d’Amalfi one.
The objective of this paper is to propose an analysis and a validation of a new access system to the airport Salerno-Costa d’Amalfi, due to its growing development. The methodology proposed follows the rational planning framework of urban planning setting definition; transport demand estimate; transport supply development; assignment and network performance indicators definition [6].
This work is divided into five sections. The second section describes the case study, i.e. the airport of Salerno-Costa d'Amalfi. In the third section, the methodology is proposed. Section 4 presents the proposals for new intervention scenarios and, finally, in section 5, conclusions are reported.
2. THE CASE STUDY
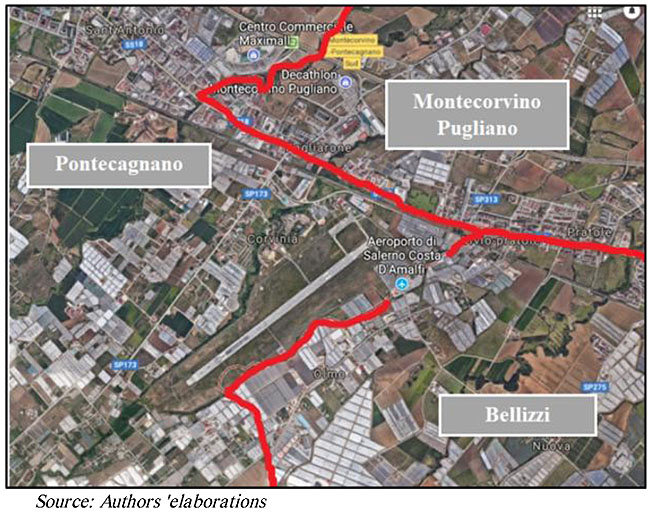
The airport Salerno-Costa d’Amalfi, located between the municipalities of Montecorvino Pugliano, Bellizzi and Pontecagnano Faiano (Fig. 1), is 21 km far from Salerno (in Campania region, in the south of Italy), and it is an airport of national interest.
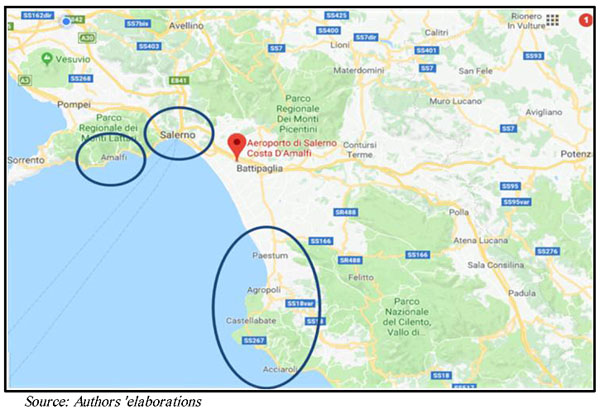
Its location is strategic also for tourist trips towards the Amilfitana and Cilentana coasts, and for the cultural sites of Paestum and Capaccio (Fig. 2).
The airport is made up of two parts, i.e. the landside and the airside. The airside includes the equipment and services used for the aircraft handling: runways, connecting bridges (taxiways) and parking areas and the air traffic control system. The airport has a runway 1, 654m long with a capacity of 4 movements/h and a parking area. On the other hand, the landside includes all the facilities and services associated with passengers, e.g. departing and arriving terminals, the airport access system and parking cars. The passengers terminal is divided in two areas, i.e. east and west, and it has a capacity of 26,000 pass/year.
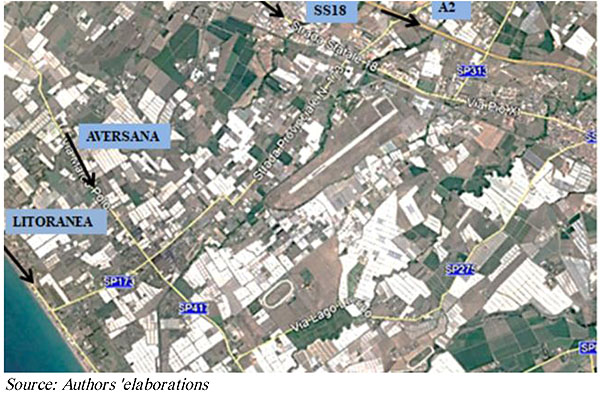
With reference to the accessibility to the airport, in relation to road connections, the current configuration of the road network allows access mainly through the A2 motorway with the Montecorvino Pugliano-Pontecagnano South junction, and to a lesser extent using the national road n. 18 and the Provincial Roads SP175 and Aversana SP417 (Fig. 3).
As for the rail network, the municipality is crossed, in the North - South corridor, by the Salerno - Reggio Calabria line of the Rete Ferroviaria Italiana with the Pontecagnano station serving the municipality itself and the Montecorvino station which is about 2 km far from the airport.
With reference to the Master Plan for the airport of Salerno, the forecast of passengers up to 2035 is reported in Table (1).
| REFERENCE YEAR | RUNWAY LENGTH (M) | PASS/YEAR |
|---|---|---|
| 2025 | 2000 | 638,239,000 |
| 2035 | 2000 | 1,890,839 |
| 2035 | 2200 | 3,500,000 |
The evolution of the traffic flow is on the basis of the sizing of the various facilities envisaged in the short, medium and long-term scenarios.
It has an impact on the runway length; the surface of the aircraft parking areas and the capacity of the passengers' terminal.
Some interventions are in the pipeline: A new airside system with the extension of the runway to 2,200m; the extension of the terminal with reference to the passenger terminal and to the buildings supporting the operations of the airport; the reconfiguration of the forecourt area; the redevelopment and planning of all access roads to the airport and the metro-airport connections; the construction of the Salerno metro stop (named Salerno Costa d'Amalfi airport).
3. THE METHODOLOGY
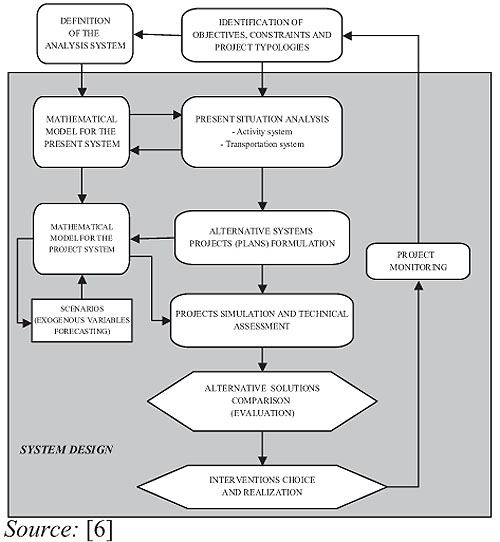
Transportation planning has historically followed the rational planning framework, based on the goals and objectives definition, the problems’ identification, the alternative generation, and the alternative evaluation [6].
A decision process in transportation planning is made up of different macro-activities (Fig. 4). At the right side of the figure, the decision process is reported, while at the left side, the phases of analysis and modeling functional to these activities are shown. In the phase of objectives and constraints identification, the objectives of the decision-maker and the relevant constraints for the project are defined. In the phase of analysis of the present situation, data on the transportation and activity systems are collected. This phase is also linked to the building of a mathematical model of the present system, since it provides the input data for the models (transport supply, transport demand, land-use). From these models, estimates of system performance indicators such as flows, saturation levels, generalized transport costs by Origin-Destination zones of the city can be obtained as a measure of the effects of the interventions on sustainability. The formulation of system projects follows. Assessment and evaluation of alternative projects require the simulation of the relevant impacts of their realization.
After the project implementation, forecasted and actual effects can be compared, the occurrence of unexpected developments and new problems can be observed together with the evaluation of social consent and/or dissent. The monitoring of the project is the checking of the main “state variables” of the transportation system and the use of them can identify new problems and the a posteriori evaluation of project impacts.
The effects of any transport intervention can be modelled in terms of the effects relevant for some of the actors involved. Thus the definition of the relevant impacts is the main indicator of the approach followed and the breadth of the evaluation activity. The spectrum of the effects considered has widened with the passing of time in concert with improvements in modeling and simulation and with the expansion and classification of the different and often contrasting objectives and goals of actors and decision-makers.
Impact indicators are typically computed for a subset of simulation or reference periods and then extrapolated to larger time periods. Many impacts can be simulated by using the models as shown in Fig. (5). The estimation of these impacts requires the simulation of the system in the Project (P) and Non-Project (NP) states and the calculation of variations between the variables measuring quantifiable impacts.
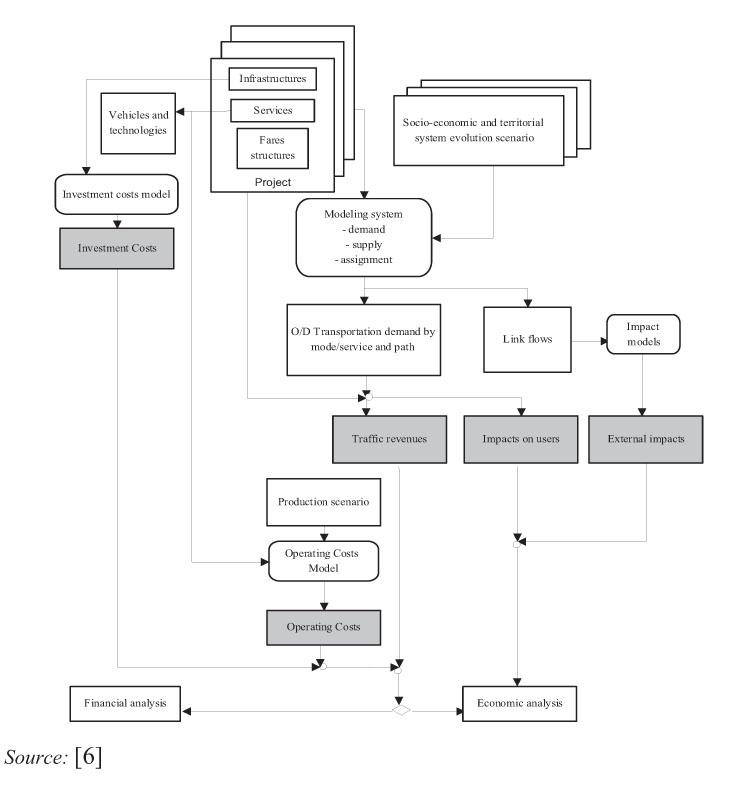
After the study area definition described in the previous section; the transport demand estimate has been computed. Then the transportation supply network has been modelled together with the network assignment. Finally some performance indicators have been computed in order to test the different scenarios.
Concerning the transport demand, the Origin-Destination (O-D) matrix has been elaborated. The supply model is made up of the following steps, i.e. the study area definition, the zoning; the graph construction and the identification of the cost functions.
The demand/supply interaction model has allowed the computation of the flows on the network links and the performance of the system in terms of congestion, travel time, accessibility, etc.
In order to evaluate the performance of the network, some indicators have been identified, i.e.:
- Performance indicators [7, 8]:
- Tot Km on the network (flow * link length);
- Tot travel time (flow * link travel time);
- Average speed (Tot Km/ Tot time spent).
- Congestion indicators referred to the paths considered relevant.
Three different scenarios have been elaborated:
-
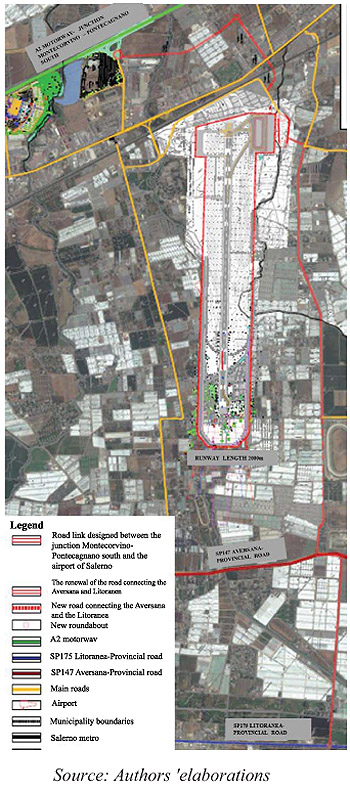
Scenario 1 (medium term) with reference to the year 2025, in relation to the data present in the Master Plan. The following interventions have been considered (Fig. 6):
- The construction of the road link designed between the junction Montecorvino - Pontecagnano South and the airport of Salerno;
- the renewal of the road connecting the Aversana and the Litoranea roads;
- the runway partially extended;
- the rail section relative to the link between Pontecagnano station and the bus to the airport.
-
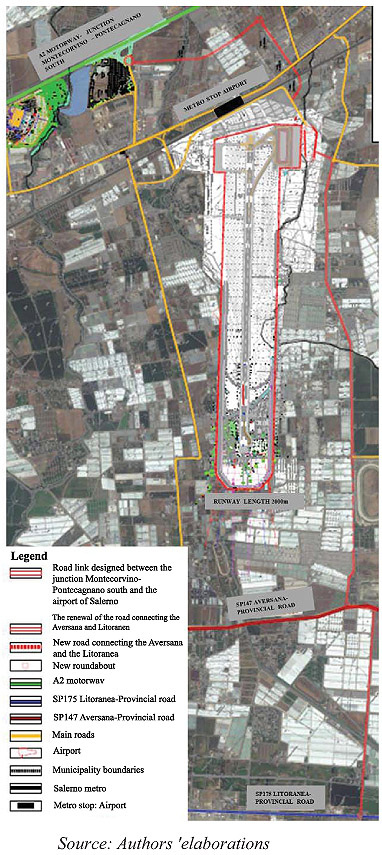
Scenario 2 (long-term) with reference to the year 2035. The following interventions have been considered (Fig. 7):
- the construction of the road link designed between the junction Montecorvino - Pontecagnano South and the airport of Salerno;
- The renewal of the road connecting the Aversana and the Litoranea roads;
- The runway partially extended;
- the opening of the Salerno metro stop: Airport, 100m far from the passenger terminal.
-
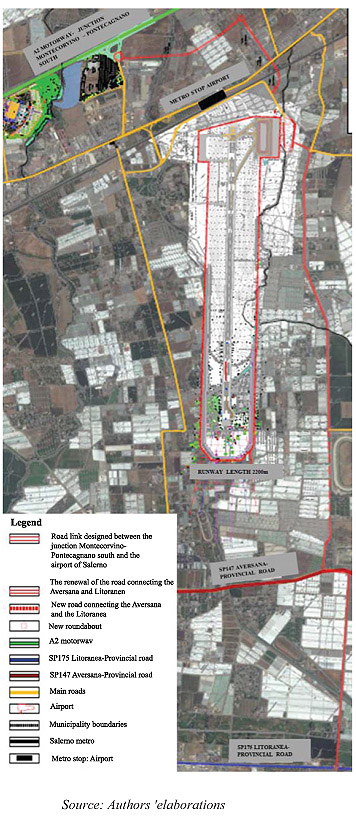
Scenario 3 (long-term) referred to the year 2034. The maximum development of the airport of Salerno is considered, taking into account (Fig. 8):
- The runway extension to 2,200m;
- The construction of the road link designed between the junction Montecorvino - Pontecagnano South and the airport of Salerno;
- The renewal of the road connecting the Aversana and the Litoranea roads;
- The opening of the Salerno metro stop: Airport, 100m far from the passenger terminal.
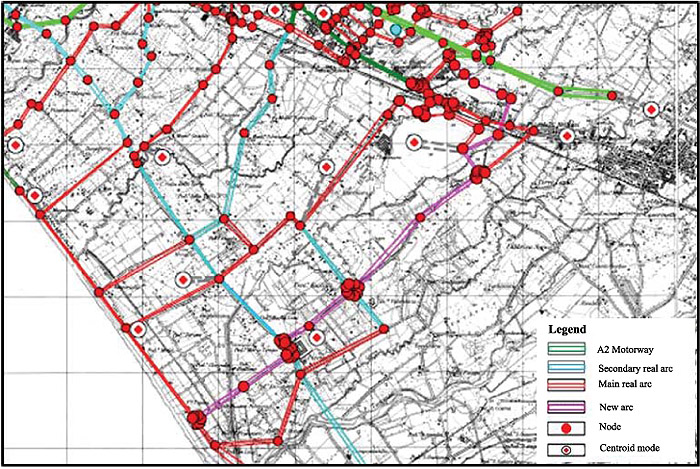
The graph is reported in Fig. (9).
The total demand is composed of an O/D matrix, already available for the whole study area, which has been extended with reference to the airport traffic flows forecasted in the project scenarios. Considering also the seasonality of the Salerno-Costa d'Amalfi airport, reference was made to peak hours in the morning and evening during the summer season.
Through the comparison with the modal split of the closer Capodichino airport, passengers were divided for the means of transport used to access and exit the airport area and the equivalent entry and exit vehicles were calculated using the conversion factors.
On the basis of the data processed, therefore, the following equivalent vehicles (arriving and departing) were forecasted in the three scenarios considered in an hour (Tables 2, 3 and 4).
| SCENARIO 1 | |||||||
|---|---|---|---|---|---|---|---|
| Passengers | 531 | (Pass/h) | |||||
| Modal Split | Pass/h | Conversion Factor | Veic/h | Equ-Veic | (Equ-Veic/h) | ||
| Private car | 58 | 308 | 1,6 | 192 | 1 | 192 | |
| Car rental with driver | 2,8 | 15 | 1,6 | 9 | 1 | 9 | |
| Car rental | 6 | 32 | 1,6 | 20 | 1 | 20 | |
| Taxi | 5 | 27 | 1,6 | 17 | 1 | 17 | |
| Shuttle from the hotel | 1,8 | 10 | 5 | 2 | 3 | 6 | |
| Other | 1,3 | 7 | 1,6 | 4 | 1 | 4 | |
| Bus rental | 2,1 | 11 | 40 | 0 | 3 | 1 | |
| Public bus | 23 | 122 | 30 | 4 | 3 | 12 | |
| Tot equ-veic/h | 262 | ||||||
| Equ-veic/h arriving/departing | 131 | ||||||
| SCENARIO 2 | |||||||
|---|---|---|---|---|---|---|---|
| 923 | (Pass/h) | ||||||
| Modal Split | Pass/h | Conversion Factor | Veic/h | Equ-Veic | (Equ-Veic/h) | ||
| Private car | 51 | 471 | 2 | 294 | 1 | 294 | |
| Car rental with driver | 2,8 | 26 | 2 | 16 | 1 | 16 | |
| Car rental | 6 | 55 | 2 | 35 | 1 | 35 | |
| Taxi | 5 | 46 | 2 | 29 | 1 | 29 | |
| Shuttle from the hotel | 1,8 | 17 | 5 | 3 | 3 | 10 | |
| Other | 1,3 | 12 | 2 | 7 | 1 | 7 | |
| Bus rental | 2,1 | 19 | 40 | 0 | 3 | 1 | |
| Public bus | 8 | 74 | 30 | 2 | 3 | 7 | |
| Metro | 22 | 203 | Tot equ-veic/h | 400 | |||
| Equ-veic/h arriving/departing | 200 | ||||||
| SCENARIO 3 | |||||||
|---|---|---|---|---|---|---|---|
| Passengers | 1708 | (Pass/h) | |||||
| Modal Split | Pass/h | Conversion Factor | Veic/h | Equ-veic | (EquVeic/h) | ||
| Car | 51 | 871 | 1,6 | 544 | 1 | 544 | |
| Rental car with driver | 2,8 | 48 | 1,6 | 30 | 1 | 30 | |
| Car rental | 6 | 102 | 1,6 | 64 | 1 | 64 | |
| Taxi | 5 | 85 | 1,6 | 53 | 1 | 53 | |
| Shuttle from the hotel | 1,8 | 31 | 5,0 | 6 | 3 | 18 | |
| Other | 1,3 | 22 | 1,6 | 14 | 1 | 14 | |
| Bus rental | 2,1 | 36 | 40,0 | 1 | 3 | 3 | |
| Public Bus | 8 | 137 | 30,0 | 5 | 3 | 14 | |
| Metro | 22 | 376 | Tot equ-veic/h | 740 | |||
| Equ-veic/h arriving/departing | 370 | ||||||
supply interaction and allow calculating the user flows and the performance of each element of the supply system.
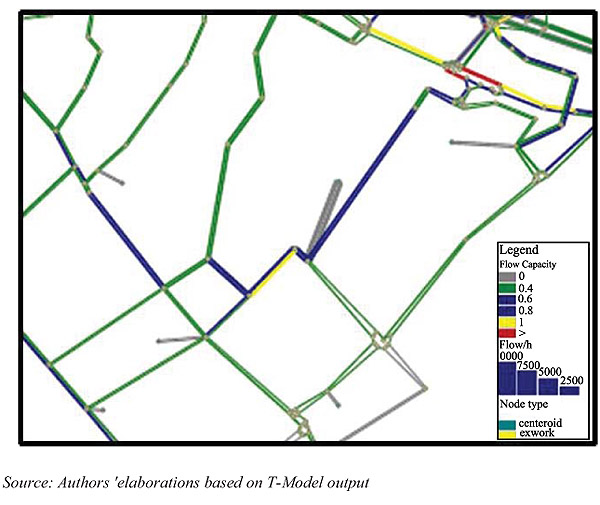
This simulation was carried out using the T-model macro-simulation software. In Scenario1, (medium term), the results of the macro-simulation can be viewed in Fig. (10) where the level of congestion is reported as well.
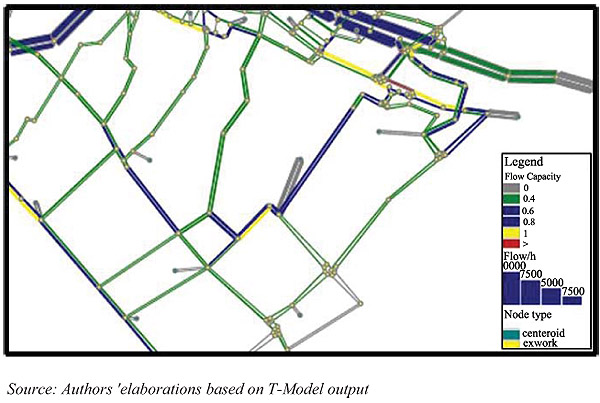
The results of the simulation in relation to Scenario 2 (long-term) with reference to the year 2035 are reported in Fig. (11).
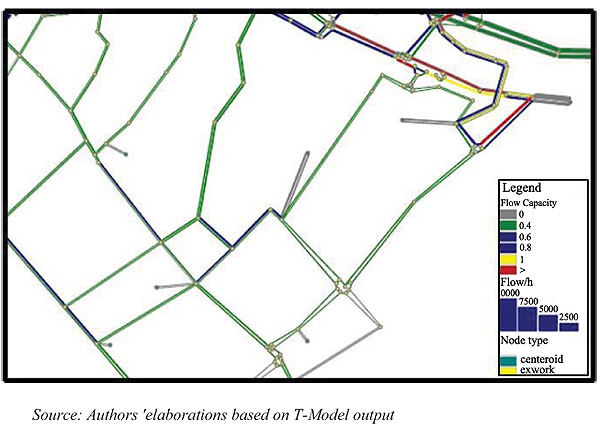
With reference to Scenario 3, relative to the maximum development of the airport, from the results reported in Fig. (12), it can be deduced that the proposed road is able to redistribute the flows allowing the system to work.
In order to complete the transport analysis, some performance indicators have been introduced. The comparison has been made on the basis of the road typology: motorway and urban roads reported in Table (5).
| Project scenario | Scenario 1 | Scenario 2 | Scenario 3 | |||
|---|---|---|---|---|---|---|
| Indicators | morning | evening | morning | evening | morning | evening |
| Tot km | 415251,7 | 435994,2 | 417544,8 | 428800,5 | 405732,9 | 444672,1 |
| Motorway | 53146,7 | 55886,0 | 53757,5 | 56780,1 | 54086,7 | 57619,0 |
| Urban roads | 362105,0 | 380108,1 | 363787,3 | 372020,4 | 351646,2 | 387053,1 |
| Tot travel time | 16038,4 | 15958,6 | 16118,6 | 16161,6 | 15363,7 | 16389,9 |
| Motorway | 494,3 | 543,4 | 501,9 | 548,7 | 505,8 | 569,4 |
| Urban roads | 15544,1 | 15415,1 | 15616,7 | 15612,8 | 14858,0 | 15820,5 |
| Average speed (km/h) | ||||||
| Motorway | 107,5 | 102,8 | 107,1 | 103,5 | 106,9 | 101,2 |
| Urban roads | 23,3 | 24,7 | 23,3 | 23,8 | 23,7 | 24,5 |
CONCLUSIONS
The accessibility to an infrastructure is a topic of debate at the international level and when the infrastructure is an airport the interest in increasing its access becomes even more important considering the impacts it can have at the regional level. The main conclusion of the proposed analysis carried out for the Salerno-Costa d'Amalfi airport is that the realization of the interventions will ensure: alternative paths for reaching the airport area, bringing significant benefits both to the direct flows to the airport and to those using the ordinary road network. Moreover, they will ensure a high level of service and a decrease in the vehicle density. The main consequence will be that the road network will be less congested and that the level of pollution will consequently decrease, even though this aspect has not been treated in the manuscript. Moreover, the functional organization of the forecourt area will ensure a satisfactory level for users arriving and departing from the airport itself.
Further research will investigate the impacts that the airport has on regional accessibility and on social development, comparing the airport use and the opinions of the residents. Moreover, an analysis of the impacts on the environment will be developed as well.
CONSENT FOR PUBLICATION
Not applicable.
CONFLICT OF INTEREST
The authors declare no conflict of interest, financial or otherwise.
ACKNOWLEDGEMENTS
Declared none..


