All published articles of this journal are available on ScienceDirect.

Effectiveness of Experimental Left-Turn Sign Usage in Terms of Crashes and Analyzing Severity of Left Turn Crashes in Alaska
Abstract
Background:
Ensuring safety in the roadways is one of the critical tasks as crashes generally bourgeoning rapidly all over the world. Because the turning movements of vehicles are important to motorist safety, Alaska Department of Transportation and Public Facilities (DOT & PF) experimented with left-turn traffic signs at six signalized intersections in the city of Anchorage, Alaska.
Objective:
The study aims at evaluating effectiveness of the left turn signs and analyze severity of left turning crashes.
Methods:
Preliminary statistical analysis and Binomial Logistic regression are applied for analyzing the data.
Results:
Preliminary analysis of before (1994-1998) and after (2005-2012) crash frequency data showed a reduction of crashes at four of the six intersections studied per 1000 entering vehicles. An analysis of crashes per year indicated that left-turn crashes at five intersections declined significantly after 2009, showing an improvement in safety. Pavement markings with signage were vitally important in contributing to improve compliance rates. Covering the pavement markings with snow and ice in Alaska for long periods signify the importance of installation of left turn signage to reduce crashes at studied intersections. Logistic regression analysis revealed that improper turn and lane usage, careless driving and angle type crashes were the most significant factors contributing to PDO crashes. Dry pavement conditions as well as almost all day except evening peak and off peak period influence PDO crashes in Alaska.
Conclusion:
Left-turn signs were effective in reducing crashes, and proper maintenance of road markings as well as driver awareness increased the effectiveness of signage and level of safety for left turning vehicles.
1. INTRODUCTION
The left-turn movement is one of the most common and essential turning behaviors of drivers in the United States and other countries. Improper lane usage and improper turning lead to accidents or crashes. Approximately 27% of all intersection crashes in the U.S. are associated with left turns, with over two-thirds of crashes occurring at signalized intersections [1]. According to the most recent Alaska crash data [2], 33% of 12,575 crashes were associated with turning movements, passing, or failure to yield. In addition, among all crashes listed in 2011, significant of 73.1% involved property damage only (PDO), and 0.5% led to fatalities [2]. Left-turn movements are associated with safety facts, and thus various control strategies have been implemented to address this particular issue [3]. Efficient and effective use of left-turn lanes may reduce congestion as well as crashes on roadways.
Based on the Manual on Uniform Traffic Control Devices [4], Alaska DOT&PF requested permission from the Federal Highway Administration (FHWA) to experiment with three new entry/exit dual left-turn-lane (DLTL) control signs for use at signalized intersections where dual left-turn movements turn into three or more receiving lanes. The Alaska DOT & PF Central Region Traffic and Safety Section designed the proposed signs to improve safety on signalized intersections with multiple left-turn lanes. In addition, three standard left-turn signs were posted. Research was conducted to investigate whether the use of a combination of the proposed DLTL signs and the standard signs improved safety or reduced vehicle crashes. The most common crash severity associated with left-turn movements was analyzed, and factors associated with that crash type were studied to further investigate the effectiveness of signs.
2. PROBLEM STATEMENT
Many intersections in Anchorage, Alaska, have dual left-turn lanes that turn into three or more receiving lanes. Typically, pavement markings are used to direct drivers turning left to the appropriate lane. However, in Alaska, as an example of a cold region environment, most pavement is covered by snow and ice during winter and spring. During these seasons, left-turn pavement markings alone are not an effective tool for guiding vehicles to their designated position when approaching an intersection, and as a result, turning crash rates increase. Left-turn signs can reduce left-turn crash rates by assisting drivers in choosing the proper departure and receiving lanes.
3. LITERATURE REVIEW
The left-turn movements of vehicles are an important safety consideration due to their contribution to crashes. Though no study has been done to measure the effectiveness of left-turn signs, studies related to traffic signs or accident analysis have been helpful in this study. The purpose of this literature review was to obtain a holistic understanding of studies involving traffic sign effectiveness measurement, to identify the trend of left-turn traffic vehicle movements and lane usage, to conduct an overview of the relationship between traffic signs and crashes (frequency and severity), and to determine a way of analyzing a particular type of crash severity. A study by the European Transport Safety Council [5] reported on the results of before-and-after analysis of new signage installation on Britain’s major road network. The study focused on a particular type of road section, and the outcome suggested that overall fatality rates decreased significantly, up to 87%, due to the installation of signs. The Bureau of Infrastructure, Transport and Regional Economics [6] in Australia focused on the improvement of 1,599 black spots (places where a predominant number of accidents occurred) in roadways from 1997-2003. The agency identified the traffic sign investigation as the best cost-benefit approach, because installation of traffic signs reduced fatal and PDO crashes by 30% and 26%, respectively. According to Pennel et al. [7], the use of road signs indicating on curve shows better results regarding decreasing severity and hazards on the roadways. In addition, participants were able to differentiate easily between different levels bend of severity with signs present, whereas participants could not differentiate easily between different levels of bend severity with signs absent. With signage, participants found maneuvering the bend easier, resulting in improved safety. Kay et al. [8] investigated the response of a new traffic sign named “Share the Road” on driver behavior during bicycle passing on a shared road. The respected research introduced factors such as a centerline rumble strip, vehicle type, bicyclist position, the presence of opposing traffic, and speed for measuring their effects on the buffer distance between the motorist and bicyclist. The before and after study used linear and logistic regression to note that the signs improved the buffer distance between motorist and bicyclist and reduce the average vehicle speed by about 2.5 mph [8]. Fu-lu et al. [9] identified a unique problem in China: motorists turning left turned their vehicle before reaching the stop line of signalized intersections, causing traffic conflicts and reducing traffic flow efficiency. For countermeasures of this, researchers moved the stop line back while considering geometric features, design vehicles, queuing theory, and traffic wave theories.
According to a report by the American Traffic Safety Services Association [10], sign and pavement markings are low-cost local road safety solutions. There was a significant reduction in crashes (42%) on the road studied during 1992-1998. Crash severity analysis suggested a decrease in fatalities and severe injuries by 61% and 42%, respectively. Chovan et al. [11] analyzed 154 left-turn-across-path crashes at intersections and found that 49% of total accidents were caused by unaware drivers, and 39% occurred due to drivers misjudging the gaps or velocities of opposing vehicles. Moreover, this particular research identified two types of crashes. The predominant type of crash (71.6%) involved the slowing, but not stopping, of vehicles while approaching an intersection, which resulted in a collision. While in another type of crash (28.4%) involved a motorist first stopping at an intersection, then proceeding, resulting in a crash. According to Blincoe et al. [12], in 2010, $242 billion in crash damage was recorded in the U.S., where 32,999 people were killed, 3.9 million were injured, and 24 million vehicles were damaged. In addition, the $242 billion was equivalent to nearly $784 for each of the 308.7 million people living in the U.S., and made up 1.6% of the $14.96 trillion real U.S. gross domestic product for 2010. The total societal cost in 2010 due to motor vehicle crashes was about $836 billion. Dissanayake and Roy [13] analyzed the severity of accidents involving single vehicles running off the road during 2004-2008 in Kansas. Three different binary logistic regression models were developed based on crash severity, where the model for fatal or incapacitating injury crashes performed better at measuring crash severity. In the respective study, 43 explanatory variables were used, categorized in 5 different groups: driver, vehicle, road, crash, and environment. Overall, 20 variables appeared to significantly influence all types of crashes that involved running off the road. Chen et al. [14] used binary logistic regression to analyze the data of crashes occurring at different intersections. Seven risk factors-driver age, driver gender, speed zone, traffic control type, time of day, crash type, and seat belt usage-were found to be significant contributors to crash severity. The study demonstrated that fatal crashes occurred between midnight and early morning at 100 km/hr speed zones with no traffic control, and that young and old-aged drivers were more prone to this particular type of severity than middle-aged drivers. In addition, intersection crashes involving pedestrians or drivers not wearing seat belts were more likely to be fatal. Renuraj et al. [15] focused on measuring factors influencing severity of crashes by using binary logistic regression at Jaffna, Sri Lanka. Different factors associated with crash severity, such as time, location, type of vehicle, gender, license status, and cause and type of accident, were taken into consideration. The statistical analysis in that research suggested that type of vehicle and age were the most significant contributing factors for crash severity. Berkessa [16] identified responsible factors related to traffic injury severity in Addis Ababa, Ethiopia, by utilizing multinomial logistic regression. The resultant model highlighted that driver’s age, educational status, and experience, along with vehicle type and road topography, were strongly correlated with crash severity. The model also showed that the probability of property damage and severe injury was significantly higher than the probability of minor injury.
In summary, before-and-after crash frequency analysis has been shown to be a useful way to measure the effectiveness of a particular sign installation. In addition, driver compliance rate with the sign posted at intersections might be an ideal way to gather a comprehensive view of left-turn-lane usage, sharing the lanes, and particularly the effectiveness of the posted sign. Logistic regression is a familiar analysis method to analyze crash severity in such cases. Thus, binary logistic regression analysis may be useful in determining the factors related to this particular crash severity, which can then be used to improve the effectiveness of a particular sign.
4. PROPOSED SIGNAGE
Experimental entry/exit Dual Left-Turn Lane (DLTL) signs have been used on a limited basis in Anchorage since spring 2000. Additional DLTL signs were deployed in fall 2005, for a total of three experimental and three standard signs at different signalized intersections. The Alaska DOT & PF provided crash data for six signalized intersections in Anchorage city where left-turn signs were posted. The before and after periods of sign installation are 1994-1998 and 2005-2012, respectively. The six intersections studied in Anchorage are listed in Table 1.
| Intersection | Left-Turn Sign Layout |
|---|---|
| 5th Ave. & A Street | Standard |
| 5th Ave. & Gambell Street | Experimental |
| Benson Blvd. & C Street | Experimental |
| Benson Blvd. & Seward Highway | Standard |
| Northern Lights Blvd. & C Street | Standard |
| Tudor Road. & Minnesota Drive | Experimental |
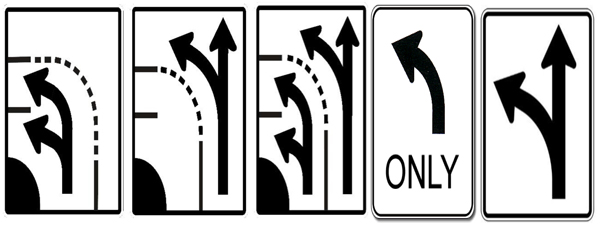
Three entry/exit dual lane use control signs were designed: two for overhead installation (Fig. 1), (first and second sign from the left) and one for post-mounting at the side of the road (Fig. 1), (third sign from the left). On all signs, the rightmost left-turn lane may be shown as either a mandatory left or an optional left/through (Fig. 1), (rightmost sign). These proposed signs would reinforce the requirement that a motorist turning left from the leftmost lane must turn into either the first or the second lane from the left, and that the driver in the rightmost lane must turn into the third lane or lanes to the right of it.
5. SCOPE OF THE STUDY
The research was divided into three parts: analysis of crashes during both the before-and-after periods, measurement of the compliance rate of left turning traffic at the studied six signalized intersections, and identification as well as statistical analysis of crash severity for vehicles turning left at those intersections.
In the first part of this study, detailed analysis of crash data and AADT (Annual Average Daily Traffic) of before and after periods of six intersections was conducted. Left-turn crashes were taken into account where either both vehicles were turning left, or only one vehicle was turning left and the other was through traffic. Crash analysis considered annual crashes and AADT fluctuations over multiple years. The study’s second part included video analysis to determine the rate of compliance with posted signs, and its third part involved binomial logistic regression analysis of PDO crashes to determine contributing factors.
6. METHODOLOGY
The first portion of the effectiveness analysis was to perform crash analysis at the studied six signalized intersections. Detailed crash data were collected from Alaska DOT & PF, and left-turn crashes at the studied intersections were identified. The data were sorted and analyzed in terms of AADT and crash severity.
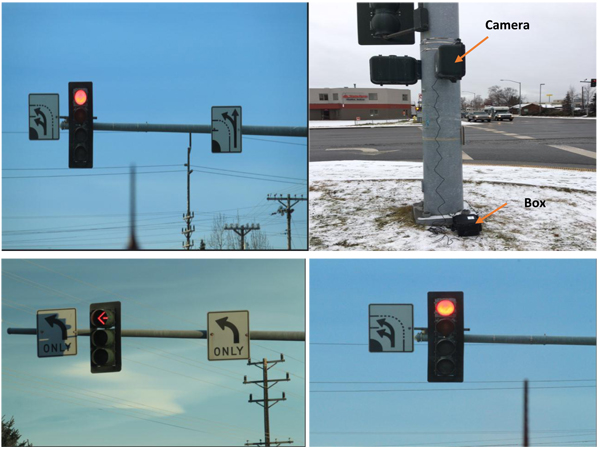
The second portion of the effectiveness analysis focused on the compliance rate of left turning traffic at the studied signalized intersections using video analysis. The University of Alaska Anchorage Research Team mounted traffic cameras next to the traffic pole at each intersection, and video data were collected for 1 month. The traffic cameras were angled at each intersection to focus solely on vehicles entering left turn lanes and continuing to either two or three receiving lanes. The pole-mounted PATH-DRS-4R (Fig. 2) collected traffic data. A tall ladder was propped next to the traffic pole at each intersection to fix the traffic data collector and cameras in a way that would best capture the view of left turning traffic. The traffic collection box was strapped closer to the base of the pole with metal bands. Above the traffic collection box, a traffic camera was mounted near the top of the ladder to the pole by a single metal band to get the widest possible angle. White cable conduits protected the camera cable running from the top of the traffic collection box to the bottom of the camera. Videos recorded in 2-hour segments during peak traffic hours-7 a.m. to 9 a.m., 12 p.m. to 2 p.m., and 3 p.m. to 5 p.m. at each of the intersections, and afterwards, analysis of the compliance rate was conducted. Fig. (2) presents the left turn signage at two of the studied intersections.
The third portion of the study consisted of statistical analysis of crash severity, since worldwide, this tool is considered effective for identifying responsible risk factors associated with a particular type of crash severity. The previously mentioned crash analysis by Alaska DOT & PF [2] provided a general scenario of excessive PDO crashes at the roadways thus justified to analyze more in depth regarding the particular type (PDO) for left turning movements at intersections as well. Moreover, the crash severity analysis of recent data gave information regarding responsible risk factors that were still present in influencing left-turn crashes at intersections. Binary logistic regression was used to analyze the responsible factors related to PDO crashes as the predominant amount of crashes signifying PDO. From the detailed crash information provided by Alaska DOT & PF-that is, time of day, day of the week (weekday or weekend), crash type (vehicles, fixed objects, pedestrians, bicycles), crash severity, road surface condition, lighting conditions, and cause of accidents (reasons for left-turn crashes that took place)- data were gathered and taken into consideration for PDO crash severity analysis.
The Binary Logistic Regression (BLR) model is one of the most familiar statistical methods for analyzing a binary categorical response variable [17, 18]. For measuring traffic accident risk factors, different studies used this type of regression, where dependent variables were considered to be binary [19-21]. Binary logistic regression is an authentic tool to test the association of a dependent variable with an independent variable [21]. For this research, BLR is appropriate to depict severity type PDO (Y=1) or other non PDO crashes (Y=0) as a binary response variable. Equation 1 gives the model.
 |
(1) |
Where,
P (Y = 1) describes the probability of occurring PDO
xi represents the independent variable
βi is the model co-efficient that describes the odd ratio involved in the accident type
Before applying the model, Pearson correlation co-efficient at 95% confidence interval was drawn to find out the association of independent variables with the dependent (PDO) one. In addition, a multicollinearity test was done to check the existence of association between explanatory variables [22]. According to Allison [23], multicollinearity does not bias the coefficient, but does make it more unstable. According to Renuraj et al. [15], the Hosmer and Lemeshow goodness of fit test was used to identify whether the model acceptably fit the data or not. This test computes a Chi-square from observed and expected frequency, and then computes a probability value from this Chi-square distribution to test the fit of the logistic model. A test statistic greater than 0.05 for Hosmer Lameshow test signifies that the model acceptably fits the data.
7. DATA ANALYSIS AND RESULTS
A crash analysis was done to evaluate the effectiveness of left-turn sign use at the studied signalized intersections in Anchorage. The results show that the average number of annual left-turn crashes decreased at three of the intersections, while an increase was observed at the other three intersections. One of the intersections Seward Highway and Benson Boulevard showed a significant increase (4.2 average annual left-turn crashes to 9.3 average annual left-turn crashes) with an overall increase in the number of crashes as well. The AADT was used to measure left-turn crashes per 1000 left-turning vehicles per intersection. As shown in Table 2, left-turn crashes increased in approach from Benson Boulevard to Seward Highway and from Tudor Road to Minnesota Drive. On all other intersections and approaches, crashes due to left turns decreased. As a result, four treated sites - two with standard signs and two with experimental signs performed better with significantly fewer left-turn related crashes after sign installation.
| Intersection | Approach | Crash Data from 1994–1998 | Crash Data from 2005–2012 | ||||||
|---|---|---|---|---|---|---|---|---|---|
| Total # of Crashes | # of Left-Turn Crashes | Average # of Left-Turn Crashes Per Year | Average # of Left-Turn Crashes Per 1000 Vehicles Per Year | Total # of Crashes | # of Left-Turn Crashes | Average # of Left-Turn Crashes Per Year | Average # of Left-Turn Crashes per 1000 Vehicles Per Year | ||
| 5th Ave. & Gambell St. | WB* | 88 | 20 | 4 | 0.05 | 101 | 26 | 3.25 | 0.021 |
| C St. & Benson Blvd. | SB** | 135 | 21 | 4.2 | 0.049 | 140 | 35 | 4.4 | 0.028 |
| A St. & 5th Ave. | NB*** | 86 | 12 | 2.4 | 0.044 | 62 | 14 | 1.75 | 0.022 |
| Northern Lights Blvd. & C St. | WB | 110 | 13 | 2.6 | 0.021 | 117 | 19 | 2.375 | 0.013 |
| Seward Hwy. & Benson Blvd. | EB**** | 208 | 21 | 4.2 | 0.04 | 360 | 73 | 9.13 | 0.054 |
| Minnesota Dr. & Tudor | SB | 152 | 7 | 1 | 0.055 | 148 | 13 | 1.63 | 0.073 |
The detailed crash data after installation of left-turn signs give a perspective on changes within crash patterns in terms of years passed. Fig. (3) presents annual left-turn crash data for six intersections from 2005-2012, where 180 left-turn related crashes were recorded. After installation of the left-turn signs at each of the designated intersections in 2005, left-turn crashes increased over a 1 or 2-year period, except at A Street and 5th Avenue, and at 5th Avenue and Gambell Street. The respective one to two-years period after sign installation may have been taken by the drivers for adaptability with the installed new sign. Following this period, however, these intersections also showed a reduction in left-turn related crashes. Though there was some differential fluctuation of crashes rates during 2005-2009, the rate of left-turn crashes significantly decreased after 2009, with the exception of one intersection (Benson Boulevard and Seward Highway).
Fig. (4) gives left-turn AADT per year per intersection. Comparing this data with the data presented in Fig. (3) yielded helpful results. For 5th Avenue and Gambell Street, the lowest AADT and the highest number of left-turn crashes were recorded during 2008, as continuous decrease of AADT was recorded from 2006 to 2008. The AADT began to increase at this intersection following 2008. Benson Boulevard and Seward Highway experienced an abrupt pattern of decrease in AADT from 2005-2006 and from 2010-2011, thus a significant increase in left-turn crash rate at these times. All other intersections showed an increase in left-turn crash rate when continuous or abrupt decreases in AADT were identified.
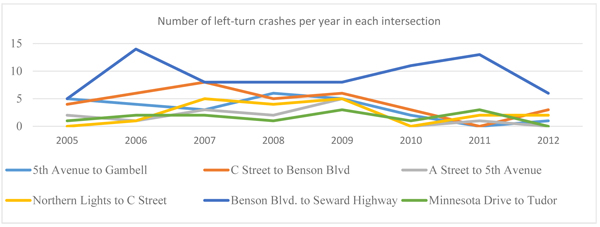
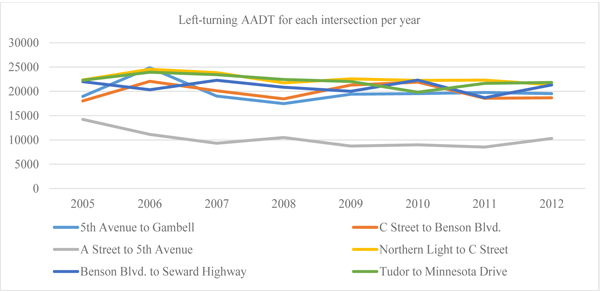
Table 3 presents the compliance rate for intersections, measured through video analysis for 1 month during a particular period.
| Intersection | Left-Turn Sign Layout | Compliance Rate | Rank |
|---|---|---|---|
| Northern Lights Blvd. & C St. | Standard | 100% | 1 |
| Minnesota Dr. & Tudor Rd. | Experimental | 98.3% | 2 |
| 5th Ave. & Gambell St. | Experimental | 95.6% | 3 |
| Seward Hwy. & Benson Blvd. | Standard | 94.6% | 4 |
| A St. & 5th Ave. | Standard | 92.6% | 5 |
| C St. & Benson Blvd. | Experimental | 89.5% | 6 |
Compliance rates were measured through observation of drivers turning through intersections from their departure lane and into the designated receiving lane. From video observation, it was found that the rightmost turning vehicles had the highest rates of incompliance. Both standard and experimental sign intersections performed better in terms of compliance rate (compliance rate greater than 90%), except for at C Street and Benson Boulevard (compliance rate of 89.5%). Moreover, pavement markings significantly influenced turning and placement of left turning vehicles. If pavement markings were freshly painted, as were at Northern Lights Boulevard and C Street during the time that field observations took place, followed by the new signs, rate of compliance observed as 100% for this intersection. But compared with other intersections, such as C Street and Benson Boulevard with its previously mentioned compliance rate of 89.5%, the lowest overall compliance rate, where pavement markings were worn out or completely missing in some places. If comparisons are made between crash rate and compliance rate, it can be shown that the higher the compliance rate, the lower the crash rate. The intersection of Northern Lights Boulevard and C Street had the highest number of repeated pavement markings maintenance recorded, and was ranked number 1 in compliance rate; it also experienced the lowest left-turn crash rate, 0.013 crashes per 1000 entering vehicles, during the “after” period (2005-2012) of sign installation. This data showed that pavement markings have a significant impact on the effectiveness of traffic signs, and thus are significant in ensuring the safety of left turning vehicles as well.
Fig. (5) presents the severity of crashes at each of the intersections studied to identify the predominant severity type occurring at those intersections. For the present study, PDO crashes were dominated at each intersection accounted for around 80% among all registered crash type. It seems like the higher number of PDO in each intersections supporting the report which was presented by the Alaskan crash data [2]. One fatality and several major injury crashes were observed at Tudor Road and Minnesota Drive. Most of the intersections experienced a low rate of major injury and fatal accidents due to left turning vehicles. Moreover, minor injury crashes were observed at much lower rates than PDO crashes at each of the intersections.
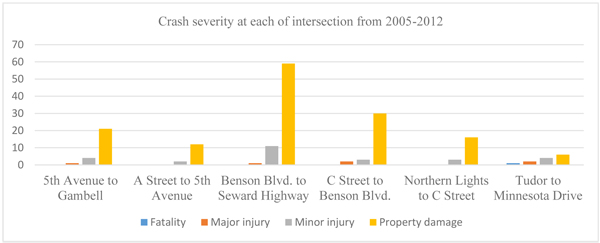
Left-turn crashes were reduced at four of the studied intersections, but two intersections-Seward Highway and Benson Boulevard and Minnesota Drive and Tudor Road-experienced a higher number of crashes per 1000 entering vehicles during the “after” period when compared with the “before” period. As previously mentioned, PDO crashes have been dominant in Alaska (Alaska DOT & PF 2015), and this investigation found the same for left-turn crashes in the intersections studied as well. Most crashes in the post-sign-installation period, 2005 - 2012, were the PDO type (144 out of 180 overall crashes). As a result, to improve the effectiveness of left-turn signs, this severity type should be given particular attention.
Data for 180 left-turn crashes were analyzed, and each severity type was sorted in terms of time of day, day of the week, crash type, crash severity, road surface condition, lighting condition, and cause of accidents. A breakdown of this data is presented in Table 4.
| Variables | Category | Number of Occurrences | Marginal Percentage |
|---|---|---|---|
| Crash severity | PDO | 144 | 80 |
| Minor injury | 30 | 16.67 | |
| Fatal & major injury | 6 | 3.333 | |
| Time of day | Evening & early morning (6:30 p.m. – 6.30 a.m.) | 47 | 26.1 |
| Morning off-peak & peak (6:30 a.m. – 12:00 p.m.) | 39 | 21.7 | |
| Afternoon off-peak & peak (12:00 p.m. – 6:30 p.m.) | 94 | 52.2 | |
| Day of the week | Weekday | 137 | 76.1 |
| Weekend | 43 | 23.9 | |
| Crash type | Vehicles | 162 | 90 |
| Fixed objects, pedestrians, or bicycles | 18 | 10 | |
| Type of collision | Angle | 141 | 78.3 |
| Rear-end and side-swipe | 31 | 17.2 | |
| Run off and overturn | 8 | 4.4 | |
| Road surface condition | Dry | 99 | 55 |
| Wet, snowy, or icy | 81 | 45 | |
| Lighting condition | Daylight | 130 | 72.2 |
| Dark | 50 | 27.8 | |
| Causes of crashes | Careless driving | 57 | 31.67 |
| Driving while intoxicated | 14 | 7.8 | |
| Failure to stop for traffic control device | 31 | 17.22 | |
| Improper turn & lane usage | 54 | 30 | |
| Unsafe speed | 24 | 13.33 |
Before approaching towards Logistic regression, Pearson correlation coefficient was utilized to identify most influential parameters to accelerate left turn PDO crashes in Anchorage from overall variables taken into consideration. Among the independent variables taken into account, time of the day, crash type, type of collision, road surface condition and causes of crashes seemed statistically suitable (p <0.05) variables to consider into for analyzing PDO type crashes (Table 5). Binary logistic regression analysis was used to find the associated risk factor (in each of selected classes of variable among the significant one drawn from Pearson correlation co-efficient test) related to PDO crashes. Before fitting the model, a multicollinearity test was done using SPSS Statistical Package. SPSS statistical package of 23 [24] is being used for analyzing variables taken into consideration for Binary Logistic Regression. Checking the Variance Inflation Factors (VIF) by adding one or removing another risk factor ensured no presence of multicollinearity. It was concluded that no multicollinearity exist after considering selected independent variables from the Pearson co-relation co-efficient test. A goodness of fit test, related to the logistic regression model, was run, and the results to identify the validity of the model are shown in Table 6.
| Variables | Co-efficient | P Value |
|---|---|---|
| Time of day | 9.134 | 0.041 |
| Day of the week | 7.562 | 0.183 |
| Crash type | 5.616 | 0.259 |
| Type of collision | 9.839 | 0.028 |
| Road surface condition | 9.446 | 0.034 |
| Lighting condition | 4.113 | 0.545 |
| Causes of crashes | 13.771 | 0.000 |
| Goodness of Fit Type | Value | Degree of Freedom | P Value |
|---|---|---|---|
| Hosmer and Lemeshow test | 4.801 | 8 | 0.79 |
The Hosmer and Lemeshow test identified that Chi square = 4.801, and the p-value (sig.) is significantly greater than 0.05, thus proving the model to be well fitted. Table 7 presents a summary of the statistics of the logistic regression model.
In this study, all the factors influencing PDO crashes are categorical variables. Table 7 shows that afternoon off-peak and peak hours (p = 0.044), Angle type crashes (p = 0.040), wet, snowy, and icy conditions (p = 0.042), careless driving (p = 0.031) and Improper turn and lane usage (p = 0.004) are significant to PDO crashes, with each indicating a p value of less than 0.05. P values less than 0.05 considered statistical significant contributor to the model itself [15, 20, 22]. Thus, all the statistically significant contributor of left turn PDO crashes are taken into consideration. Table (7) also shows improper turn and lane usage has the highest value of Exp (B) along with lowest p value among all, indicating it is the most influential factor to PDO crashes. In addition, careless driving, and Angle type crashes also positively contributing to PDO crashes with having p value less than 0.05 and higher Exp (B) value around 12. The careless driving variable documented in this study consisted mainly of cell phone use or a driver occupied with vehicle accessories when the crash occurred. Moreover, wet, snowy, and icy conditions and afternoon off peak and peak hours are negatively (B value negative) correlated with PDO crashes. Though, the study was conducted in Alaska where wet conditions (rain, snow, and ice) are predominantly recorded throughout the year but initial perception dictates rain, snow, and ice might be the cause of crashes, while statistics supporting towards dry condition for most PDO crashes. This is valid because in summer the traffic predominantly increases in the roadways of Alaska due to favorable weather and incoming of tourist. Moreover, drivers are seemed to be more conscious in encountering wet, snow and ice pavement condition rather than dry. Thus, more PDO crashes are becoming familiar in dry condition as well. This analysis highlights that afternoon off-peak hour (time of day), from 12:00 p.m. to 6:30 p.m., is a more vulnerable period for non-occurrence of PDO crashes with respect to others. From the analysis, it is also identified that fail to stop for traffic control device and unsafe speed are not significantly co-related (p value greater than 0.05) with PDO left turn crashes in Anchorage.
| Variable | B | S.E | Wald | P Value | Exp(B) |
|---|---|---|---|---|---|
| Evening & early morning | -0.333 | 0.866 | 0.147 | 0.701 | 0.717 |
| Morning off-peak & peak | -0.447 | 0.771 | 0.336 | 0.562 | 0.640 |
| Afternoon off-peak & peak | -1.237 | 0.603 | 4.003 | 0.044 | 0.290 |
| Angle | 2.498 | 1.161 | 4.497 | 0.040 | 12.158 |
| Rear-end and side-swap | 1.138 | 1.519 | 0.560 | 0.454 | 3.119 |
| Run off and overturn | -0.305 | 0.463 | 0.434 | 0.510 | 0.737 |
| Dry | -0.702 | 0.495 | 2.015 | 0.156 | 0.496 |
| Wet, snowy, and icy | -1.289 | 0.634 | 4.134 | 0.042 | 0.275 |
| Careless driving | 2.526 | 1.174 | 4.626 | 0.031 | 12.497 |
| Driving while in toxic | -0.165 | 1.310 | 0.016 | 0.900 | 0.848 |
| Fail to stop for traffic control device | 0.437 | 0.626 | 0.488 | 0.485 | 1.158 |
| Improper turn & lane usage | 2.631 | 1.213 | 4.881 | 0.004 | 13.89 |
| Unsafe speed | 0.611 | 0.584 | 1.094 | 0.295 | 1.842 |
| Constant | -5.243 | 6.070 | 0.746 | 0.388 | 0.005 |
CONCLUSIONS AND RECOMMENDATIONS
This study attempted to identify the effectiveness of double left-turn signs placed at six intersections in Anchorage, Alaska. The research showed various phenomena that significantly affect safety, and which were enhanced by left-turn signs. Crash frequency and severity were considered the most important phenomenon in identifying the effectiveness of the signs. Left-turn crash frequency, with respect to 1000 entering vehicles, was reduced at four of the six intersections after sign installation. More detailed year-wise crash frequency analysis indicated a reduction of left turn crashes more than 4 among all studied intersections except one after the year 2009. Only one intersection, Benson Boulevard and Seward Highway, experienced a significant increase in the number of left-turn accidents, in terms of both AADT and year-wise crash rates. In measuring driver compliance rate with left-turn signs, it was noted that rightmost left-turning vehicles had the highest noncompliance rate. In addition, pavement markings were found to positively influence the effectiveness of the left-turn sign compliance rate. However, in a cold region like Alaska where roads are covered by snow and ice a large part of the year, the visibility of pavement markings becomes an issue.
Property damage only crashes were the predominant crash type at every intersection; thus, binomial logistic regression analysis was carried out to identify the specific risk factors contributing to left-turn crash severity. The analysis showed afternoon peak and off-peak hours, and wet, snowy and icy conditions usually influence other sorts of severity in comparison to PDO. On the other hand, improper turn and lane usage, careless driving and angle crashes were found most crucial features to influence PDO crash type of left turning vehicles in Alaska.
Use of left-turn traffic signs is a key safety benefit in avoiding left-turn crashes at intersections. In a cold region like Alaska, frequent maintenance of pavement markings will both increase compliance rates with the signs and reduce crash frequency. Utilization of left turning traffic signs with proper pavement marking will guide the drivers more accurately and successfully turn to designation lanes. Driver awareness of the risks of cell phone use while driving should be raised. Avoiding cell phone use while driving could significantly reduce PDO crashes. In addition, careful left turning in general by drivers, particularly during morning peak and off peak hours and night hours will help to ensure the avoidance of left turn crashes.
CONSENT FOR PUBLICATION
Not applicable.
CONFLICT OF INTEREST
The authors declare no conflict of interest, financial or otherwise.
ACKNOWLEDGEMENTS
Special thanks to the Department of Civil Engineering, UAA (University of Alaska Anchorage) for overall help and providing all the required facilities. All of the work was performed under the general supervision of Professor Abaza. Thanks to Alaska Department of Transportation and Public Facilities (AKDOT & PF) for providing assistance regarding placing the camera over the six studied intersections for collecting data and also helping with proving crash data as well.

