All published articles of this journal are available on ScienceDirect.

A Study on the Merits for Coordinated Use of Ramp Metering and Variable Speed Limit Traffic Control Systems
Abstract
Aim:
The aim of this research was to investigate the merits for further improvements of traffic operation on freeways and expressways through coordinated use of Ramp Metering and Variable Speed limit (VSL) control systems.
Methods:
In this research, the widely used ALINEA Ramp Metering strategy was coordinated with a rule-based VSL strategy so that the total flow entered from the upstream freeway and entry ramp is maintained below the merge downstream capacity. The developed algorithm was then examined on a freeway network comprising two merge and one diverge sections, using VISSIM microscopic simulation model. The performance of the simulated network was examined under three scenarios namely, No-control, Ramp Metering only and Ramp Metering plus VSL controls. The network performance under each scenario was then assessed and compared using three measures of performance namely, average travel time, overall delay and freeway throughput. The ANOVA test was used to analyze and compare the impacts of specified scenarios.
Results:
The results indicated that the best performance is achieved under coordinated Ramp Metering plus VSL scenario as it produced a significantly better performance in comparison with the other two scenarios.
Conclusion:
The results can be attributed to the synergistic effects of coordinated and integrated use of these control systems on the freeway network and therefore, coordination of such systems is recommended.
1. INTRODUCTION
Freeways and expressways around the world are commonly suffering from general problems of congestion, poor safety and high environmental impacts. In order to reduce traffic congestion and to improve safety on freeways and expressways, it is necessary to implement robust, integrated and coordinated control systems. Various traffic management and control systems such as Ramp Metering (RM) and Variable Speed Limit (VSL) control systems have been proposed and implemented to address these issues. Each one of these systems intend to achieve specific objectives which may or may not be consistent with the objectives set for other control measures deployed in the same freeway or expressway area.
Coordinated use of RM and VSL strategies is one step to resolve this issue. The synergistic effects of such integration and coordination may increase the benefits expected from the implementation of these control strategies in comparison to the situations where they are used as stand-alone systems. However, there is not enough evidence on the scale of changes that we should expect from such coordination e.g. how this coordination may affect traffic operation.
A range of RM systems based on feedback philosophy and automatic control theory [1-3] and artificial intelligence techniques [4-7] have been developed. Many of these systems have been implemented as stand-alone system for an isolated entry ramp or as a coordinated system for several consecutive entry ramps on a freeway network. Among these algorithms, ALINEA strategy developed by Papageorgiou et al. [1] is the most widely used RM system worldwide.
Also, a range of VSL control systems based on theoretical methods [8-13], practical methods [14-18] or knowledge based methods [6, 19] have been proposed. Practical methods, based on simple rule-based heuristics, have largely been used in the implemented systems worldwide.
However, a coordinated use of these two control systems has not been experienced anywhere in practice. The studies conducted on this subject have mainly been based on theoretical and macroscopic simulation studies. In these studies, an extension of METANET macroscopic simulation model has largely been used to reflect the impacts of VSL on mainstream traffic flow. A known RM strategy such as ALINEA is then combined with the traffic model. The performance of the proposed control strategy is then tested on a freeway infrastructure comprising several entry ramps. Various measures of performance are used in these studies to compare the performance of the integrated control with VSL only, RM only and no-control scenarios. The results of such studies have generally indicated that the combined scenario has demonstrated an improved performance in comparison with the other scenarios [20-22].
In recent years, the microscopic simulation modelling approach has also been used to investigate the impacts of combined use of RM and VSL strategies by a few researchers [23-26].
Review of previous research indicated that although this area has received some attention in recent years but these studies have mainly relied on macroscopic traffic flow modelling. Despite being complex and computationally intense, interactions and dynamics of traffic flow may not properly be represented in such level of modelling. Furthermore, in the studies based on microscopic simulation modelling approach, only the combined application of these two control measures has been examined (i.e. when both independent strategies are activated). This would suggest that further investigations are needed to consider the impacts of coordinated use of these two control systems.
Thus, the main objective of this research was to explore further, the merits for coordinated use of conventional RM and VSL strategies, i.e. ALINEA and a rule-based VSL strategy, using a microscopic simulation model. These conventional strategies were selected in this study as they have already been tested in practice and their individual influence on traffic operation is known. VISSIM 5.0 microscopic simulation model [27] was selected for this study as it has widely been used in academic researches and also in traffic studies and it has been recognized as a powerful and reliable tool for such studies.
2. RESEARCH METHODOLOGY
2.1. Development of a Logic for Coordinated RM and VSL Strategies
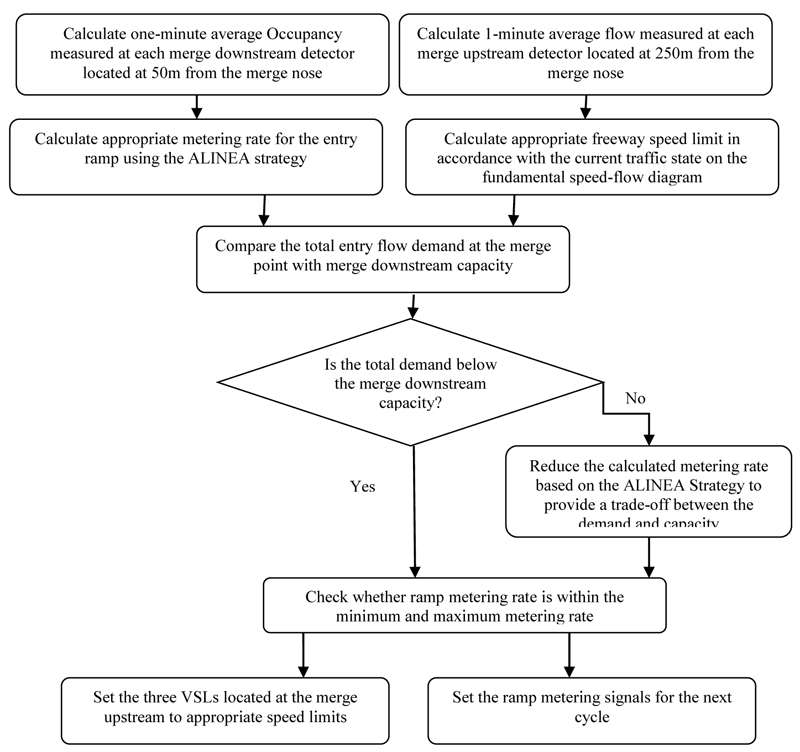
The coordinated ramp metering and VSL strategy developed in this research was designed in such a way to provide a closed control loop in the merge area. In this coordinated arrangement, both ramp metering and VSL strategies regulate the entry of ramp and mainline traffic to the merge area so that the total traffic flow at merge downstream is always below its capacity.
The coordinated ramp metering and VSL strategy is established as follows:
- − The current mainline traffic condition at the merge area is determined using the information provided by the loop detectors installed on the mainline at the merge area. Subsequently, the appropriate speed limit is determined based on the traffic state and is set on the mandatory Variable Message Signs installed on the mainline at 500 meters intervals along 1.5 kilometers of each merge upstream.
- − The appropriate metering rate for each entry ramp is calculated and updated using the ALINEA strategy
- − The combined upstream mainline and the entry ramp traffic flow is calculated and compared with mainline downstream capacity at the merge area. The mainline downstream capacity was assumed as 2400 pcphpl (passenger car per hour per lane) in accordance with the Highway Capacity Manual Guide [28].
- − If total flow exceeds downstream capacity, the entry ramp traffic is reduced accordingly to provide the balance. However, a minimum entry ramp traffic (i.e. 480 vph) is always preserved to prevent excessive queues on the ramp spillback to its upstream junction. Each entry ramp is independently treated in the model such that when the nearby downstream capacity for each entry ramp is reached, its corresponding entry ramp flow is reduced.
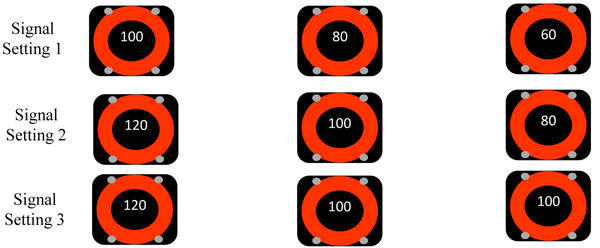
The flow chart shown in Fig. (1) summarizes the process involved. The signal settings used for VSLs are indicated in Fig. (2).
2.2. Define the Developed Strategy within a Microscopic Simulation Model
2.2.1. Introduction to VISSIM
VISSIM software was used in this study as it has widely been used to simulate various needs in the field of traffic analysis [29-32]. VISSIM is a discrete, stochastic, time step based microscopic traffic simulation program developed to analyze traffic and transit operations. VISSIM uses the psycho-physical driver behavior model based on the continued work of Wiedemann [33, 34]. The basic idea of this model is stochastic perceptual thresholds which replicates individual driver characteristics.
2.2.2. Coding of the Ramp Metering and VSL Signal Control
IN VISSIM, ramp metering can be modelled either using the built-in fixed-time control or an optional external signal state generator. Metered on-ramps in real world are usually operated by traffic-responsive control. The operation time of a metered on-ramp varies from place to place. Also, it may follow the platoon metering or not. Traffic actuated signal controls can be simulated in VISSIM by the external signal state generator (VAP or other external program). VAP (Vehicle Actuated Programming) is an optional add-on module of VISSIM for the simulation of programmable, phase or stage based, traffic actuated signal controls [35]. This module is programmable with a simple descriptive language. It receives detector variables, interprets control logics, and creates signal commands on a discrete time step basis.
Using these features, VAP module was used in this research to develop and implement ALINEA ramp metering and VSL algorithms in a coordinated manner in the simulation model. The details of coding used for the ramp metering and coordinated ramp metering and VSL control strategies using VAP facility in this research are presented in the Appendix A and Appendix B, respectively.
2.2.3. Model Calibration and Validation
The developed simulation model was calibrated and then validated using a number evaluation means including:
- − Visual inspection of traffic operation throughout the defined freeway network especially around merge and diverge area;
- − Comparison of the mainline traffic flow at a number of detection points with the net flow entered the freeway network before each point;
- − Control the lane changing, lane utilization and gap acceptance behavior of traffic throughout the network;
- − Control the signal commands set by the ramp metering and VSL strategies at different traffic states;
- − Control the performance of the network under no-control and only ramp metering strategies for similar conditions for which the real performance data is available.
2.3. Examine the Performance of the Developed System under a Number of Scenarios
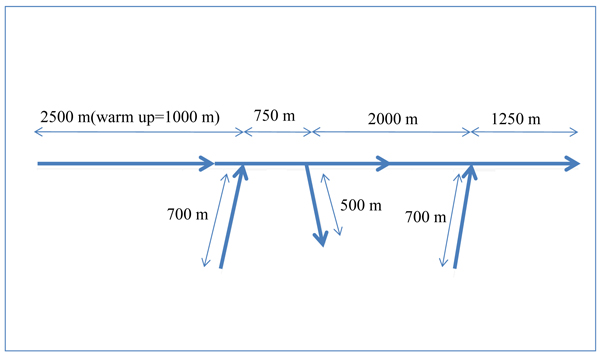
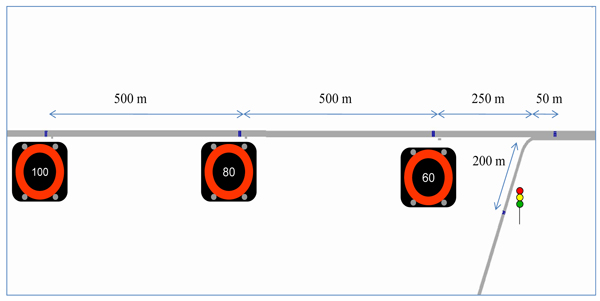
In order to examine the performance of the developed coordinated RM and VSL strategies, a 4-lane freeway section comprising two merge and one diverge section, shown in Figs. (3 and 4), was defined in the VISSIM.
As indicated in Fig. (4), the detectors related to the ALINEA ramp metering control strategy were defined at 50 meters downstream of each entry ramp’s nose. The detectors related to the VSL control strategy were defined at 250, 750 and 1250 meters upstream of each entry ramp’s nose.
At the entrance of each ramp, a two lane acceleration lane with the length of 250 meters was defined in the model. Also a two lane deceleration lane with the length of 250 meters was defined at the exit ramp to reflect the layout commonly used at the merge and diverge points on freeways.
The reference freeway network defined in the VISSIM model was then used to examine the network performance under a range of different traffic conditions and similarly applied for the following control scenarios:
- − No-control scenario, i.e. neither ramp metering nor VSL control strategies were in operation;
- − Ramp metering only control scenario, i.e. ALINEA ramp metering strategy was activated for both entry ramps defined on the freeway network;
- − Coordinated RM and VSL control scenario, i.e. both RM and VSL strategies were coordinated and used at each merge site.
The traffic demand conditions for which the simulation model was run for each control scenario is summarized in Table 1. As indicated in this Table, the experiment setup with varying flow levels at mainline, on-ramps and off-ramp was selected so that to produce traffic conditions close and slightly beyond the mainline capacity at the merge areas (i.e. merge downstream demand flows were in the range of 1900-2100 vphpl). For this purpose, four different traffic conditions were defined that produced total traffic flows in the range of 7600-9400 vph at the downstream of merges. For each traffic condition, the simulation model was run under 2 different percentage of Heavy Good Vehicles (HGV), i.e. 12.5 and 17.5% and 3 different seed values, i.e. 5, 10 and 15. These HGV percentages represent moderate HGV proportions that are usually observed on freeway sections. Thus, for each control scenario a total of 24 simulation runs were performed to produce a range of traffic conditions near up to the congestion states that may occur in real life in such a freeway network. Each simulation time was 4500 seconds and the first 900 seconds was considered as the warm-up time and the results corresponding to this period were eliminated from the analysis.
| Simulation Run No. |
Seed Value |
%HGV (vph) |
Mainline initial entry flow (vph) |
On-ramp-1 Flow (vph) |
On-ramp-1 to Off-ramp Flow (vph) |
Mainline to Off-ramp Flow (vph) |
On-ramp-2 Flow (vph) |
Total Demand Flow Down-stream On-ramp-2 (vph) |
|---|---|---|---|---|---|---|---|---|
| 1 | 5 | 12.5 | 6175 | 1900 | 475 | 1425 | 1425 | 7600 |
| 2 | 10 | 12.5 | 6175 | 1900 | 475 | 1425 | 1425 | 7600 |
| 3 | 15 | 12.5 | 6175 | 1900 | 475 | 1425 | 1425 | 7600 |
| 4 | 5 | 12.5 | 6825 | 2100 | 525 | 1575 | 1575 | 8400 |
| 5 | 10 | 12.5 | 6825 | 2100 | 525 | 1575 | 1575 | 8400 |
| 6 | 15 | 12.5 | 6825 | 2100 | 525 | 1575 | 1575 | 8400 |
| 7 | 5 | 12.5 | 5871 | 2660 | 931 | 1729 | 1729 | 7600 |
| 8 | 10 | 12.5 | 5871 | 2660 | 931 | 1729 | 1729 | 7600 |
| 9 | 15 | 12.5 | 5871 | 2660 | 931 | 1729 | 1729 | 7600 |
| 10 | 5 | 12.5 | 6489 | 2940 | 1029 | 1911 | 1911 | 8400 |
| 11 | 10 | 12.5 | 6489 | 2940 | 1029 | 1911 | 1911 | 8400 |
| 12 | 15 | 12.5 | 6489 | 2940 | 1029 | 1911 | 1911 | 8400 |
| 13 | 5 | 17.5 | 6175 | 1900 | 475 | 1425 | 1425 | 7600 |
| 14 | 10 | 17.5 | 6175 | 1900 | 475 | 1425 | 1425 | 7600 |
| 15 | 15 | 17.5 | 6175 | 1900 | 475 | 1425 | 1425 | 7600 |
| 16 | 5 | 17.5 | 6825 | 2100 | 525 | 1575 | 1575 | 8400 |
| 17 | 10 | 17.5 | 6825 | 2100 | 525 | 1575 | 1575 | 8400 |
| 18 | 15 | 17.5 | 6825 | 2100 | 525 | 1575 | 1575 | 8400 |
| 19 | 5 | 17.5 | 5871 | 2660 | 931 | 1729 | 1729 | 7600 |
| 20 | 10 | 17.5 | 5871 | 2660 | 931 | 1729 | 1729 | 7600 |
| 21 | 15 | 17.5 | 5871 | 2660 | 931 | 1729 | 1729 | 7600 |
| 22 | 5 | 17.5 | 6489 | 2940 | 1029 | 1911 | 1911 | 8400 |
| 23 | 10 | 17.5 | 6489 | 2940 | 1029 | 1911 | 1911 | 8400 |
| 24 | 15 | 17.5 | 6489 | 2940 | 1029 | 1911 | 1911 | 8400 |
3. RESULTS
The results produced through the simulation runs for the conditions indicated in the previous section were analyzed to evaluate the performance of the modelled freeway network under three control scenarios namely no-control, only RM control and coordinated RM plus VSL controls. The following measures were selected for the comparison of these scenarios:
- − The average delay sustained by the overall traffic,
- − The average travel time of the mainline traffic, and
- − The mainline throughput at the freeway section located 500 meters downstream of the second merge point (On-ramp-2).
It should be noted that the second measure, the average travel time of the mainline traffic, is not conclusive as the other affected measure would be the average travel time of the on-ramp traffic. However, this measure was also used in the light of priority usually given to the mainline traffic stream and the fact that through using strategic traffic management techniques, a downfall to the on-ramp traffic can be compensated by their diversion to the alternative routes.
The results of simulation runs for the above measures are presented in Table 2.
| Simulation Run No. | Average Travel Time of Mainline (Freeway) Traffic (Seconds) | Average Delay Sustained by Overall Traffic (Ramp Traffic+ Freeway Traffic) (Seconds) | Average Throughput of Freeway Traffic at Downstream of the On-Ramp-2 (Veh/Hour) |
||||||
|---|---|---|---|---|---|---|---|---|---|
| No-control | RM only | RM+VSL | No-control | RM only | RM+VSL | No-control | RM only | RM+VSL | |
| 1 | 347 | 361 | 292 | 230 | 195 | 153 | 7725 | 7539 | 7907 |
| 2 | 344 | 361 | 298 | 226 | 184 | 159 | 7753 | 7492 | 7744 |
| 3 | 342 | 369 | 306 | 230 | 218 | 166 | 7735 | 7491 | 7695 |
| Average (seconds) | 344.3 | 363.7 | 298.7 | 228.7 | 199 | 159.3 | 7737.7 | 7507.3 | 7782 |
| % Change to No-control | - | 5.6 | -13.2 | - | -13 | -30.3 | - | -3 | 0.6 |
| 4 | 350 | 361 | 304 | 245 | 217 | 166 | 7684 | 7548 | 7720 |
| 5 | 348 | 365 | 320 | 232 | 216 | 178 | 7658 | 7530 | 7568 |
| 6 | 354 | 363 | 292 | 240 | 214 | 153 | 7607 | 7512 | 7899 |
| Average (seconds) | 350.7 | 363 | 305.3 | 239 | 215.7 | 165.7 | 7649.7 | 7530 | 7729 |
| % Change to No-control | - | 3.5 | -12.9 | - | -9.7 | -30.7 | - | -1.6 | 1 |
| 7 | 337 | 357 | 296 | 200 | 188 | 160 | 7712 | 7533 | 7760 |
| 8 | 342 | 362 | 302 | 193 | 184 | 169 | 7552 | 7522 | 7670 |
| 9 | 347 | 363 | 296 | 211 | 192 | 158 | 7725 | 7510 | 7716 |
| Average (seconds) | 342 | 360.7 | 298 | 201.3 | 188 | 162.3 | 7663 | 7521.7 | 7715.3 |
| % Change to No-control | - | 5.5 | -12.9 | - | -6.6 | -19.4 | - | -1.8 | 0.7 |
| 10 | 345 | 363 | 298 | 204 | 190 | 162 | 7534 | 7531 | 7692 |
| 11 | 341 | 362 | 294 | 209 | 188 | 161 | 7584 | 7535 | 7807 |
| 12 | 341 | 364 | 292 | 207 | 201 | 156 | 7566 | 7498 | 7835 |
| Average (seconds) | 342.3 | 363 | 294.7 | 206.7 | 193 | 159.7 | 7561.3 | 7521.3 | 7778 |
| % Change to No-control | - | 6 | -13.9 | - | -6.6 | -22.7 | - | -0.5 | 2.9 |
| 13 | 348 | 361 | 310 | 239 | 219 | 170 | 7178 | 7298 | 7511 |
| 14 | 352 | 390 | 327 | 237 | 218 | 182 | 7171 | 6935 | 7436 |
| 15 | 343 | 362 | 310 | 236 | 217 | 168 | 7278 | 7273 | 7597 |
| Average (seconds) | 347.7 | 371 | 315.7 | 237.3 | 218 | 173.3 | 7209 | 7168.7 | 7514.7 |
| % Change to No-control | - | 6.7 | -9.2 | - | -8.1 | -27 | - | -0.6 | 4.2 |
| 16 | 327 | 359 | 315 | 225 | 216 | 175 | 7498 | 7300 | 7503 |
| 17 | 340 | 361 | 325 | 233 | 220 | 186 | 7355 | 7223 | 7286 |
| 18 | 347 | 359 | 311 | 240 | 221 | 168 | 7347 | 7259 | 7515 |
| Average (seconds) | 338 | 359.7 | 317 | 232.7 | 219 | 176.3 | 7400 | 7260.7 | 7434.7 |
| % Change to No-control | - | 6.4 | -6.2 | - | -5.9 | -24.2 | - | -1.9 | 0.5 |
| 19 | 334 | 349 | 324 | 212 | 197 | 190 | 7350 | 7310 | 7238 |
| 20 | 342 | 357 | 325 | 218 | 200 | 191 | 7268 | 7274 | 7160 |
| 21 | 332 | 364 | 314 | 216 | 205 | 179 | 7403 | 7230 | 7402 |
| Average (seconds) | 336 | 356.7 | 321 | 215.3 | 200.7 | 186.7 | 7340.3 | 7271.3 | 7266.7 |
| % Change to No-control | - | 6.2 | -4.5 | - | -6.8 | -13.3 | - | -0.9 | -1 |
| 22 | 346 | 364 | 312 | 216 | 209 | 175 | 7151 | 7209 | 7361 |
| 23 | 354 | 360 | 322 | 227 | 207 | 187 | 7238 | 7253 | 7288 |
| 24 | 336 | 363 | 306 | 217 | 207 | 170 | 7307 | 7204 | 7390 |
| Average (seconds) | 345.3 | 362.3 | 313.3 | 220 | 207.7 | 177.3 | 7232 | 7222 | 7346.3 |
| % Change to No-control | - | 4.9 | -9.3 | - | -5.6 | -19.4 | - | -0.1 | 1.6 |
| Overall Average (seconds) | 343 | 363 | 308 | 223 | 205 | 170 | 7474 | 7375 | 7571 |
| Overall % Change to No-control | - | 5.8 | -10.2 | - | -8.1 | -23.8 | - | -1.3 | 1.3 |
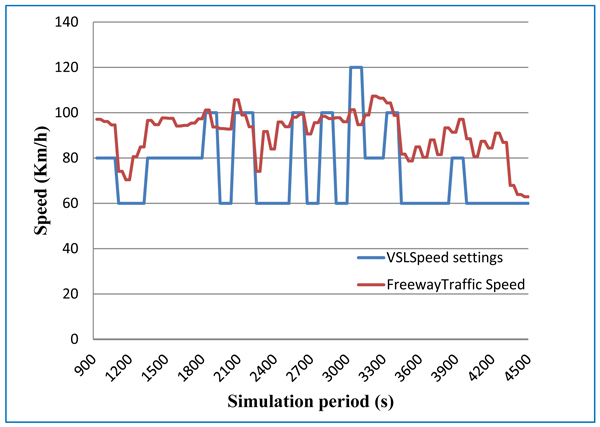
An example of speed limits set by the coordinated VSL and RM system in relation to the actual traffic speeds measured at the detector position is shown in Fig. (5). As indicated in this Figure, VSL system in coordination with the Ramp Metering system has demonstrated a good response in relation to different traffic conditions.
4. DISCUSSION ON THE RESULTS
A general overview of the results presented in Table 2 indicates that whilst the mainline average travel time has been increased under the RM only control scenario, it has been reduced under the combined RM+VSL control scenario. The poor performance of the RM only control scenario could be attributed to the impact of queue override logic deployed in the RM algorithm which reduces the RM efficiency under high traffic demands. However, the results presented in this Table indicates that this negative impact has been compensated under the combined RM+VSL control scenario by even producing reduced travel times in all simulation runs. In terms of average delay sustained by overall traffic, the results presented in Table 2 indicates that this measure has been improved under both RM only and RM+VSL control scenarios. However, this improvement is more pronounced under the combined RM+VSL scenario by as much as 2 to 4 times as RM only control scenario. In terms of merge downstream throughput measure, the results presented in Table 2 indicates that while this measure is slightly decreased under the RM only control scenario, it is slightly increased in most simulated scenarios under the combined RM+VSL control scenario. These marginal effects could be attributed to the fact that these control strategies were examined under traffic demands close and slightly beyond the mainline capacity in this study.
In order to provide a more precise comparison of the performance of these three control scenarios, MINITAB software was used to perform one-way ANOVA test on the data obtained for three aforementioned measures of performance. The ANOVA analysis produced a nearly zero p-value for the mainline travel time, overall traffic delay and freeway downstream throughput, indicating that there was sufficient evidence that the means of these measures for three examined scenarios were not equal (a=0.05).
For each measure of performance, the difference between means corresponding to the three scenarios were examined. The Hsu's MCB (Multiple Comparisons with the Best) test was used for this purpose. The mean value of the outperformed scenario for each measure of performance was compared with the similar mean values obtained for other scenarios. Based on this analysis, the RM+VSL scenario was identified as the best scenario as it was the only scenario that its corresponding confidence intervals for travel time and delay measures contained negative values and for the throughput measure, its corresponding confidence interval contained higher positive values than other two scenarios.
Furthermore, the Tukey's test was used for multiple comparisons of confidence intervals of travel time, delay and throughput measures between three scenarios. The results of this analysis for travel time and delay measures indicated that the means corresponding to the three scenarios were statistically different as the confidence interval for each paired scenarios did not include zero values. However, for the throughput measure, the results of this test indicated that only paired (RM+VSL) and RM scenarios produced statistically different performance.
CONCLUSION
From the statistical analysis of the results it can be concluded that the (RM +VSL) scenario outperformed other two scenarios in terms of specified measures of performance, namely freeway average travel time, overall average traffic delay (mainline traffic + ramp traffic) and merge downstream throughput and the difference was statistically significant.
This can be attributed to the synergistic effects of coordinated and integrated use of these control systems on the freeway network.
CONSENT FOR PUBLICATION
Not applicable.
CONFLICT OF INTEREST
The authors declare no conflict of interest, financial or otherwise.
ACKNOWLEDGEMENT
The author would like to express his gratitude to the University of Yazd for providing financial support for this study and Mr Ali Bagh-Alishahi for his assistant throughout this research.
APPENDIX A - Variable Speed Limit algorithm produced using VAP facility in VISSIM
PROGRAM Spl_VMS; /* Q:\VISSIM\DATEN\_PTV\VBA\Spl_VMS.vv */
CONST
F =1,
DT = 1,
ALPHA = 0.5,
QON100 = 6400,
QON80 = 7200,
QON60 = 7600,
QOFF100 = 5870,
QOFF80 = 6670,
QOFF60 = 7200;
/* ARRAYS */
/* SUBROUTINES */
/* PARAMETERS DEPENDENT ON SCJ-PROGRAM */
/* EXPRESSIONS */
/* MAIN PROGRAM */
S00Z001: IF NOT initialized THEN
S01Z001: initialized:= 1;
S01Z002: desSpeed:= 120;
S01Z003: Set_sg_direct(3, Off);
S01Z004: Start(evalInt)
END;
S00Z006: IF evalInt = 60*DT THEN
S01Z006: qCarPrev:= qCar; qHGVPrev:= qHGV;
S01Z007: qCar1:= Front_ends(7) * 60 / DT;
S01Z008: qCar2:= Front_ends(8) * 60 / DT;
S01Z009: qCar3:= Front_ends(9) * 60 / DT;
S01Z010: qCar4:= Front_ends(10) * 60 / DT;
S01Z011: qCar:= qCar1 + qCar2 + qCar3 + qCar4;
S01Z012: qCarZ:= (ALPHA * qCar) + ((1.0 - ALPHA) * qCarPrev);
S01Z013: Clear_Front_ends(7); Clear_Front_ends(8);
S01Z014: Clear_Front_ends(9); Clear_Front_ends(10);
S03Z007: qHGV1:= Front_ends(3) * 60 / DT;
S03Z008: qHGV2:= Front_ends(4) * 60 / DT;
S03Z009: qHGV3:= Front_ends(5) * 60 / DT;
S03Z010: qHGV4:= Front_ends(6) * 60 / DT;
S03Z011: qHGV:= qHGV1 + qHGV2 + qHGV3 + qHGV4;
S03Z012: qHGVZ:= (ALPHA * qHGV) + ((1.0 - ALPHA) * qHGVPrev);
S03Z013: Clear_Front_ends(3); Clear_Front_ends(4);
S03Z014: Clear_Front_ends(5); Clear_Front_ends(6);
S01Z016: Qb:= qCarZ + F*qHGVZ;
S01Z017: Reset(evalInt); Start(evalInt);
S01Z018: IF desSpeed >= 120 THEN
S02Z018: IF Qb > QON60 THEN
S03Z018: Set_sg_direct(3, RedAmber);
S04Z018: desSpeed:= 60
ELSE
S02Z019: IF Qb > QON80 THEN
S03Z019: Set_sg_direct(3, Amber);
S04Z019: desSpeed:= 80
ELSE
S02Z020: IF Qb > QON100 THEN
S03Z020: Set_sg_direct(3, Green);
S04Z020: desSpeed:= 100
END
END
END
ELSE
S01Z022: IF desSpeed = 100 THEN
S02Z022: IF Qb > QON60 THEN
S03Z022: Set_sg_direct(3, RedAmber);
S04Z022: desSpeed:= 60
ELSE
S02Z023: IF Qb > QON80 THEN
S03Z023: Set_sg_direct(3, Amber);
S04Z023: desSpeed:= 80
ELSE
S02Z024: IF Qb < QOFF100 THEN
S03Z024: Set_sg_direct(3, Aus);
S04Z024: desSpeed:= 120
END
END
END
ELSE
S01Z026: IF desSpeed = 80 THEN
S02Z026: IF Qb > QON60 THEN
S03Z026: Set_sg_direct(3, RedAmber);
S04Z026: desSpeed:= 60
ELSE
S02Z027: IF Qb < QOFF100 THEN
S03Z027: Set_sg_direct(3, Off);
S04Z027: desSpeed:= 120
ELSE
S02Z028: IF Qb < QOFF80 THEN
S03Z028: Set_sg_direct(3, Green);
S04Z028: desSpeed:= 100
END
END
END
ELSE
S01Z030: IF desSpeed = 60 THEN
S02Z030: IF Qb < QOFF100 THEN
S03Z030: Set_sg_direct(3, Off);
S04Z030: desSpeed:= 120
ELSE
S02Z031: IF Qb < QOFF80 THEN
S03Z031: Set_sg_direct(3, Green);
S04Z031: desSpeed:= 100
ELSE
S02Z032: IF Qb < QOFF60 THEN
S03Z032: Set_sg_direct(3, Amber);
S04Z032: desSpeed:= 80
END
END
END
END
END
END
END
END;
S00Z033: Record_value(1, qB);
S00Z034: Set_des_speed(1, 10, desSpeed); Set_des_speed(2, 10, desSpeed);
S00Z035: Set_des_speed(3, 10, desSpeed); Set_des_speed(4, 10, desSpeed);
S00Z036: Set_des_speed(1, 20, desSpeed); Set_des_speed(2, 20, desSpeed);
S00Z037: Set_des_speed(3, 20, desSpeed); Set_des_speed(4, 20, desSpeed);
S00Z038: Record_value(3, desSpeed)
PROG_ENDE: .
/*----------------------------------------------------------------------------*/
APPENDIX B - Ramp Metering + Coordinated RM + VSL algorithm produced using VAP facility in VISSIM
PROGRAM RampMetering; /* D:\VISSIM\Daten\__Training\VAP_RampMetering.214\RampMetering.vv */
CONST
MAX_LANE = 4,
KR = 70,
F = 2.5,
HGV = 0.125,
n = 4,
OCC_OPT = 0.29;
/* ARRAYS */
ARRAY
detNo [4, 1 ] = [[11], [12], [13], [14]];
/* SUBROUTINES */
/* PARAMETERS DEPENDENT ON SCJ-PROGRAM */
IF(prog_aktiv = 1) AND (prog_aktiv0vv <> 1) THEN
prog_aktiv0vv:= 1;
DT:= 1;
ELSE IF(prog_aktiv = 2) AND (prog_aktiv0vv <> 2) THEN
prog_aktiv0vv:= 2;
DT:= 1;
END END;
/* EXPRESSIONS */
Demand:= Detection(2);
/* MAIN PROGRAM */
S00Z001: IF NOT init THEN
S01Z001: init:= 1;
S01Z002: Set_sg(1, off)
END;
S00Z004: cyc_sec:= cyc_sec + 1;
S00Z005: IF cyc_sec >= cyc_length THEN
S01Z005: cyc_sec:= 0
END;
S00Z007: Set_cycle_second(cyc_sec);
S00Z008: laneNo:= 1;
S00Z010: IF laneNo <= MAX_LANE THEN
S01Z010: IF detNo[ laneNo, 1 ] > 0 THEN
S02Z010: oout:= oout + Occup_rate(detNo[ laneNo, 1 ]);
S02Z011: laneNo:= laneNo + 1;
GOTO S00Z010
END
END;
S00Z013: timer_dc:= timer_dc + 1;
S00Z014: IF timer_dc = (60 * DT) THEN
S01Z014: timer_dc:= 0;
S01Z015: qRamp1:= (Front_ends(5)); Clear_front_ends(5);
S01Z016: qRamp2:= (Front_ends(6)); Clear_front_ends(6);
S01Z017: qRamp:=qRamp1+qRamp2 ;
S01Z018: oout:= oout / MAX_LANE / (60*DT);
S01Z019: cqRamp:= qRamp + KR * (OCC_OPT - oout);
S01Z020: cqRampHour:= cqRamp * 60 / DT;
S01Z021: q1:= Front_ends(7) * 60 / DT;
S01Z022: q2:= Front_ends(8) * 60 / DT;
S01Z023: q3:= Front_ends(9) * 60 / DT;
S01Z024: q4:= Front_ends(10) * 60 / DT;
S01Z025: q:= q1 + q2 + q3 + q4;
S01Z026: r:= n*(2400/((1+HGV)*F))-q;
S01Z027: IF cqRampHour > r THEN
S02Z027: cqRampHour:= r
END;
S01Z029: IF cqRampHour < 480 THEN
S02Z029: cqRampHour:= 480
END;
S01Z031: cqRamp:= cqRampHour * DT / 60;
S01Z032: Clear_Front_ends(7); Clear_Front_ends(8);
S01Z033: Clear_Front_ends(9); Clear_Front_ends(10);
S01Z034: cyc_length:= 60*DT / cqRamp;
S01Z035: oout100:= oout * 100; RecVal(1, oout100);
S01Z036: oout:= 0
END;
S00Z038: IF cyc_length < 4 THEN
S01Z038: Set_sg(1, off)
ELSE
S00Z039: IF Demand THEN
S01Z039: IF cyc_sec = 0 THEN
S02Z040: Set_sg(1, redamber);
S02Z041: cyc_sec:= 0
ELSE
S01Z040: IF T_red(1) >= cyc_length-3 THEN
GOTO S02Z040
ELSE
S00Z042: IF Current_state(1, redamber) THEN
S01Z042: Set_sg(1, off)
ELSE
S00Z043: IF Current_state(1, off) THEN
S01Z043: IF NOT (cyc_length < 4) THEN
S01Z044: Set_sg(1, amber)
END
ELSE
S00Z045: IF Current_state(1, amber) THEN
S01Z045: Set_sg(1, red)
END
END
END
END
END
ELSE
GOTO S00Z042
END
END;
S00Z047: RecVal(2, cyc_length);
S00Z048: qRampHour:= qRamp * 60 / DT; RecVal(3, qRampHour)
PROG_ENDE: .
/*----------------------------------------------------------------------------*/

