All published articles of this journal are available on ScienceDirect.

How Rapidly Do The Road Fatality Rates of 37 Countries Converge Over Time?
Abstract
Background:
Road crashes kill about 1.3 million people worldwide every year and severely injure an estimated 50 million. This paper examined two associated questions of convergence as to whether countries with initially high fatality rates tend to improve faster catch-up. Also, it was examined whether dispersion of road fatality rates among countries decreased over time.
Methods:
Using γ convergence and σ convergence, a total of 37 countries with reliable fatality data from 1994 to 2015 were analyzed. Common measures of dispersion include the standard deviation or coefficient of variation. For σ convergence, coefficient of variation was selected.
Results:
Results indicate that statistically valid patterns of convergence toward both catch-up effect and reduction of dispersion exist for the total group of countries. However, a wide variation in the pattern and speed of convergence was discovered for the subgroups of countries categorized by income level and regions.
Conclusion:
Convergence method helps to identify the most appropriate reference group for a given country in planning future goals for improving road fatality rate and catch-up speed. The findings from this research indicate that the speed of catch-up among different subgroups of countries varied.
1. INTRODUCTION
According to a 2017 Road Safety Annual Report [1], road crashes kill about 1.3 million people worldwide every year and severely injure an estimated 50 million. The sense of urgency to achieve significant reductions in the number of road deaths globally has been strengthened by the inclusion of road safety targets in the Sustainable Development Goals (SDGs) adopted by the United Nations in 2015 [2]. SDG aims to reach a goal of 3.6 targets by 2020, “to halve the number of global deaths and injuries from road traffic accidents, compared to their 2010 levels.” Furthermore, by 2030, SDG intends “to provide access to safe, affordable, accessible, and sustainable transport system for all, improving road safety notably by expanding public transport.” The 2020 SDG target will require improvement in the rates of fatalities per 100,000 inhabitants as follows.
- High-Income Countries: from 8.7 deaths in 2010 to 4 by 2020
- Middle-Income Countries: from 20.1 deaths in 2010 to 7 by 2020
- Low-Income Countries: from 18.3 deaths in 2010 to 12 by 2020
There are usually three ways of measuring road fatality rate; by the distance travelled, per registered motor vehicles, or per 1,000,000 inhabitants [1]. Due to the difficulty in obtaining reliable distance travelled and the number of registered vehicles from multiple countries, the most commonly used measure is the population-based fatality rate. Accordingly, this research also used fatality rate per 1 million inhabitants.
According to the 2017 Road Safety Annual Report [1], three countries, Norway, Sweden, and the United Kingdom out of the 31 countries with validated data had their 2015 fatality rates of less than 30 per 1 million inhabitants. On the other hand, four countries, Argentina, Chile, Morocco, and the United States had their 2015 rates with more than 100 per 1 million inhabitants. However, all 31 countries had varying degrees of reductions in their fatality rates. For example, in 2000, Sweden had a fatality rate of 6.7 in 2000 reduced to 2.7 by 2015, while the United States had a rate of 149 in 2000 which was reduced to 109 by 2015. These examples show that there were large variations of changing fatality rates among multiple countries Table 1.
The historical fatality rates for the two subgroups of 9 middle-income OECD countries were compared with 9 Non-OECD countries;their respective average fatality rate for 1994 was much higher for the OECD group at 183.81 per 1,000,000 populations and 143.5 per 1,000,000 for the Non-OECD group as shown in Table 2. By 2015, the OECD group’s average rate declined to 72.19 as opposed to 105.35 by the group of Non-OECD countries. The former experienced a negative annual compound growth rate (CARG) of -4.16% vs. -1.46% by the latter. This significant difference in the annual improvement rate of the average fatality rate occurred following the convergence concept that the group with an initially poor record is more likely to improve faster to catch-up to the leading group with superior initial record.
To validate the results from the previous example, the data of the two subgroups of 19 high-income OECD group versus 9 Non-OECD groups were compared. The 1994 average fatality
| Countries | Total(37) | OECD(28) | High-OECD(19) | Middle-OECD(9) | Non-OECD(9) |
|---|---|---|---|---|---|
| 1 | Albania | Albania | |||
| 2 | Australia | Australia | Australia | ||
| 3 | Austria | Austria | Austria | ||
| 4 | Belgium | Belgium | Belgium | ||
| 5 | Bulgaria | Bulgaria | |||
| 6 | Croatia | Croatia | |||
| 7 | Czech Republic | Czech Republic | Czech Republic | ||
| 8 | Finland | Finland | Finland | ||
| 9 | Former Yugoslav Republic of Macedonia | Former Yugoslav Republic of Macedonia | |||
| 10 | Georgia | Georgia | |||
| 11 | Germany | Germany | Germany | ||
| 12 | Greece | Greece | Greece | ||
| 13 | Hungary | Hungary | Hungary | ||
| 14 | Iceland | Iceland | Iceland | ||
| 15 | India | India | |||
| 16 | Ireland | Ireland | Ireland | ||
| 17 | Israel | Israel | Israel | ||
| 18 | Japan | Japan | Japan | ||
| 19 | Korea | Korea | Korea | ||
| 20 | Latvia | Latvia | Latvia | ||
| 21 | Lithuania | Lithuania | |||
| 22 | Luxembourg | Luxembourg | Luxembourg | ||
| 23 | Moldova | Moldova | |||
| 24 | Netherlands | Netherlands | Netherlands | ||
| 25 | New Zealand | New Zealand | New Zealand | ||
| 26 | Norway | Norway | Norway | ||
| 27 | Poland | Poland | Poland | ||
| 28 | Portugal | Portugal | Portugal | ||
| 29 | Russia | Russia | |||
| 30 | Slovak Republic | Slovak Republic | Slovak Republic | ||
| 31 | Slovenia | Slovenia | Slovenia | ||
| 32 | Spain | Spain | Spain | ||
| 33 | Sweden | Sweden | Sweden | ||
| 34 | Switzerland | Switzerland | Switzerland | ||
| 35 | Turkey | Turkey | Turkey | ||
| 36 | United Kingdom | United Kingdom | United Kingdom | ||
| 37 | United States | United States | United States |
rate for the high-income group was as low as 118.19 compared to the Non-OECD group’s 145.5 per 1,000,000 populations as shown in Table 2. By 2015, the high-income OECD group reduced its average rate to 49.3 versus 105.35 by the Non-OECD group. The former realized the negative CAGR of -3.9% versus -1.469% by the non-OECD group, this time deviating from the conventional convergence concept.
Do these contradicting examples indicate that lagging countries do not always improve their road fatality rates faster to catch-up to leading countries? And then, do dispersions of fatality rates among countries within respective subgroups decrease over time? In order to answer these questions systematically, this research dealt exclusively with the convergence analysis of road fatality rates among multiple countries. The central question of this research dealt exclusively with the convergence analysis of road fatality rates among multiple countries. In spite of extensive coverage on the dynamics of the past and future trends of road fatality rates of multiple countries [3-11], the recent literature on convergence analysis of road fatality rates appears to be limited to two major papers [12, 13]. Using the club convergence methodo- logy, Nghiem, et al. [12], analyzed road traffic crash fatality rates of 23 OECD countries during 1961-2007. They found no evidence of the convergence of fatality rates across the 23 OECD countries as a whole. However, they found evidence of convergence among the five subgroups of countries. On the other hand, Castillo-Manzano, et al. [13], found beta convergence for all 23 EU countries, but not for the subgroups of countries during the period of 1970 to 2010. They used a more traditional method of Sigma and Beta convergence. In sum, their findings appear to be somewhat in conflict.
More specifically, there are two convergence questions to be examined in this research. Firstly, do countries with initially high fatality rates tend to improve faster so that they can catch-up with countries with lower fatality rates over time? If so, how rapid is the rate of catch-up? Second, does dispersion of road fatality rates among countries get reduced over time? If so, how fast is the rate of reduction of dispersion? Gamma (γ) convergence is used to analyze the first question of catch-up, while Sigma (σ) convergence is used to analyze the second question of dispersion in this research. A detailed description of γ and σ convergence will be presented subsequently. For the sample of countries, 37 countries with complete yearly fatality rate during the period of 1994 to 2015 were selected. The convergence analyses were made for this total group of 37 countries and for four subgroups of countries.
After this introduction, the paper is organized into five additional sections. In the second section, the methodology of σ and γ convergence is explained. Data and data sources are presented in the third section. The fourth section discusses the analysis of results and the fifth section covers discussion on results and policy implications. Finally, conclusion and limitations of the research are presented in the sixth section.
2. METHODOLOGY
The traditional convergence analysis attempts to examine two basic questions. First, do countries initially lagging in such performance measures as road fatality rates tend to improve faster so that they catch up to the performance of leading countries over time? Second, does dispersion of such performance measures as road fatality rate among countries get reduced over time? β convergence is used to examine the first question, while σ convergence is used to analyze the second question.
β convergence implies that the performance measures improve slowly in countries with high initial performance values and improve faster in countries with low initial performance values. The so-called Barro β convergence method [14] regresses the rate of improvement during a period on the initial value of road fatality rates for respective countries. If the value of the coefficient of slope is negative and statistically significant, then the catch-up process is demonstrated.
When the regression includes only the initial value as an independent variable, it models “unconditional” or “absolute” β convergence in which all countries are assumed to move toward a common destination. Since such a restrictive assumption is rarely obtained in practice, the resulting estimate may contain significant bias. For that reason, the regression often includes multiple variables related to the characteristics of countries such as productivity, quality of education, etc. Then, it represents a model of “conditional” β convergence or club convergence. However, “conditional” β convergence or club convergence methods are much more complex to use. Furthermore, the results are often difficult to explain.
In addition, the use of “Barro regression” for both unconditional and conditional β convergence was criticized to yield biased estimates [15] due to Galton Fallacy related to the tendency of regression to mean. Instead, Friedman [16] suggests that β convergence can be more appropriately measured by tracking the inter-temporal change in the coefficient of variations of the distribution of performance measures for respective countries. This method is known as σ convergence. If the trend is declining and statistically significant, σ convergence is confirmed. In addition, σ convergence method is simple to use.
Another criticism of β convergence [17] is that the method does not provide us with the inter-temporal intra-distribution mobility of countries with respect to performance measures. Therefore, Quah [18] suggests a method that is capable of capturing the full dynamics of evolving cross-country distribution using Markov Chain analysis. A simple approximation to Quah’s methodology was proposed by Boyle and McCarthy [19] where they used Kendall’s index of rank concordance [20] to measure changes in the ordinal ranking of countries over time. They label their method as γ convergence. By using γ convergence with a simple measure of σ convergence, they suggest that one can identify the nature of convergence and also a sense of the dynamics of the cross-country distribution performance measures.
Since then, a large number of studies using γ convergence methodology have been published in areas such as energy, economic growth, inflation, employment, and healthcare [21-28]. For these reasons, γ convergence [19] and σ convergence [16] have been selected for the analysis of road fatality rates.
Common measures of dispersion include standard deviation or the coefficient of variation [29]. For σ convergence, coefficient of variation (CV) has been selected. CV is measured by dividing standard deviation by the sample average. Using CV which is a dimensionless ratio, enables to compare the degree of dispersion for performance measures with different units. The inter-temporal changes were then measured by normalizing CV in subsequent years compared to CV in the beginning of 1997. Therefore, CV in 1997 was always 1.0. If the values of normalized CVs in the subsequent years are less than the CV in the initial year, then, the normalized CV in subsequent years will be less than 1.0. If the values of normalized CVs in the subsequent years continue to decrease, and the differences between CVs are statistically significant, the result is viewed as evidence of σ convergence or reduction of dispersion. Two sample t-test for CV was used (http://www.real-statistics.com/students-t-distribution/coefficient-of-variation-testing/). This test works best when the sample sizes are at least 10. Since the sample sizes are much larger than 10, this test should work well.
For γ convergence model, Boyle and McCarthy [19] suggested the use of Kendall’s index of rank concordance which measures the mobility of the individual countries over time within the cross country distribution of a particular performance measure [30, 31]. In other words, γ convergence measures the degree of changing ranking order of countries between a given year and the initial year. The terms for the γ convergence used in Kendall’s binary index version are explained as follows:
AR(Y)it: the actual rank of country i’s performance measure in year t which is binary Gamma index in year t.
AR(Y)io: the actual rank of country i’s performance measure in year o which is binary Gamma index in year o.
γt = Binary Kendall γ index in year t.
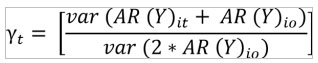 |
The γ index has the advantage of being of a single number traced over time in two- dimensions, analogous to the σ convergence index. The value of rank concordance ranges from zero to unity. If no change in rank order takes place, the rank concordance becomes unity. If a catch-up process is present, which results in a change of rank order, the index will be less than the unity. The statistic is distributed as chi-square and the null hypothesis is tested which shows that γ convergence shows no difference between ranks of different years [20].
According to Real Statistics Using Excel, the proper use of X2 test to test the statistical difference of Kendall’s coefficient of concordance (W) on yearly γ index requires that the number of countries involved should be equal to 5 or more, or the number of years being compared should be more than 15 years. In this case, the number of countries involved will always be greater than 5 countries. Therefore, this test can be used to validate the null hypothesis that W=0 or that there is no agreement between the years being compared.
How do we use σ and γ index together to evaluate the reduction of dispersion as well as the catch-up process? There are four different results that can occur. The simplest case is when both σ and γ index increase in values. Under the circumstances, neither reduction of dispersion nor catch-up may take place. The second case is that both σ and γ indexes decrease, which indicates that both the reduction of dispersion and the catch-up process take place. The third case occurs where σ convergence measure does not decrease, while γ convergence value shows a declined trend. Since β convergence is a necessary but not a sufficient condition for σ convergence, this indicates that catch-up process is taking place, while the reduction of dispersion is not. The fourth case occurs where γ index does not decrease while there is a substantial decline in the σ index. This indicates that rank change among countries does not take place. However, performance differences among countries have reduced considerably.
3. DATA AND DATA SOURCE
The road fatality rate for a given country is measured as the number of deaths due to road accidents per 1,000,000 inhabitants. Deaths from road accidents are counted immediately or within 30 days of the accident, excluding suicides involving the use of road vehicles.
First, road fatality rates for 53 countries are obtained from OECD data source at https://data.OECD.org/ Transport/road-accidents.htm. From a total of 57 countries, 37 countries had their complete fatality rates during 1994 to 2015. This group of 37 countries was made up of 28 OECD countries and 9 Non OECD countries. For the purpose of analysis, the group of 28 OECD countries was further divided into two subgroups of 19 OECD countries with high income per capita and the remaining 9 OECD countries with middle income per capita. As shown in Table 1, the high income group included such countries as Sweden, Switzerland, Finland, Japan, The United States, Netherlands, Belgian, United Kingdom, and Germany. On the other hand, the middle income group included Czech Republic, Greece, Hungary, Poland, Portugal, Slovenia Turkey, and others. Table 1 lists further information about other countries under these five categories.
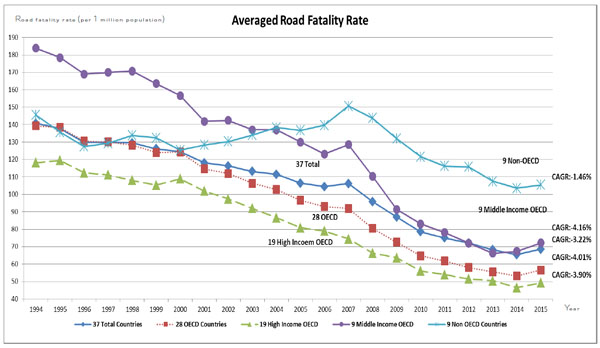
The average annual road fatality rates during 1994 to 2015 for the total group of 37 countries as well as for the four subgroups of countries are listed in Table 2. The 1994 rate of 140.79 deaths per 1,000,000 inhabitants for the total group decreased to the rate of 68.51 in 2015 at a negative compound annual growth rate(CAGR) of -3.22%. The OECD group of 28 countries improved its fatality rate somewhat faster at the CAGR of -4.01%, while the 9 non OECD countries improved slowest at the CAGR of –1.46%. Between the high versus the middle income OECD groups, the growth rates were nearly the same. The middle income group improved at the CAGR of –4.16% while the high income group improved at –3.9%.
Improvement patterns are displayed in Fig. (1) for all the five groups of countries. In general, improvement patterns showed moderate decline from 1994 through 2007, followed by a rapid decline from 2008 through 2015 for all five groups. The improvement patterns for the non OECD group displayed more clear cut difference where the early phase showed increasing fatality rate through 2007, followed by a rapid decline in the second phase from 2008 through 2015.
4. ANALYSIS OF RESULTS
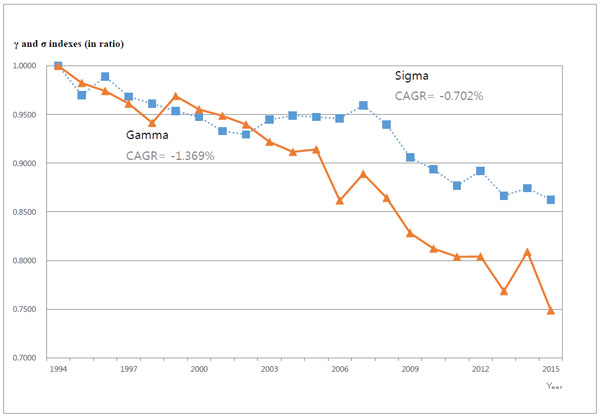
Historical normalized yearly σ and γ indexes for the total group of 37 countries are listed in Table 3 and displayed in Fig. (2). Both σ and γ indexes displayed declining patterns throughout the period of 1994 to 2015 indicating that convergence of road fatality rates among these countries had taken place. However, the rates of decline between the two indexes were substantially different. The rate of decline for normalized γ index was more rapid at the CAGR of -1.369% from 1.0 in 1994 to reach the low index of 0.7487 in 2015. Differences between respective years to the beginning year of 1994 measured in X2 test were statistically significant at less than 1% level, as shown in Table 3.
| Road Fatality Rate | Total(37) | OECD(28) | High-OECD(19) | Middle-OECD(9) | Non-OECD(9) |
|---|---|---|---|---|---|
| 1994 | 140.79 | 139.28 | 118.19 | 183.81 | 145.50 |
| 1995 | 137.79 | 138.48 | 119.54 | 178.47 | 135.64 |
| 1996 | 129.76 | 130.50 | 112.32 | 168.90 | 127.47 |
| 1997 | 129.84 | 130.03 | 111.12 | 169.97 | 129.26 |
| 1998 | 129.57 | 128.19 | 108.04 | 170.73 | 133.88 |
| 1999 | 126.08 | 124.03 | 105.28 | 163.60 | 132.44 |
| 2000 | 124.48 | 124.22 | 108.90 | 156.57 | 125.30 |
| 2001 | 118.03 | 114.72 | 101.87 | 141.84 | 128.33 |
| 2002 | 116.37 | 111.89 | 97.42 | 142.44 | 130.29 |
| 2003 | 113.14 | 106.44 | 91.96 | 137.01 | 134.00 |
| 2004 | 111.43 | 102.78 | 86.54 | 137.07 | 138.36 |
| 2005 | 106.39 | 96.65 | 80.89 | 129.92 | 136.69 |
| 2006 | 104.45 | 93.14 | 78.94 | 123.10 | 139.63 |
| 2007 | 106.15 | 91.85 | 74.48 | 128.51 | 150.66 |
| 2008 | 95.87 | 80.48 | 66.32 | 110.37 | 143.77 |
| 2009 | 87.07 | 72.64 | 63.72 | 91.48 | 131.98 |
| 2010 | 78.58 | 64.75 | 56.07 | 83.08 | 121.58 |
| 2011 | 75.01 | 61.77 | 54.03 | 78.10 | 116.22 |
| 2012 | 72.09 | 58.05 | 51.41 | 72.09 | 115.76 |
| 2013 | 68.18 | 55.53 | 50.49 | 66.18 | 107.53 |
| 2014 | 65.45 | 53.19 | 46.49 | 67.33 | 103.59 |
| 2015 | 68.51 | 56.66 | 49.30 | 72.19 | 105.38 |
| CAGR(%) | -3.22% | -4.01% | -3.90% | -4.16% | -1.46% |
The rate of decline of σ index during the same period was about one half of the rate for γ indexes at the CAGR of -0.702%. As Fig. (2) indicates, the decline of σ index from 1994 to 2002 was followed by the six-year period of a moderate increase from 2003 to 2007. It then resumed its declining trend from 2008 through 2015, when the 2007 σ index of 0.9594 in 2007 decreased to 0.8625 by 2015. The results of t test show that statistical significance of the difference appeared first between the 2000 σ index to the 1994 σ index, and all the subsequent years through 2015. In short, countries with higher initial road fatality rate improved faster to catch-up with countries with low fatality rates during the period. At the same time, overall dispersion of fatality rate among countries measured in CV declined moderately during this period.
In order to gain further insights, the total group of 37 countries was divided into two subgroups of 28 OECD countries and 9 non OECD countries. And then, the 28 OECD countries were further subdivided between the 19 OECD countries with higher income per capita and the 9 remaining OECD countries with middle income per capita.
As for σ indexes, the rate of decline for the 28 OECD countries as shown in Table 4 was at -1.252% which was substantially higher than -0.702% estimated for the total group of 37 countries, while much slower rate of decline belongs to the 9 Non OECD countries at -0.681%, as shown in Fig. (3). The historical pattern of σ indexes for the 9 Non OECD countries showed a moderate decline from 1994 to 2000, followed by a modest increase for the next 6 years through 2006, and then followed by another modest decline through 2015, as shown in Fig. (4). In contrast, the 28 OECD countries shown in Fig. (4) indicated a moderate declining pattern of σ indexes from 1994 to 2007, followed by a rapid decline from 2008 through 2013. The final phase shows a slight increase for the two years of 2014 and 2015.
As for γ indexes, the 28 OECD countries group displayed a much more moderate rate of decline at -0.703% in contrast to -1.369% rate of decline estimated earlier for the total group of 37 countries. Much of the decline in γ index for the OECD group took place during the more recent years after 2012. In contrast, the 9 Non OECD countries group displayed an unusually rapid rate of decline at -3.483% which was responsible for the -1.309% declining rate estimate for the total group of 37 countries. The declining rate was actually moderate from 1994 to 2007 and then became much more rapid from 2008 to 2015, as shown in Fig. (5).
| All Countries (37) | ||||
|---|---|---|---|---|
| Sigma | Gamma | |||
| 1994 | 1.0000 | 1.0000 | *** | |
| 1995 | 0.9700 | 0.9824 | *** | |
| 1996 | 0.9891 | 0.9742 | *** | |
| 1997 | 0.9684 | 0.9611 | *** | |
| 1998 | 0.9611 | 0.9415 | *** | |
| 1999 | 0.9537 | 0.9691 | *** | |
| 2000 | 0.9476 | * | 0.9552 | *** |
| 2001 | 0.9330 | ** | 0.9487 | *** |
| 2002 | 0.9295 | ** | 0.9398 | *** |
| 2003 | 0.9447 | ** | 0.9220 | *** |
| 2004 | 0.9491 | *** | 0.9116 | *** |
| 2005 | 0.9475 | *** | 0.9142 | *** |
| 2006 | 0.9460 | *** | 0.8617 | *** |
| 2007 | 0.9594 | *** | 0.8890 | *** |
| 2008 | 0.9397 | *** | 0.8643 | *** |
| 2009 | 0.9059 | *** | 0.8282 | *** |
| 2010 | 0.8935 | *** | 0.8122 | *** |
| 2011 | 0.8770 | *** | 0.8038 | *** |
| 2012 | 0.8922 | *** | 0.8042 | *** |
| 2013 | 0.8666 | *** | 0.7686 | *** |
| 2014 | 0.8743 | *** | 0.8089 | *** |
| 2015 | 0.8625 | *** | 0.7487 | *** |
| CAGR(%) | -0.702% | -1.369% | ||

| OCED Countries (28) | Non-OECD Countries (9) | |||||||
|---|---|---|---|---|---|---|---|---|
| Sigma | Gamma | Sigma | Gamma | |||||
| 1994 | 1.0000 | 1.0000 | *** | 1.0000 | 1.0000 | *** | ||
| 1995 | 0.9700 | 0.9797 | *** | 0.9708 | 1.0000 | *** | ||
| 1996 | 0.9983 | 0.9795 | *** | 0.9515 | 0.9833 | *** | ||
| 1997 | 0.9743 | 0.9702 | *** | 0.9468 | 0.9583 | *** | ||
| 1998 | 0.9592 | 0.9425 | *** | 0.9675 | 0.9750 | *** | ||
| 1999 | 0.9556 | 0.9770 | *** | 0.9451 | 0.9500 | *** | ||
| 2000 | 0.9519 | 0.9540 | *** | 0.9328 | 0.9750 | *** | ||
| 2001 | 0.9137 | ** | 0.9480 | *** | 0.9769 | 0.9417 | *** | |
| 2002 | 0.9055 | ** | 0.9365 | *** | 0.9768 | 0.9583 | *** | |
| 2003 | 0.9005 | *** | 0.9244 | *** | 1.0137 | 0.9417 | *** | |
| 2004 | 0.9089 | *** | 0.9310 | *** | 0.9979 | 0.9083 | *** | |
| 2005 | 0.8931 | *** | 0.9368 | *** | 1.0069 | 0.9083 | *** | |
| 2006 | 0.8799 | *** | 0.8803 | *** | 1.0035 | 0.9000 | *** | |
| 2007 | 0.8979 | *** | 0.9461 | *** | 0.9764 | 0.9083 | *** | |
| 2008 | 0.8569 | *** | 0.9362 | *** | 0.9449 | 0.8167 | *** | |
| 2009 | 0.8185 | *** | 0.9286 | *** | 0.8859 | 0.7167 | *** | |
| 2010 | 0.7998 | *** | 0.9469 | *** | 0.8819 | 0.5667 | *** | |
| 2011 | 0.7758 | *** | 0.9488 | *** | 0.8652 | 0.5667 | *** | |
| 2012 | 0.7731 | *** | 0.9286 | *** | 0.9069 | 0.5917 | *** | |
| 2013 | 0.7559 | *** | 0.9095 | *** | 0.8707 | * | 0.4204 | *** |
| 2014 | 0.7735 | *** | 0.9305 | *** | 0.8920 | ** | 0.5250 | *** |
| 2015 | 0.7675 | *** | 0.8623 | *** | 0.8662 | ** | 0.4750 | *** |
| CAGR(%) | -1.252% | -0.703% | -0.681% | -3.483% | ||||
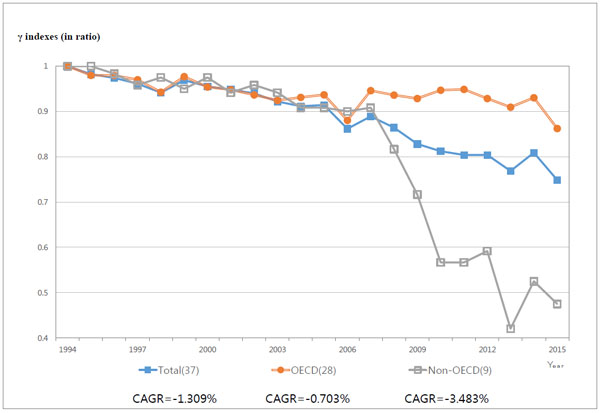
In short, a sharp difference between OECD and Non-OECD groups appeared to exist. Much more rapid decline of σ index applied to the OECD group in contrast to a moderate decline for the Non-OECD group. In other words, the dispersion of fatality rates among OECD countries is reduced rapidly over that of Non OECD countries. On the other hand, an unusually rapid reduction of γ index took place for the Non-OECD countries over a moderate decline for the OECD countries. In other words, a rapid catch-up process took place among the Non-OECD countries in contrast to the OECD countries.
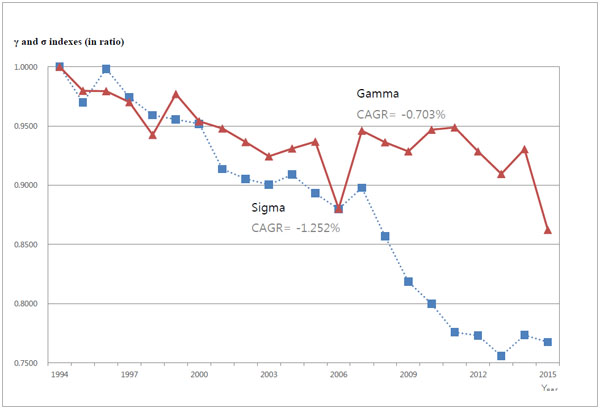
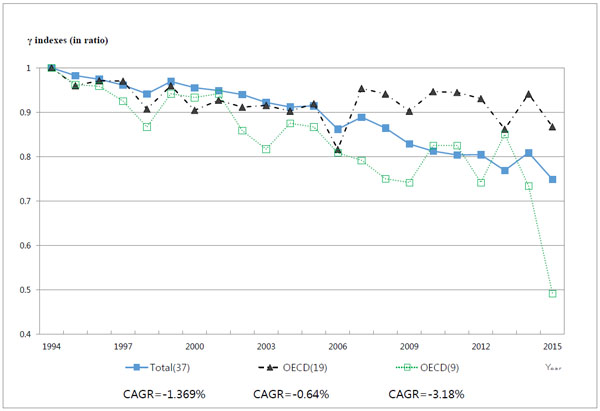
The results of our analysis on the subgroups of 19 OECD high income and 9 OECD middle income countries, as shown in Table 5 indicate that only γ convergences met the statistical test of significance. The speed of γ convergence for the middle income group was almost 5 times faster with its CAGR of -3.18% over -0.64% by the high income group. Both groups displayed substantially fluctuating patterns throughout the period. However, the degree of fluctuation appeared to be greater in the middle income group. For example, the 2013 γ index of 0.87 decreased to 0.49 by 2015, accounting for a majority of reduction in γ index for the middle income group, as shown in Fig. (6).
As for σ convergence, the speed of reduction for the middle income group was very rapid at -1.98%. On the other hand, the σ indexes for the high income group displayed a divergence at + 0.681%. However, the results of statistical test for both groups were not significant..
5. DISCUSSION
The key findings from this research can be summarized as follows. First, the averaged road fatality rate for the total group of 37 countries improved rapidly at the CAGR of –3.22% lowering its rate of 140.79 deaths per million inhabitants in 1994 to 68.51 by 2015 as shown in Table 2. The main reason was that the 28 OECD countries lowered the averaged fatality rate even faster at the CAGR of – 4.01%, offsetting a very slow reduction rate of -1.46% experienced by the 9 Non-OECD countries. The annual reduction rates experienced by the 19 high income OECD countries and the 9 middle income OECD countries were similar at -4.01% and -3.96% respectively, supporting the fast reduction rate realized by the 28 OECD countries.
The improvement patterns shown in Fig. (1) by the total group and four subgroups display the initial period of moderate reduction of the averaged fatality rates from 1994 to 2007, followed by rapid reduction from 2008 to 2012. The final period of 2013 to 2015 displayedstationary movement with very little improvement.
Second, both σ and γ indexes displayed statistically valid convergence patterns for the total group of 38 countries. The speed of γ convergence was about twice faster at -1.369% per year over -0.702% for the speed of σ convergence. Combining reduction of dispersion (σ indexes) with increasing catch-up effect (γ indexes) indicated that substantial differences of road fatality rates among countries lessened reducing the gap between high road fatality risk countries and low road fatality risk countries. This finding appears to support earlier results of Castillo-Manzano et al. [13].
Third, both the 28 OECD and the 9 Non-OECD countries displayed statistically significant σ and γ convergences. As expected, the speed of catch-up for the Non-OECD countries was faster at almost 5 times with -3.483% over -0.703% for the total OECD countries. On the other hand, the speed of dispersion reduction by the OECD group was faster by 1.83 times at -1.252% over -0.681% for the Non OECD group.
| High Income OECD (19) | Middle Income OECD (9) | ||||||||
|---|---|---|---|---|---|---|---|---|---|
| Sigma | Gamma | Sigma | Gamma | ||||||
| 1994 | 1.0000 | 1.0000 | *** | 1.0000 | 1.0000 | *** | |||
| 1995 | 0.9121 | 0.9601 | *** | 0.8432 | 0.9620 | *** | |||
| 1996 | 1.2221 | 0.9711 | *** | 0.9182 | 0.9583 | *** | |||
| 1997 | 1.0757 | 0.9702 | *** | 0.7836 | 0.9250 | *** | |||
| 1998 | 0.8547 | 0.9070 | *** | 0.8904 | 0.8667 | *** | |||
| 1999 | 0.9082 | 0.9596 | *** | 0.9196 | 0.9417 | *** | |||
| 2000 | 0.9725 | 0.9044 | *** | 0.9413 | 0.9333 | *** | |||
| 2001 | 0.8765 | 0.9271 | *** | 0.9278 | 0.9417 | *** | |||
| 2002 | 0.7925 | 0.9114 | *** | 0.9234 | 0.8583 | *** | |||
| 2003 | 0.8268 | 0.9153 | *** | 0.9173 | 0.8167 | *** | |||
| 2004 | 0.8284 | 0.9026 | *** | 0.9690 | 0.8750 | *** | |||
| 2005 | 0.8999 | 0.9193 | *** | 0.8341 | 0.8667 | *** | |||
| 2006 | 0.8981 | 0.8162 | *** | 0.8599 | 0.8083 | *** | |||
| 2007 | 0.9324 | 0.9535 | *** | 0.8310 | 0.7917 | *** | |||
| 2008 | 0.9371 | 0.9412 | *** | 0.8081 | 0.7500 | *** | |||
| 2009 | 1.0105 | 0.9026 | *** | 0.8611 | 0.7417 | *** | |||
| 2010 | 1.1078 | 0.9465 | *** | 0.7464 | 0.8250 | *** | |||
| 2011 | 1.0250 | 0.9447 | *** | 0.7781 | 0.8250 | *** | |||
| 2012 | 1.1904 | 0.9307 | *** | 0.6405 | 0.7417 | *** | |||
| 2013 | 1.1470 | 0.8618 | *** | 0.7498 | 0.8500 | *** | |||
| 2014 | 1.2517 | 0.9412 | *** | 0.8591 | 0.7333 | *** | |||
| 2015 | 1.1635 | 0.8675 | *** | 0.6440 | 0.4917 | *** | |||
| CAGR(%) | 0.69% | -0.64% | -1.98% | -3.18% | |||||
Fourth, the middle income OECD group generated much faster statistically valid speed of catch-up at -3.18% which was almost 5 times faster than -0.64% for the high income OECD countries. However, the speed of dispersion reduction did not meet the statistically test for both OECD subgroups of countries. It is interesting to note that the fast speed of catch-up realized by the 9 middle income OECD countries at -3.18% was nearly equal to -3.483% realized by the 9 Non OECD countries. In other words, fast speed of catch-up by the 18 countries from the two subgroups of Non OECD and middle income OECD countries raised the speed of catch-up for the total group of 37 countries offsetting much slower speed of catch-up displayed by the 19 high income OECD countries.
In summary, catch-up effects displayed by the total group of 38 countries were facilitated by fast speed of γ convergence displayed by 9 middle income OECD countries and by 9 Non OECD countries. Since the subgroup of 9 middle income OECD countries reduced its average road fatality rate fastest at the CAGR of -3.9% while the subgroup of 9 Non OECD countries did reduce its average fatality rate at much slow rate of -1.46%, the fast speed of catch-up may not always be associated with the fast annual rate of improvement in average road fatality rate.
What are some policy implications? Since each one of the four subgroups displayed significant differences in their annual reduction rates in the road fatality rates, as well as in the speeds of σ and γ convergence, policy implications need to be discussed in the context of each subgroup. First, the 28 OECD group realized one of the fastest reduction rates in its road fatality rate. However, the annual speed of γ convergence was one of the slowest among the four subgroups. The annual speed of σ convergence was the second fastest among the subgroups. Interventional policies for this group are to promote competition and cooperation to generate more active ranking changes among them. Publicizing information about periodic ranking changes and cooperating with sharing key lessons of reducing road fatality rate may be a useful beginning.
The 19 high income OECD countries suffer from the same slow speed of γ convergence, as the 28 OECD group. Furthermore, this group also experienced a widening dispersion of fatality rate indicating that the gap between the countries with high fatality rate versus low fatality rate may be growing. Fortunately, however, the annual reduction rate of fatality rate displayed one of the most rapid rates. The policy recommendations for this group should be similar to those recommended for the group of 28 OECD countries. In addition, specific action needs to be taken with respect to widening dispersion of fatality rate. In this regard, it may be useful to identify those countries whose fatality rate may remain stationary or even deteriorating so that some specific customized helps can be provided.
The group of 9 middle income OECD countries appears to be best performer among the four subgroups, as the group displayed the best records in all three output measures of fast annual reduction of road fatality rate as well as in the speeds of σ and γ convergence. The only problem was that its speed of σ convergence did not meet the statistical test of significance. The policy recommendation is to examine the possible reasons for insignificant test results. However, it may have been caused by a small sample size of 9 countries.
Lastly, the group of 9 Non-OECD countries may face the most challenging tasks in making major improvements. The most important issue is that this group realized the slowest annual rate of reduction in its road fatality rate which was only about 37% compared to the reduction rate by the 28 OECD countries. Since this group contains such populous countries like India and Russia, the impact of such low improvement rate would have important negative consequence to the number of road fatality globally. Furthermore, the annual speed of σ convergence was also very slow among the four subgroups. Fortunately, its annual speed of γ convergence was the fastest among the four subgroups. A set of recommendations for this group should include both short-term and long-term measures. It may be that requirements for individual countries need to be established so that customized improvement plan covering medical, socioeconomic, cultural and religious dimensions may need to be developed. The objective may be to reach the same levels of annual improvement rates in fatality rate and in, σ and convergence rates being achieved by the total group of 37 countries within, say, 5 to 7 year.
CONCLUSION
The overall results from this research allow us to conclude that the progress of improving road fatality rates by the selected 37 countries has been successful. Not only the average fatality raties but also country differences of fatality rates substantially reduced during the period of 1994 to 2015. This will become an important step toward meeting the 2030 SDG 11.2 goal providing safe transport system for all.
In addition to policy recommendations discussed in the previous section, the results of this research can provide useful guidelines for individual countries included in this analysis. The results of convergence analysis can help an individual country to identify the most appropriate reference group for a given country in planning the future goal of improving road fatality rate and catch-up speed. The findings from this research indicate that the speed of catch-up among different subgroups of countries varied so significantly. For example, the speed of catch-up in the middle income OECD subgroup was about 5 times faster than the high income OECD subgroup, while the speed of catch-up for Non-OECD countries was about 4.5 times faster than the total OECD countries. Thus, individual countries should be guided by output measures from the appropriate subgroup where they belong rather than from the total group of 37 countries. Since these values represent the average speeds of catch-up for individual countries within the respective subgroups, they should represent minimum targets to be achieved and exceeded by a particular country belonging to that subgroup. The same lesson applies to individual countries to use the annual speed of σ convergence of reducing of dispersion whenever it is appropriate. It would also be useful to consider benchmarking leading countries within the respective subgroup who have achieved outstanding results in their road fatality reduction.
This paper has several limitations. One of the more serious limitations is the fact that this research was limited to only 37 countries in the world leaving out many countries such as China, Brazil, Indonesia, Pakistan and Thailand, just to name a few populous countries without validated data. However, the lack of validated fatality data is expected to be overcome in the future,. Another limitation is that explanation for fluctuating yearly reduction rates for the average road fatality rates during the period the under analysis were left as topics for future research. Still another limitation is that in addition to income categorization, there are several other factors such as urban versus rural, gender, age, vehicles, traffic laws and regulations [32-36] that may yield other important insights. In spite of these limitations, it is hoped that convergence analysis presented in this paper can become an additional analytical tool that can be useful in future studies of road fatalities involving multiple countries.
CONSENT FOR PUBLICATION
Not applicable.
FUNDING
None.
CONFLICT OF INTEREST
The authors declare no conflict of interest, financial or otherwise.
ACKNOWLEDGEMENTS
Declared none.

