All published articles of this journal are available on ScienceDirect.

Technology Learning in Automobile Industry: Comparative Study between Thai and Korean Companies
Abstract
Background:
Currently, the issue of the company’s innovative development is relevant in all areas of activity. Automobile industry, which has one of the development vectors such as an innovative component, poses for itself the task of achieving high competitiveness through active innovative learnings and technology transfer. This direction is influenced by technological factors, which should be taken into account while developing and implementing the company's innovative technology transfer strategy.
Automobile industry in Thailand appears to be a successful story as it plays an important role in the national economy and becomes a car-manufacturing hub of Southeast Asia as called “Detroit of Southeast Asia”. Thailand is a world-class vehicle production base such as Ford, Toyota and Nissan. However, the growth of industry depends on the performance of MNCs, which remains unclear whether Thai automobile industry could sustain the same position with its own technology capability alone.
Aim:
This paper aims to develop the suggesting on the technology learning transfer of automobile industry in Thailand based on Korea’s experience. I analyze the evolution of the automobile industry of Thailand and South Korea to identify the key drivers of auto industry’s development through learning from macro level to the firm level of the two countries.
Objective:
The study aims at investigating technological factors which influence innovative learning development of transport company and evaluating their interdependence using correlation-regression analysis.
Methods:
The correlation-regression analysis and comparative approach were used to develop the model.
Results:
Two automobile corporations from Asian region were investigated. Technological factors influencing learning development of these corporations were found; significant in explaining the factors’ interdependence was discussed.
Conclusion:
Different groups of technological factors influence on innovative learning development of automobile companies in Asia. These findings can be used as information for managers to develop strategic programs to improve knowledge transferring process in Asian automobile companies.
1. INTRODUCTION
According to Hayati (2018) [1], automobile industry is a massive industry that requires a wide range of companies to perform mass production which its performance has high impact on the national economy. Over a century, we have witnessed the transition of world automobile manufacturing across the world from 1910s to present; the onset of automobile manufacturing in Europe, the domination of American automobile industry by Big Three (Ford, General Motor, and Chrysler) since 1910s, the emergence of Europe in 1960s and Asia starting from Japanese in 1970s (Charles, 1989) [2]. According to Guimon (2017) [3], it is important for the catching-up countries to absorb technology from more developed countries in order to close knowledge gaps and transform the process of industrial development to innovation capabilities.
The drive of innovation and high-growth of Japan after postwar influenced the developing countries including the Newly Industrializing Economies (NIEs) of Hong Kong, Korea, Singapore and Taiwan, and the three members of the Association of South East Asian Nations (ASEAN): Indonesia, Malaysia and Thailand, shifted to industrialization (Naya & Imada, 1992) [4]. While many developing countries faced the challenge of industrialization to improve their economy, the automobile industry is one of the key industries that play an important role in the country’s economic development due to its highly capital and technology intensive value chain. (Natsuda & Thoburn, 2011; Saberi, 2018) [5, 6]. For over six decades, the automobile industry has transformed from agricultural economy to a fast-growing manufacturing economy in many developing countries including South Korea and Thailand (Wattanadamring, 2014) [7]. In the initial stage, South Korea and Thailand lacked of technological capability for the production. Governments have played a key role in the evolution of the industry in both countries (Samarnbutr, 2012; Fogel, 2010) [8, 9]. The dynamic development of Korea’s Automobile Industry is one of success story that transform itself from catch-up country to the lead producer. Automobile industry in South Korea proved its capability and ambition to produce its own national cars. Korea pursued and maintained a unique and independent strategy for developing its automobile industry. The independent strategy protected the local firms from the oversea Multinational Corporation (MNCs) to take control the industry. The country invested in R&D for product development and declined management control in joint venture with Multinational Companies (MNCs) (Kim, 1997) [10]. Over two decades, South Korea plays a role as a top ten-car producer in the world (Table 1).
Thailand and South Korea pursued the different strategy in the development of automobile industry since 1960. Over 60 years, both countries have the impressive performance. However, if we compare the two countries, South Korea has developed much further both innovations and technology capability that drives better nation economic situation (Table 2).
| Year | 1983 | 1991 | 2000 | 2005 | 2010 | 2015 | 2017 | |||||||
|---|---|---|---|---|---|---|---|---|---|---|---|---|---|---|
| 1 | Japan | 7,152 | Japan | 13,245 | USA | 12,799 | USA | 11,946 | China | 18,264 | China | 24,503 | China | 29,015 |
| 2 | USA | 6,821 | USA | 8,883 | Japan | 10,140 | Japan | 10,799 | Japan | 9,628 | USA | 12,100 | USA | 11,189 |
| 3 | Germany | 3,878 | Germany | 5,034 | Germany | 5,526 | Germany | 5,757 | USA | 7,743 | Japan | 9,278 | Japan | 9,693 |
| 4 | France | 2,961 | France | 3,610 | France | 3,348 | China | 5,717 | Germany | 5,905 | Germany | 6,033 | Germany | 5,645 |
| 5 | Italy | 1,495 | Spain | 2,078 | Korea | 3,114 | Korea | 3,699 | Korea | 4,271 | Korea | 4,555 | India | 4,782 |
| 6 | UK | 1,045 | Canada | 1,911 | Spain | 3,032 | France | 3,549 | India | 3,557 | India | 4,125 | Korea | 4,114 |
| 7 | Canada | 968 | Italy | 1,844 | Canada | 2,961 | Spain | 2,752 | Brazil | 3,381 | Mexico | 3,565 | Mexico | 4,068 |
| 8 | Korea | 1,497 | China | 2,069 | Canada | 2,687 | Spain | 2,387 | Spain | 2,733 | Spain | 2,848 | ||
| 9 | UK | 1,454 | Mexico | 1,935 | Brazil | 2,530 | Mexico | 2,342 | Brazil | 2,429 | Brazil | 2,699 | ||
| 10 | Mexico | 989 | UK | 1,813 | UK | 1,803 | France | 2,229 | Canada | 2,283 | France | 2,227 | ||
| 11 | Italy | 1,738 | Mexico | 1,684 | Canada | 2,068 | France | 1,970 | Canada | 2,199 | ||||
| 12 | Brazil | 1,681 | India | 1,638 | Thailand | 1,644 | Thailand | 1,915 | Thailand | 1,988 | ||||
| World total | 29,994 | 47,441 | 58,374 | 66,719 | 77,583 | 90,780 | 97,302 | |||||||
| Level | Category | Thailand | South Korea |
|---|---|---|---|
| National level | Annual GDP (M$) | 455,220 | 1,530,750 |
| GDP per capita ($) | 6,593 | 29,742 | |
| Economic growth (2017) | 3,9% | 3,1% | |
| Industry level | Production (2017) | 1,988,823 | 4,114,913 |
| Sales (2017) | 873,506 | 1,798,796 | |
| Car in-use (2015) | 15,490,503 | 20,989,885 | |
| Main product | Pick-up truck | Passenger car | |
| Firm level | Top brand production | Toyota | Hyundai |
| Top brand year sales (2016) | 245,087 units | 768,057 units | |
| Status | Plants for oversea MNCs | Overseas plants |
Thailand’s automobile policy, opposed to Korea, was oriented toward foreign investment. Thailand’s automobile industry engaged in Foreign Direct Investment (FDI) with Multinational Companies (MNCs) to strengthen manufacturing competitiveness even though the industry is entirely controlled by MNCs. The automobile industry is one of the main industries that generate economic value for Thailand. Thailand is a leading regional automobile manufacturer, ranks the first among ASEAN countries.
Although Thailand has sustained consistently on FDI policy and has no own national automobile like the case of South Korea, Thailand has emerged as a Southeast Asian successful country in automobile industry in twenty-first century (Ward, 2009) [13].
2. PROBLEM STATEMENT
This paper selected the automobile industry in Thailand and South Korea for analysis due to the following reasons: (a) the automobile industry in South Korea is one of the key industries that enhanced transformation toward high-industrialized economy. This successful story is considered as an effective blueprint for other developing countries. (b) The Thai automobile industry has developed over six decades in the same period as South Korea; however, the performance is still far behind South Korea. As a result, it is interesting to examine the development and search for the improvement for Thai auto industry in the near future.
This paper aims to develop the suggesting on the development of automobile industry in Thailand based on Korea’s experience. There is analysis of the automobile industry’s evolution of Thailand and South Korea to identify the key drivers of auto industry’s development from macro level to the firm level of the two countries. Later, there is comparison between two countries in order to develop the suggestion for Thai automobile industry.
‘Innovativeness’ is most frequently used as a measure of the degree of ‘newness’ of an innovation. ‘Highly innovative’ products are seen as having a high degree of newness and ‘low innovative’ products sit at the opposite extreme of the continuum. However, little continuity exists in the new product literature regarding from whose perspective this degree of newness is viewed and what is new.
We suggest innovativeness as technological learning process. Finally, there are three sources of technological learning: international source, domestic source and in-house effort. South Korea acquired technology from the international source by exchange the equity share in return for access to technology. For example, 12 percent equity Hyundai transferred to Mitsubishi Motor and Kia gave 20 percent to Ford in order to access the technology (Kim, 1997). However, in the case of Daewoo, a joint venture with GM made a significant performance in the beginning. However, without management control, Hyundai cannot develop its own product to meet the market needs. Daewoo had shifted to independence strategy and increased the performance. Thailand similarly to Daewoo, joint venture with foreign MNCs limits local firms’ performance. This affected indirectly in developing the technological capability.
This study is based on two research questions:
- How do technological factors affect the innovative learning development of automobile company?
- How do factors interdepend themselves?
- What is the level of adaptability of the Thai-derived insights in automobile industry?
- What is the opportunity of technological advancements spur into other developing economies?
3. TECHNOLOGY LEARNING DEVELOPMENT IN AUTOMOBILE INDUSTRY: LITERATURE REVIEW
3.1. Technology learning
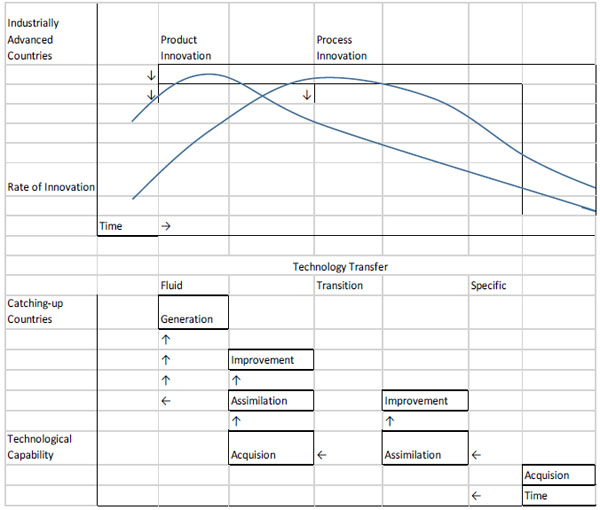
The technology trajectory of advanced countries shows the technological impact upon product and process development of the industries (Kim, 1997; Gallivan, 2010) [14, 15].
On the other hand, the technology trajectory of catch-up countries follows the phases of acquisition, assimilation, and improvement. Lacking local capabilities, firstly catch-up economies acquire packaged foreign technologies mostly doing assembly operations on those technologies requiring engineering skills; next the diffusion and assimilation of imported technologies proceeded by local firms, requiring engineering and limited development skills; and finally applying this borrowed and assimilated technology and capability to different product lines and applications result into improvement. While the firms in catch-up countries repeatedly develop from acquisition to improvements, their capabilities gradually increase from duplicate imitation to creative imitation. It eventually reaches to the innovation at generation stage. The firms’ technological capability now is abundant to generate emerging technologies in the fluid stage and considered as the advance countries (Kim, 1997) [16].
Strengths in the SWOT analysis of Asian Automobile industry:
- Evolving industry: Automobiles represent freedom and economic growth.
- Continuous product innovation & technological advancement: Companies are increasing R&D expenditure to drive the next phase of growth through use of renewable sources of energy which may be solar, wind etc. (Y.E. ChoongYeol et al, 2016) [17].
- Growth shifting to Asian markets: Although American & European market is the pulse of this Industry, but the focus is shifting to developing markets like China, India & other Asian nations because of the rise in disposable income, changing lifestyle & stable economic conditions (H. Marcus, 2012) [18].
- Increasing demand of VFM vehicles: Intense competition in the matured/developed markets has forced automobile manufacturers to target developing economies.
- Manufacturing facilities to control cost: In order to control cost & to manage shrinking margins automobile companies.
Weaknesses in the SWOT analysis of Asian Automobile industry:
- Cars recalled: Controversies relating to recalling vehicles on account of some technical dis-functionality or non-abidance to govt. led rules is becoming very common.
- Bargaining power of consumers: over the last 3-4 decades the automobile market has shifted from demand to supply market (Propharma Group, 2019) [19]. Availability of large number of variants, Stiff competition between them, and long list of alternatives to choose from has given power to customers to choose whatever they like.
- Growth rate of Automobile industry is the in the hands of the government due to regulations like excise duty, no entry of outside vehicles in the state, decreasing number of validities of registration period & volatility in the fuel prices (Komolavanij, 2011) [20]. These factors always affect the growth of the industry.
Opportunities in the SWOT analysis of Asian Automobile industry:
- Introducing fuel-efficient vehicles: optimization of fuel-driven combustion engines and cost efficiency programs are good opportunities for the automobile market.
- Strategic alliances: By using specialized capabilities & partnering with other companies, they can differentiate their offerings (Pojani and Stead, 2015) [21].
- Changing lifestyle & customer groups: Three powerful forces are rolling the auto industry. Shift in consumer demand, expanded regulatory requirements for safety and fuel economy, and the increased availability of data and information.
- Market expansion: Entering new markets like Asian & BRIC nations will result in upsurge in demand of vehicles.
Threats in the SWOT analysis of Automobile industry:
- Intense competition: Presence of such a large number of players in the Automobile industry results into extensive competition, every company eating into others share leaving little scope for new players.
- Volatility in the fuel prices: At least for the passenger segment fluctuations in the fuel prices remains the determining factor for its growth (S. Komolavanij, 2011) [22].
- Sluggish economy: Macroeconomic uncertainty, recession, un-employment etc. are the economic factors which will daunt the automobile industry for a long period of time.
- High fixed cost and investment in R&D: Due to the fact that mature markets are already overcrowded, industry is shifting towards emerging markets by building facilities, R&D centers in these markets. But the ROI out of these decisions is yet to be capitalized (Cohen, 2006) [23].
Fig. (1) shows the integration of the two technology trajectories and corresponding movement from duplicative imitation to innovation.
According to Kim (1997), there are three major sources of technology learning; international community, interaction with domestic community, and in-house efforts at the firm level.
- International source of technology: It is the important source for catching up countries where the technological capacity is still low. It could come in the form of foreign direct investment, foreign licensing, turnkey plant transfer, purchase of capital goods, and migration of technical personnel (Kim, 1997).
- Domestic sources: The linkages within the community include universities, research institutes, other firms, and other support systems accelerate the technological technology.
- In-house efforts: The source is learning-by-doing, own R&D efforts, and production experience. R&D activities will enable firms to be aware the new external signal and information.
According to Kim (1997), there are two important factors to productive technological learning: Existing knowledge base and the intensity of effort, which can indicate the four types of dynamic technological capability.
- High intensity of efforts with high existing knowledge base will rise the technological learning rapidly.
- Low intensity of efforts with high existing knowledge base will lead the technological capability high but fall eventually.
- High intensity of efforts with low existing knowledge base will rise technological capability slowly.
- Low intensity of efforts with low existing knowledge base rise the technological capability slowly but fall rapidly.
3.2. Development Trends in Thai Automobile Industry
Thai automobile industry has a competitive advantage over the other developing countries in terms of complete supply chain. From the upstream raw auto component materials to downstream automotive assemblers, including the manufacturing processes can be completed domestically with low manufacturing cost (Komolavanij & Jeenanunta & Ammarapala, 2011) (Table 3).
Source: Kim (1997)
| Type | Complete Knock-Down (CKD) | Complete Build-Up (CBU) | ||||||
| Before 1992 | 1992 | 1999 | 2000-2008 | Before 1992 | 1992 | 1999 | 2000-2008 | |
| Pick-up truck | ||||||||
| Tariff rate | 72 | 20 | 20 | 30 | 120 | 60 | 60 | 80 |
| Excise tax | 9 | 3 | 5 | 18-3 | 9 | 3 | 5 | 18-3 |
| Passenger cars under 2,400 cc. | ||||||||
| Tariff rate | 112 | 42 | 20 | 30 | 180 | 42 | 80 | 80 |
| Excise tax | 44-55 | 30 | 40 | 30 | 44-55 | 30 | 35 | 30 |
| Passenger cars over 2,400 cc. | ||||||||
| Tariff rate | 112 | 42 | 20 | 30 | 300 | 68.5 | 80 | 80 |
| Excise tax | 44-55 | 35 | 43-50 | 44-55 | 44-55 | 35 | 43-50 | 35-50 |
Thai government move toward export-oriented Industry since 1970s by issuing the policy under the 4th (1977-1981) and 5th (1982-1986) National Economic and Social Development Board Plans [24]. The Thai government emphasized enhancement of the export capacity of the automobile industry resulting the first exports of 488 PVs and 40 buses to Canada by MMC Sittipol in 1987 (Natsuda & Thoburn, 2011) [25]. However, the localization caused low market competition. Therefore, the products with high price and low quality could not be exported. One of the major factors was a balance of trade deficit during the oil crisis. World Bank played an important role in export strategy. The political changes made the policy unstable. The local contents were changed and there were different opinions among assembly firms on the increasing of local contents (Siroros, 1997) [26]. During this period, the Thai automobile industry was still highly protected (Tables 4-8). Thai economy grew at an average rate of 10 percent between 1987 and 1990, and automobile demand continued to expand rapidly. The Thai auto industry was on the process of transition from domestic-oriented production toward liberalization (Natsuda & Thoburn, 2011).
| Rate | Hyundai | Kia Motors | GM Korea | SsangYong Motor | Renault Samsung Motors |
| Employment (persons in 2015) | 66,404 | 34,121 | 16,236 | 4,773 | 4,220 |
| Production (thousand units) | 1,680 | 1,557 | 580 | 156 | 244 |
| Domestic Sales (thousands units) | 648 | 528 | 167 | 102 | 111 |
| Exports (thousands units) | 1,009 | 997 | 416 | 52 | 146 |
| Oversea Production (thousand units) | 3,186 | 1,467 | - | - | - |
| х1, % | х2, % | х3, % | х4, % | х5, % | х6, % | y, % |
| 145,16 | 116,67 | 105,04 | 123,16 | 96,28 | 133,33 | 158,93 |
| 138,89 | 125,86 | 104,25 | 123,16 | 99,61 | 133,33 | 154,74 |
| 158,82 | 116,13 | 108,53 | 102,55 | 94,09 | 200,00 | 174,92 |
| 161,76 | 120,34 | 113,41 | 102,55 | 97,02 | 150,00 | 169,60 |
| 163,64 | 129,63 | 105,02 | 102,55 | 96,28 | 150,00 | 162,72 |
| 161,76 | 114,29 | 105,43 | 100,45 | 97,45 | 150,00 | 149,76 |
| 160,61 | 118,33 | 105,86 | 100,45 | 94,79 | 180,00 | 158,92 |
| 158,82 | 120,34 | 104,62 | 123,16 | 90,09 | 200,00 | 162,37 |
| 158,82 | 118,64 | 104,63 | 100,45 | 96,28 | 220,00 | 164,01 |
| 154,29 | 120,00 | 105,43 | 100,45 | 99,68 | 137,50 | 144,83 |
| 158,82 | 112,90 | 105,02 | 100,45 | 97,34 | 137,50 | 164,93 |
| 158,82 | 120,63 | 105,02 | 88,07 | 97,40 | 122,22 | 141,41 |
| х1, % | х2, % | х3, % | х4, % | х5, % | х6, % | y, % |
| 133,33 | 79,93 | 102,92 | 137,92 | 83,93 | 214,29 | 105,26 |
| 133,33 | 322,70 | 100,00 | 137,92 | 82,73 | 187,50 | 95,24 |
| 133,33 | 322,70 | 101,87 | 133,64 | 83,15 | 214,29 | 95,45 |
| 133,33 | 322,70 | 102,91 | 133,64 | 84,82 | 200,00 | 110,53 |
| 133,33 | 322,70 | 104,38 | 99,95 | 80,60 | 180,00 | 110,00 |
| 133,33 | 322,70 | 103,57 | 95,41 | 81,38 | 180,00 | 104,76 |
| 133,33 | 322,70 | 104,17 | 98,96 | 84,06 | 190,00 | 110,00 |
| 133,33 | 322,70 | 104,38 | 104,71 | 84,78 | 158,33 | 114,50 |
| 133,33 | 322,70 | 104,38 | 106,13 | 82,18 | 146,15 | 113,93 |
| 133,33 | 322,70 | 104,80 | 106,13 | 88,14 | 146,15 | 115,50 |
| 133,33 | 322,70 | 104,79 | 106,13 | 85,34 | 142,86 | 114,93 |
| 133,33 | 322,70 | 104,79 | 99,63 | 87,83 | 140,00 | 115,00 |
| х1 | х2 | х3 | х4 | х5 | х6 | y | |
| х1 | 1 | ||||||
| х2 | -0,15181 | 1 | |||||
| х3 | 0,31946 | -0,09440 | 1 | ||||
| х4 | -0,67534 | 0,17756 | -0,19920 | 1 | |||
| х5 | -0,37142 | 0,11928 | -0,02638 | -0,27355 | 1 | ||
| х6 | 0,35192 | -0,14191 | 0,05150 | 0,06001 | -0,67927 | 1 | |
| y | 0,21398 | -0,10595 | 0,48922 | 0,21665 | -0,28447 | 0,57061 | 1 |
| х1 | х2 | х3 | х4 | х5 | х6 | y | |
| х1 | 1 | ||||||
| х2 | -0,08704 | 1 | |||||
| х3 | -0,25128 | 0,14331 | 1 | ||||
| х4 | 0,24415 | -0,45670 | -0,80464 | 1 | |||
| х5 | -0,48877 | 0,01991 | 0,36031 | -0,06389 | 1 | ||
| х6 | 0,38279 | -0,44964 | -0,66855 | 0,67729 | -0,45325 | 1 | |
| y | -0,25999 | 0,15206 | 0,91458 | -0,65275 | 0,49744 | -0,74605 | 1 |
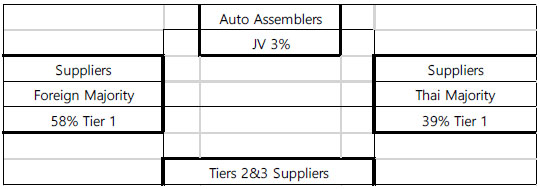
According to Board of Investor (BOI), the structure of Thai automobile industry in Thailand comprises of auto assemblers and component parts firms into three levels. Component parts firms are classified to tier1 suppliers, tier2 suppliers, and tier3 suppliers. Tier 2 and tier3 suppliers produce raw materials and small auto parts for tier 1 firms. Tier 2 firms are suppliers of auto parts to tier 1 firms, whereas tier 3 firms are suppliers to tier 2 firms. Tier 1 firms are Original Equipment Manufacturer (OEM) suppliers that send auto parts directly to the assemblers to finish the car manufacturing process.
In 2017, there are 18 car assembly firms, which are all joint ventures from MNCs. The component part firms comprise of 710 Tier1 auto parts suppliers, and over 1700 Tier 2 and 3 suppliers’ firms (Fig. 2).
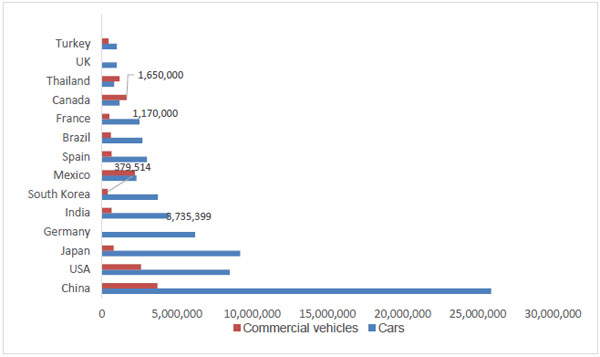
Over 50 years, Thailand has proved its potential on a fast development of automotive manufacturing and become a leading global automotive production base in the Association of Southeast Asian Nations (ASEAN). Thailand has developed from an assembler of auto components into a top automotive manufacturing and export hub. Its performance in 2017 achieved more than 1.98 million vehicles produced and worth USD 27 billion in 2017. These successes also ranked the country as the 1st rank of automobile producer in Southeast Asia, the 6th rank of commercial vehicle producer and 12th ranking in automobile producer in the world in 2017 (Fig. 3).
3.3. Development Trends in Korean Automobile Industry
South Korea entered the auto industry since 1960s and becomes a world leading carmaker over a decade. In 2017, South Korea produced 4.1 million vehicles, ranking 6th of the world auto producer (Table 1). The rise of China affected Korea fall to 6th place between 2002 and 2004. However, until present, though domestic production has stalled, the trends of production and export are steadily increasing as the Korean automotive industry expanded its overseas production recently and more toward the qualitative growth (KRC, 2014) [29]. The summary of current performance of Korean automobile industry is shown in the Table 4.
According to Shvetsova (2018) [30], during 1950s, the Korean government enacted the Foreign Capital Inducement Act (FCIA) to introduce FDI in South Korea. The purpose of supporting FDI is to solve the balance-of-payment difficulty and FDI is a good technological source. FDI first engaged in the light manufacturing export sector, protected by import substitution measures because the Korea government feared that the economy would be dominant by foreign firms. Moreover, the Korean government wanted to channel the limited amount of capital resources to industries vital to long-term economic growth. (Kim & Hwang, 2000). For this reason, Korea shifted the interest to pursue a unique and independent strategy of developing its industries from multinational firms (Kim, 1997).
Korean automobile Industry started before the liberation from Japan in 1960s. The increase of used military vehicles during the war raises the repair firms. The experience Korean workers were important assets as an important resource for development of Korean automobile industry. Local automobile parts production factories such as Daewon Global and Yoosung were established in 1953. Sibal is the first Korea-made assembled car with used parts. 7 Sibal cars were produced in 1955 and raise to 459 units in 1957. However, many studies counted the Korean auto production started with Knockdown (KD) assembly with a significant production in 1962 (Dimitriou and Gakenheimer, 2011; Cho & Kim, 2014; Kim, 1997) [31, 32].
4. METHODOLOGY
To assess the impact of technological factors on the learning development of company I use the model of multiple regressions, representing a set of factors (x) that affect the score (y). At the same time, it is necessary to consider that factors can be dependent among themselves, therefore, an analysis is carried out for the presence of multicollinearity factors, which allows determining the factors excluded from the model.
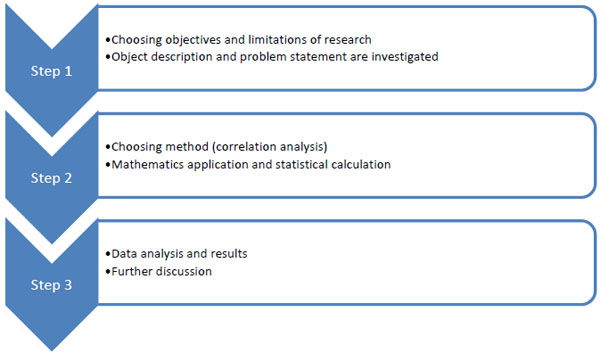
The methodology concept consists of several steps and they are shown in Fig. (4).
Source: Board of Investment, 2017
For the study, the resultant indicator was chosen as the percentage of technology transfer in automobile industry. The following factors were presented alternatively:
- The percentage of personnel engaged in research activities (the “personnel” factor),
- The turnover ratio of the advanced capital (the “assets” factor),
- The availability of innovative technologies (the “technology” factor),
- The technology transfers turnover of automobile industry in the country (the “competition” factor),
- The financial stability factor (the “financial” factor),
- The volume of public investment in innovation (the “economic conditions” factor).
Model building begins with data collection and further processing. I consider that the factors have different units of measurement, so, it is necessary to bring them to a single scale: for each indicator I calculate its growth rate (unit of measure is percent).
To build the model, the Microsoft Excel analysis package “Regression” and “Correlation” is applied. It is assumed that there is a linear relationship between the factors of the model and the resultant characteristic. I can build multiple linear regression model (Eq. 1).
 |
(1) |
where
x1, x2, …, xn - model factors,
y - resultant indicator,
b1, b2, bn - model parameters,
ε - model error.
The model parameters show the average change in y as a result of a change in one of the factors in the model, it means that other factors are not subject to change. To analyze the parameters of the model, the least squares method is used. On the basis of the least squares method we estimate the model parameters: the sum of the squares of the effective characteristic deviation (y) from the calculated values of the variables (ŷxi) will be minimal. It should also be noted that the parameters of the model a, b1, b2, bn are random variables; therefore, to obtain more accurate results for the least squares, we submit the Gauss-Markov conditions [32]. These conditions tell that
- The mathematical expectation of a random deviation should be 0 for any observation,
- The variance of random deviations is constant (check for homo- and heteroscedasticity),
- There should be no autocorrelation in the model.
The next step is to analyze the regression statistics, which reflects the four indicators of R. R2 is additional indicator for model’s evaluation. It has 3 types:
- R2 (reflects the quality of the model),
- Multiple R2 (shows the degree of dependence between the effective indicator and the factors of the model),
- Normalized R2 (R2, adjusted for the sample size),
- Standard error (reflects the spread of data in the sample).
To test the equation for statistical significance, Fisher's F-criterion is used. We can compare the values of sample variances of two independent samples (the calculated and tabulated values are compared and then the conclusion is made about the reliability of the constructed equation). The calculated value of the F-test of Fisher is found (Eq. 2):
 |
(2) |
where
r_xy^2 - the determination coefficient;
n - the number of observations in the study.
If the table value of Fisher's F-test is greater than the calculated one, then the model is considered insignificant, and the constructed equation is unreliable.
For further model’s evaluation, the author uses analysis of the determination and correlation coefficients. Previously, it was noted that the factors of the model can be dependent among themselves; therefore, it becomes necessary to analyze the pair correlation coefficients. Two factors of the model have a linear dependence if the coefficient of pair correlation exceeds the value 0.7. To assess the practical significance of the multiple regression equation, the coefficient of multiple correlation and determination is used. The coefficient of multiple correlations varies from 0 to 1: a less close relationship is reflected at a value close to 0. As for the multiple determination coefficients, the author uses it for regression quality analysis: if the coefficient value is close to 0, a conclusion is drawn about the low quality of the regression.
A deeper analysis of the interdependence of the factors in the model can be carried out by checking for the presence of multicollinearity factors (χ2 criterion). If there is multicollinearity between the factors, this negatively affects the quality of the model and makes it difficult to assess the influence of factors on the outcome. To determine the value of the χ2 criterion, a matrix consisting of paired coefficients and model factors correlation suspected of having multicollinearity is used. The next step is the calculation of the matrix determinant and the criteria’s value, after which the obtained value is compared with the table value: if the tabulated value exceeds the calculated one, it means absence of a connection between the model factors.
If result of the analysis requires us to correct the model, variables that negatively affect its quality are excluded from it. After that, the partial coefficients of elasticity and correlation are calculated. Partial coefficients of elasticity show which growth of the effective characteristic can be expected with an increase in the individual factor of the model by 1%. The partial correlation coefficients are used to determine the influence of each individual factor without taking into account the influence of other model factors. The range of this coefficient is from -1 to 1: if the value of the module coefficient is close to 1, a stronger dependence of the effective characteristic on this factor is observed. If the coefficient takes a negative value, there is an inverse relationship between the indicators.
5. DATA ANALYSIS AND RESULTS
The construction of correlation-regression models for automobile companies “Hyundai Corporation” and “Thai Rung Union Car Public Co. Ltd” (TRU) was started with sampling according to annual, statistical and financial reports in open access [33].
Variable models were coded as follows:
x1 - the percentage of personnel engaged in research activities,
x2 - the volume of public investment,
x3 - the availability of innovative technologies,
x4 - the financial stability factor,
x5 - the turnover ratio of the advanced capital,
x6 - the availability of innovative compounds,
y - the technology transfers turnover of automobile industry in the country.
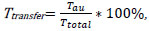
The percentage of personnel engaged in research activities was defined as the ratio of the employees’ number engaged in R&D in the company to the employees’ total number of the company. The volumes of state investments in innovative activities of companies were presented in the amount, where they are defined in investment programs in 2017-2018. the technology transfers turnover of automobile industry in the country (Ttransfer) (this indicator was submitted within the fact that TRU and Hyundai Corporations are monopoly companies in the automobile transport sector in South Korea and Thailand, respectively) was determined (Eq. 3):
 |
(3) |
where Ttransfer- technology transfer turnover on the automobile industry, Ttotal - technology transfer turnover in the country by all industries.
The coefficient of financial stability (Kfs) was calculated (Eq. 4):
 |
(4) |
where C - company's equity, D - company's debt obligations, A - company's assets.
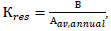
The coefficient of resource productivity (Kres) of these companies is calculated (Eq. 5):
 |
(5) |
where В - the revenue of the company, Аav,annual - the average annual value of the company's assets.
The presence of innovative compositions is considered as the number of innovative technologies on the enterprise’s balance at the end of each month in 2017-2018.
Thus, the processed data for the construction of correlation-regression models of companies are presented in Tables 5 and 6.
Following the developed method, the author checks the statistical significance of the model and does the analysis of regression statistics. According to the results of the analysis, it was revealed that the models of both companies reflect a high dependence of the effective indicator on the model factors.
The coefficient of multiple correlation for the Hyundai is 0.79, for TRU - 0.96, it means in this case, that there is an almost linear dependence.
Regarding the coefficient of determination, in the case of Hyundai (Model 1), 63% of the variation is due to the selected factors of the model, in the case of TRU (Model 2), 91% of the variation is predetermined by the model variables. The standard error in the Model 1 is quite high (8.9), which indicate a low quality of this model. In other hand, Model 2 has a relatively low standard error of 2.87, which indicates a higher quality of this model.
Thus, based on the results of the regression analysis, multiple regression equations for both companies were constructed (Eq. 6 and Eq. 7).
 |
(6) |
 |
(7) |
We get the results after assessing the quality of the regression models using the Fisher F-test. We found that for Hyundai the calculated value was 1.41 with a tabular value of 4.95. Since the tabular value exceeds the calculated value, the Model 1 is considered statistically insignificant. For the TRU the tabular value is the same (4.95) because of an equal number of observations, and the calculated value of the criterion is 12.75, which is much higher than the tabulated value, therefore, the Model 2 is significant and reliable.
Since the Model 1 was found to be unreliable, it is necessary to make its adjustment. This result indicates that the model includes factors that have little effect on the company's innovative development. To determine the factors to be excluded from the model, it is necessary to analyze the correlation coefficients (Table 7).
Table 7 shows that the most significant effect on the percentage of technology transfer in automobile industry is provided by the factor “availability of innovative compounds” (correlation coefficient is 0.57). In Model 1, factors x1, x2, x4 and x5 are excluded due to their least or negative impact on the result. Thus, the new equation has the following form (Eq. 8):
 |
(8) |
When the Fisher criterion value is recalculated for the new equation, the actual value is 5.23, which is higher than the table value and indicates the significance of the Model 1.
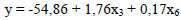
To analyze the correlation coefficients in the Model 2, the data are presented in Table 8.
Table 8 shows that the factor x3 (the availability of innovative technologies) has the greatest effect on the percentage of technology transfer transported by innovative compounds, the correlation coefficient is 0.91. It is necessary to pay attention on the paired coefficients between the factors x3, x4, x6, since multicollinearity is possible. To check for this phenomenon, the criterion χ2 is used. Based on the results of calculations, the value of this criterion was 12.4 with a tabular value equal to 9.48. Since the calculated value exceeds the tabulated value, I can make a conclusion that there is a presence of multicollinearity factors in the model 2. The elimination of the factors x4, x6 allowed the transformation of the multiple regression equation (Eq. 9).
 |
(9) |
Verification of the model for Fisher's adequacy also showed that the model 2 is statistically significant.
In order to determine to what extent the resultant is dependent on a particular model factor, the author uses the partial correlation coefficients calculation (Eq. 10).
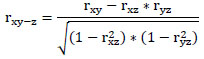 |
(10) |
Based on the results of the calculations, it was revealed that the technology transfer development of Hyundai is more affected by the presence of innovative compounds that represent the “technology” factor (the coefficient of the private correlation is 0.63). In the case of the TRU, the indicator ” the technology transfers turnover of automobile industry in the country “, which represents the “competition” factor, has the greatest influence (the value of the coefficient of the private correlation is 0.92).
6. DISCUSSION
Among ASEAN region, Thailand officially entered the auto industry with the industrial promotion policy since 1960. Over the six decades, Thai automobile has overcome the financial crisis in 1997 and withdrawn the local content requirement during labialization period. Recently, Thailand turns itself to become the car production hub in Southeast Asia with the support from foreign MNCs. This can explain how Thailand remains the dominant car manufacturer in the region and far ahead Indonesia, the second rank producer. According to Vasconcellos (2013) [34], the current situation of Thai automobile industry would be difficult to shift toward the path of building its own car and give a case of Singapore as a successful auto industry without the “nation” car strategy.
However, the dynamic growth rate of automobile industry in other ASEAN countries such as Indonesia and Malaysia in recent years can cause long-term negative affect to Thai auto industry. Firstly, under the dependent policy, the management of Thai automobile industry relies on the foreign MNCs. B. Sawik (2017) [35, 36] suggests, that recently, many foreign auto firms increase the investment more in other ASEAN countries. This indicates that Thailand is losing its competitiveness to its neighbor countries. Secondly, Thailand is not ready to adopt independent strategy as R&D in Thailand is still in an embryonic stage. In addition, Thailand still requires technology learning from abroad through the joint-venture firms. It is obvious that Thai automobile industry cannot stand alone without the Joint Venture. As a result, obtaining the current strategic plan might not prevent the overturn the competitiveness of Thai automobile industry among ASEAN countries in the future.
Technology suppliers were willing to transfer technology to South Korea in the automobile industry through foreign direct investment and foreign licensing. However, later Korea faced the restriction from the advance countries. The informal technical assistance was applied for reverse engineering and leads to the innovation. South Korea was able to acquire foreign technologies. As a result, South Korea gains the capacity through technology transfer from foreign source. However, Thailand with the low absorptive capacity had let the MNC as a technology supplier takes advantage to expand their market through FDI and become dependent on FDI [37].
Korea moved toward the independent operation with in-house effort. The technology transfer from foreign technology can raise the knowledge level and jump in indigenous learning with a strong bargaining power. One example is the performance between Hyundai toward independent strategy giving a dynamic long-run learning and Daewoo with Joint venture showing the rapid initial learning but not for long run.
Thailand chose the Joint ventures with foreign MNCs. Thai are also unaggressive technology learning. This result Thailand learning technology through the parent firm’s strategy and become dependent on FD [38, 39].
For domestic source, the strong and centralized Korean government drove the effective industrial policy. Korean government-imposed crises with providing support. Moreover, the establishment of a science and technological information center made a linkage network in the industry resulting in technology diffusion. In Thailand, the role of government and support organization for technological learning still leans on FDI.
In-house Efforts, Korean firms acquired and assimilated foreign technology primarily through imitative engineering and move toward the direct R&D investment. For example, Hyundai increased its R&D investment from 4.4 percent of sales in 1994 to 7 percent in 1995 and beyond (Kim, 1997). In Thailand, the firm’s R&D activities are controlled under the management of Joint Venture for develop a more efficient function of part product [40].
CONCLUSION
The conducted research proved the significant influence of technological factors on the technology transfer of automobile companies. The correlation dependence between the factors influencing the technology transfer development of automobile companies was also established.
As for the Thai automobile industry, when adjusting its strategy of technology transfer development, it is necessary to understand such a highly influential factor as “technology transfer turnover of automobile industry”. It enhances the mobility of the ever-growing investment in Thailand, thus increasing the volume of technology transfer will positively influence the development of the whole country. So, it means that technological and economic factors are very important for innovative development of Thai automobile industry.
The results of the conducted research confirmed the development trends of the automobile industry in the Asian region. Therefore, a comparative analysis of automobile companies of Thai and South Korea became especially interesting for studying.
- According to the development of Korean automobile industry, Korean started the initial phase with full dependence on imported technology and foreign engineering. This stage will gain skill workers. Korea transfer industrial activity from the government to private sector. At this stage, technology will be diffused quickly and result in emergence of the industry. From assimilation of imported to improvement and lead to innovation. This will let the country introduce its own model and became one of the leading automobile exporters in the world.
- Thailand is in the assimilation stage, the middle phase of technology trajectory in developing country. Thai auto industry is far from independent, as Japanese firms are the real player who controls the production. In order to crossover to the next step, Improvement stage, Thailand needs technology diffusion and developing related product without direct transfer of foreign technology. Once Thailand reaches the improvement stage and will eventually generates their own production. From this point, the country can move innovation phase forward to Technology trajectory in advance country.
- In shorts, Thailand needs the following sources of technology:
- International Source: shift to independence strategy without foreign management control such as licensing, alliances;
- Domestic Source: Government should have strong support industry and enhance competence of local firms for technology diffusion and improvement
- In-House Efforts: perform R&D activities for raising technology capability and lead to innovation. Change the firm culture to be aggressive learning.
These results can be used to make managerial decisions in the process of forming the automobile industry innovative development strategy.
LIMITATIONS AND FUTURE RESEARCH ORIENTATIONS
There are some limitations of this research:
- This research is based on one project – technology knowledge transferring between Korean and Thai companies;
- Only automobile industry from two countries is discussed;
- The period of the survey – last 5 years;
- The scope of this survey is focused on automobile industry.
For future research it is necessary to discuss three typical technological learning patterns in automobile industry. First, local companies gain technology support from multinational companies through establishing joint ventures, with the aim of realizing technological learning through assembly manufacturing, e.g., Shanghai Volkswagen. Second, local companies develop professional R&D center with multinational companies after establishing joint ventures with them, which provides support and guarantee for the production and operation of the joint ventures, e.g., Shanghai GM and PATAC. Third, with the development of self-owned brands, local companies attempt to completely merger multinational companies or buy out the whole technology, aiming to improve technological innovation capabilities through independent innovation and integrating innovation resources, e.g., SAIC Motor's acquisition of Rover. The future research may consider the quantity and quality of self-owned brand products, the promotion of technological innovation capabilities, and the intellectual property right of the enterprises as the main criteria, making a comparison of the three kinds of technology learning patterns, which aims to explore more effective technology learning models.
CONSENT FOR PUBLICATION
Not applicable.
FUNDING
This study received research funding (2019) from Korea University of Technology and Education (KOREATECH).
CONFLICT OF INTERESTS
The author declares no conflict of interest, financial or otherwise.
ACKNOWLEDGEMENTS
Special thanks to Ms. Patchara Tanubamrungsuk, PhD student at School of Industrial Management, Korea University of Technology and Education for overall help and providing all the required information.

