All published articles of this journal are available on ScienceDirect.

The Strategic Positioning of Moroccan Seaports: An Application of the Boston Consulting Group Growth-share Matrix
Abstract
Background:
Under the current challenges of global and regional changing environments in the seaport industry faced by market players and the increase of competition among port business entities, the necessity of pursuing a competitive strategic positioning by strategic business units is a compulsory plan to ensure constructive and sustained growth.
Aims and Objectives:
In this context, the purpose of this study is to analyze the competitive position of the eight (largest, most important, busiest) seaports of Morocco in the four-years period from 2014 to 2017 using a dynamic portfolio analysis known as the Boston Consulting Group (BCG) matrix. This study aims to overcome the regional challenges that have a substantial impact on seaport activities by highlighting competitive strategic positioning, which will enable seaport operators to visualize the position of selected ports, monitor their progress, and predict the future trends of the studied ports.
Results:
The finding reveals the competitive strategic positioning of analyzed ports is varying over the studied period.
Conclusion:
The Tangier MED, Jorf Lasfar and Casablanca ports were found to be stars in 2017, while in 2015 they had a combined position of stars and cash cows. Other studied seaports were found to be in an unfavorable strategic position.
1. INTRODUCTION
The surge necessity of seaport terminal operations for the development of the global and regional economy reveals the need for port authorities, terminal operators, shipping lines, and port users to adopt more strategic decision-making processes. They should build a conceptual understanding of the dynamics of seaport competition and perform strategic positioning analyses. Thus, exploring and evaluating strategic positioning plays a key role in sustainable development, transformation, and upgrading of ports [1]. Considering it, this study presents a strategic analysis tool known as the BCG matrix, which helps describe the evolution of a port’s competitive position in terms of growth and market. It is an important tool used in the literature to visualize the dynamics of the market. The matrix is employed to differentiate the competitive position of each port on the basis of market growth rate and market share [2].
At present, the research methods of port competitiveness are mainly quantifiable such as the balanced theory of port competitiveness [3], and the research components involve regional port development path [4], container terminal port efficiency [5-8], hinterland competitiveness [9], and maritime competitive advantage [10-11]. Some of the research studies discussed port competitiveness through the use of multiple managerial tools. For example, the “Gini coefficient” (sometimes called an index) is a statistical measure of distribution and one of the most common techniques for measuring income distribution or, less commonly, wealth distribution among a population [12, 13]. It has since been used in several industries to assess or compare concentrations of maritime and air traffic over time and across space [14].
Another effective technique that determines the level of competition among different players in a market is called the Herfindahl–Hirschman Index (HHI). This index provides a good representation of the concentration ratios in a port system environment. The HHI measures the degree of concentration in industry and is calculated by squaring the market share of each company competing in a market, and then summing the resulting numbers. The HHI can range from close to zero to one. A higher HHI indicates less market competition [15]. Endorsed for its efficiency and feasibility, the HHI has been widely used in scientific researches to assess rivalry in several port markets on a global scale [16, 17].
The BCG matrix is more suitable than other methods [18] since it allows rivals to easily map their market positions via measurements of their business growth rate and relative market share [19]. The BCG matrix is a four-cell matrix providing a graphic representation for an organization to analyze various businesses portfolio on the basis of their related market share and growth rates. It is a two-dimensional analysis of the management of Strategic Business Units (SBU’s) [20]. In other words, it is a comparative analysis of business potential and the evaluation of environment. According to this matrix, businesses can be categorized as high or low regarding their market growth rate and relative market share.
In this research, the BCG matrix is used to observe the dynamics between the major ports in the Kingdom of Morocco during 2014 and 2017. Thus, the following section will introduce the characteristics of assessed ports, followed by a literature review on port efficiency. In the third section, our research methodology will be explained by exploring the BCG matrix framework. The empirical results and analysis will be presented and discussed in the fourth section. The final section summarizes the findings and provides recommendations accordingly.
2. MOROCCAN SEAPORTS BACKGROUND
Under the agenda of a national strategy launched in late 2012, Morocco aims to increase the number and competitive positions of its seaports, which will enable it to strengthen trade relations with its main trade partners and position itself as an economic gate to the African continent. Morocco is investing significantly in its port infrastructure, as around 98% of Morocco’s external trade currently takes place via ports, and maritime traffic with its economic partners is on an upward trajectory.
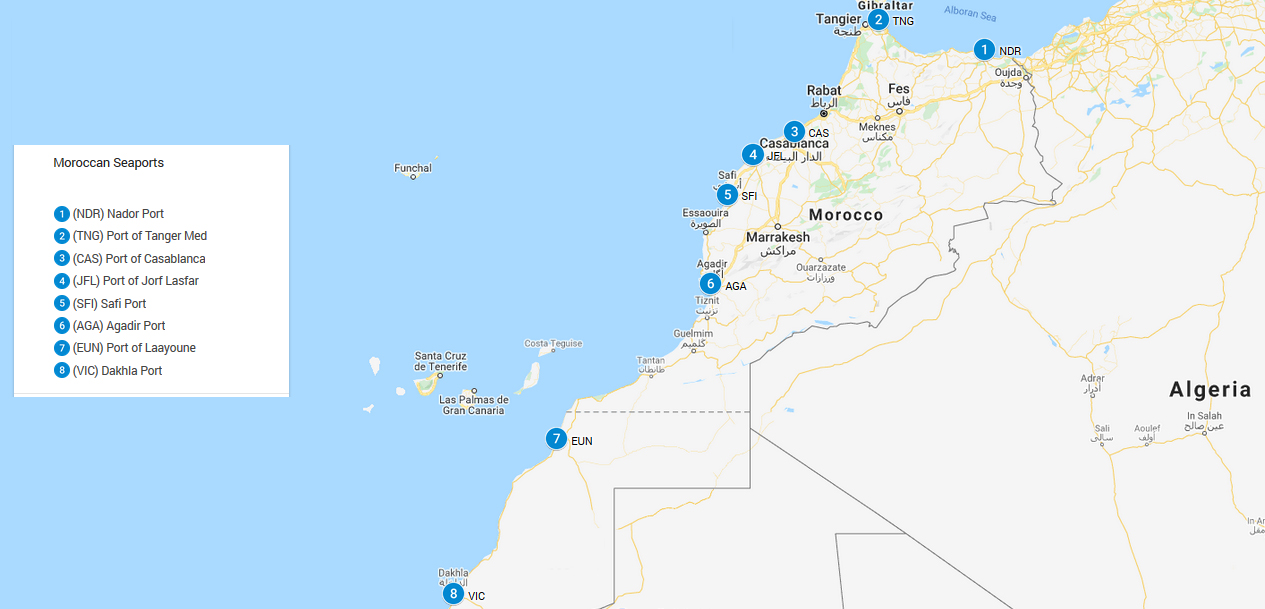
In our research, the eight selected seaports Fig. (1) are considered to be the major ports in Morocco in terms of total throughput by tons. As Table 1 shows, they have provided facilities for regional coasters and, over time, have developed to be among the maritime transhipments’most important ports for the African maritime routing. However, the Samir refinery, which makes the Mohammedia region the centre of the Moroccan petroleum industry, has had a considerable impact on the activity of its seaport. As such, the dynamics of its strategic positioning cannot be measured efficiently and the port of Mohammedia is not included in the present analysis. These major seaports of Morocco and their overall traffic are displayed in Tables 1 and 2.
The characteristics of major seaports in Morocco in 2017, presented in the tables below, show that “Tangier Med is ranked first in terms of total processing tonnage which is explained by its major activity of transshipment platform hub; the attractive geographic location of Tangier MED port, which is considered as a gate to Europe have encouraged pioneering liners (e.g Maersk Group and CMA-CGM) to invest in this strategic hub to make calls for their vessels” [7].
According to the Oxford Business Group, Morocco’s strategy-which includes upgrades of associated logistics and industrial hubs-seeks to build major new port facilities at Nador, Kenitra, and Dakhla, as well as commodity-focused ports in Safi and Jorf Lasfar, in part to help facilitate the development of existing industries and comparative advantages in the surrounding regions [21].
3. LITERATURE REVIEW
Seaports are no longer regarded as only the nodes that ships and goods are handled, but within the uncertain and highly volatile maritime industry, they become economically competitive areas for all port stakeholders [22]. By the effects of globalization and technological developments, ports are forced to increase efficiency and sustain their competitive positions as the interchange points between different modes of transport [22]. in other words, they need to restructure their operations and management to increase their market share. The determinant factors of competition are a matter of ongoing scholarly debate [18]. Some authors [23, 24] believe environmental conditions strongly determine the way seaports are created, organized, managed as well as their choice of strategy. When environmental conditions are altered, it creates many new opportunities as well as new threats to seaports and pushes the seaport into selecting a different strategic orientation [24]. On the other hand, other authors believe that a seaport’s competition is influenced mainly by port cost, quality of hinterland connection, geographical location, productivity, and capacity [25-28]. These factors have been also approved through a structured interview survey conducted by Nazemzadeh in 2015 with three groups of principal port selection decision-makers [27]. The survey was held among carriers, freight forwarders, and shippers located respectively in the ports of Antwerp, Rotterdam and Hamburg. In all, 45 responses were collected randomly from the largest companies in terms of market share. Hence, in order to apply strategies for retaining or enhancing the competitiveness of a port, port authorities need to understand their current competitive position and the factors that influence their business environment [18], or build upon a conceptual understanding of the dynamics of international seaport competition and perform strategic positioning analyses [1].
Although there have been several methods deployed to measure and identify the competitive position of ports, and the BCG matrix has been considered to be flawed due to its simplicity and growth rate determinations that may be deficient for appraising the attractiveness of industry [29]. Nonetheless, the BCG matrix is more suitable than other methods [18], since it allows rivals to easily map their market positions via measurements of business growth rate and relative market share [19].
Park, in 2006, revealed the trend of competitive positioning of 26 Korean ports in 1994, 1999, and 2003 by using the BCG matrix combined with a Data Envelopment Analysis model, emphasizing that the BCG matrix can provide seaport managers with valuable information for planning future port management [30].
A 2012 study by Da Cruz, Azevedo and Ferreira [24] proposes the strategic positioning of the leading Iberian Peninsula seaports using the BCG matrix from a static and dynamics perspective for the period between 1997 and 2008. Their study revealed a right positioning of Spanish seaports in terms of total traffic. Algeciras, Valencia and Barcelona port attained a remarkable position of leadership.
Dang and Yeo (2017) [31] focus on assessing the competitive positions of the top 20 container ports of five countries in the Association of Southeast Asian Nations over the six-years period from 2009 to 2014 using dynamic portfolio analysis. The findings revealed effective operations at the following ports that retained their dominant positions throughout the duration of the study: Port Klang, Tanjung Pelepas (Malaysia), Manila (the Philippines), Laem Chabang (Thailand), and Tan Cang Sai Gon (Vietnam). However, findings also revealed a common deterioration at other ports studied.
Jeronimo and Antonio, in 2017, conducted a BCG matrix analysis on 21 Spanish ports and divided the study into three groups based on geographical positions of ports on the Spanish coast, analyzing each group separately [32]. The study revealed that Spanish cruise ports are characterized by two positive competitive positions, mature leader (7 ports) and high potential (11 ports), however, the star performer position is very difficult to achieve.
Recent research of Pham, Choi and Park [18], applied the Boston Consulting Group matrix to analyze the competitive positioning of major ports in Korea and China in terms of several predominant cargo types. The portfolio results revealed that Chinese ports now are dominant players in terms of container traffic, with Busan being the only port with the ability to compete with Chinese ports. However, in terms of other cargo types such as Liquid Bulk or Ro-ro, Korea is more dominant. While the ports of China have diversified and developed equally in all types of cargo, Korean ports seem to have opted for specialization: Busan is a leading container port, with Uslan specializing in Liquid Bulk and Pyeongtaek specializing in Ro-Ro cargo.
Broadly speaking, most previous research papers focused on only European and Asian regions, and the number of studies on North African countries is declining significantly. In this regard, the present study will be of significant assistance to regional port authorities, as it sets out to determine the strategic positions of major Moroccan seaports.
4. METHODOLOGY
4.1. Data
The data were obtained from the annual statistical reports of ports authorities, which are available online via the Moroccan National Port Agency. To assess the strategic positioning of seaports under the study, we used data from the period 2014-2017; the ports considered in the dynamic analysis are described in Tables 1 and 2. The output is measured by three indicators: 1) Relative market share, 2) the market growth rate and 3) Throughput by tons (solid bulk, followed by liquid bulk, containers, cargo and Roll-on /Roll-off) load/unload, while the inputs are measured mainly in terms of throughput tonnage from the studied year and the previous year.
Furthermore, the evolution of annual turnover from 2014 until 2018 is represented below in Table 2.
| Region | Seaport Name | Annual Turnover 2017 (Million MAD) |
| Atlantic South Region | Agadir | 577.8 |
| Central Atlantic Region | Jorf Lasfar and Safi | 821.74 |
| Detroit Region | Tanger Med | 1983 |
| Great South Region | Dakhla and Laayoune | 876.03 |
| Mediterranean Region | Nador | 211.69 |
| North Atlantic region | Mohammedia | N.I |
| Port of Casablanca | Casablanca | 1745 |
| Annual turnover | 2014 (Million MAD) | 2015 (Million MAD) | 2016 (Million MAD) | 2017 (Million MAD) |
|---|---|---|---|---|
| ANP TURNOVER | 1413 | 1364 | 1739 | 1739 |
| MARSA MAROC | 2023 | 2171 | 2565 | 2209 |
| TANGER MED TURNOVER | 1463 | 1540 | 1692 | 1928 |
4.2. Mapping Seaports
Morocco’s 3,500 km coastline has 41 ports, 9 of which are considered to be seaport container terminals and opened for foreign trade. While their sizes may differ significantly from one port to the next, they all play a necessary role in the local economy. Fig. (1) indicates the location of each studied port. There are currently two main logistics operators who manage all the ports of the Kingdom except for Tanger-Med port, that is to say, Marsa Maroc and The National Agency of Ports (ANP), which are public entities. The technical supervision of ANP is entrusted to the Ministry of Equipment, Transport, Logistics and Water.
However, the Tangier Med seaport terminal is managed by the Tanger Med Port Authority (TMPA), which aims to manage and develop infrastructures. The operation of terminals as well as of all port activities is carried out under concession contracts by operators and worldwide entities (APM TERMINALS TANGIER and EUROGATE TANGER)
4.3. Seaport financial indicators
Table 1 indicates the financial indicators in terms of annual turnover for the year 2017 made by each region of the kingdom of Morocco.
4.4. Terminal Workforce
On 31/12/2017, ANP had 929 employees with a senior management ratio of 40%. These senior management employees are distributed as follows shown in Fig. (2).
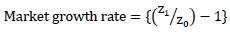
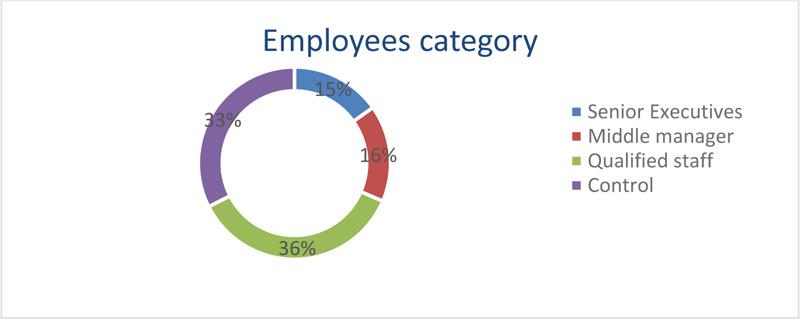
Marsa Maroc is the national leader in the management of port terminals. As is presented in the eight studied ports, Marsa Maroc provides port logistics services within its concession area and includes around 2,200 employees split into the following categories as shown in Fig. (3)
Other port operators such as TMPA, APM TERMINALS and EUROGATE TANGER have respectively 400, 800 and 600 employees Table 3.
4.5. BCG Matrix
The BCG matrix is an analysis tool with the objective of optimizing the allocation of a company's resources in its various areas of activity or strategic products [33]. Its construction is based on the product life cycle theory and its different phases: launch, growth, maturity and decline. It describes at a given moment the positioning of each product according to the growth of the market and their relative market shares. The objective of the BCG matrix is therefore to set priorities for the management of the company's product portfolio. The matrix can help us to analyze seaports if we use port related data to determine the average annual growth rate and the average market share of ports. The matrix can represent traffic categories, for example, roll-on/roll-off cargo, dry bulk, liquid bulk, conventional cargo, and containers [34]. Fig. (4) shows an illustrative matrix divided into four distinct categories (i.e., stars, question marks, cows and dogs).
In the BCG matrix, the vertical axis indicates the market growth rate of the studied port’s throughput. Naturally, the port throughput has different growths, which can be accounted for by adapting the scale on the y-axis so that matrix can be representative. The horizontal axis on a logarithmic scale represents the relative market share of the studied seaports, usually calculated as the ratio between the market share of the port in question and its largest competitor. If the result of the calculation is between 0 and 1, then the port is not in a favorable position. For example, a score of 0.6 indicates that the port terminal has only 60% of its competitor’s market share. If the result is greater than 1, then the port is in a leading position. A score of 3 indicates that the market share held by the port is three times that of the competitor.
 |
(1) |
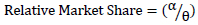
Where α is SBU Throughput in the given year, and 0 is the largest competitor port throughput this year.
 |
(2) |
Where z1 is the market's total throughput in the given year, and z0 is the market's total throughput of the previous year.
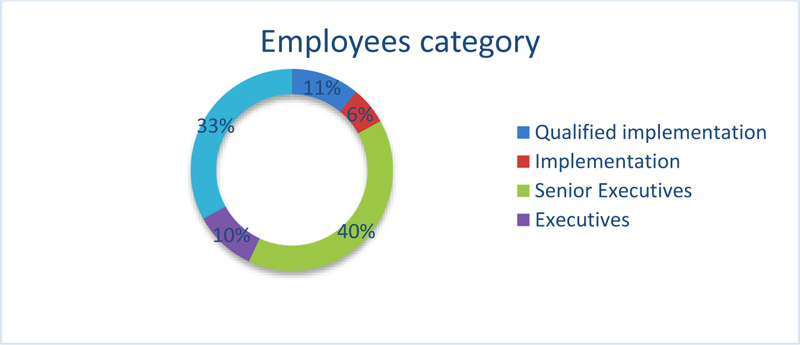
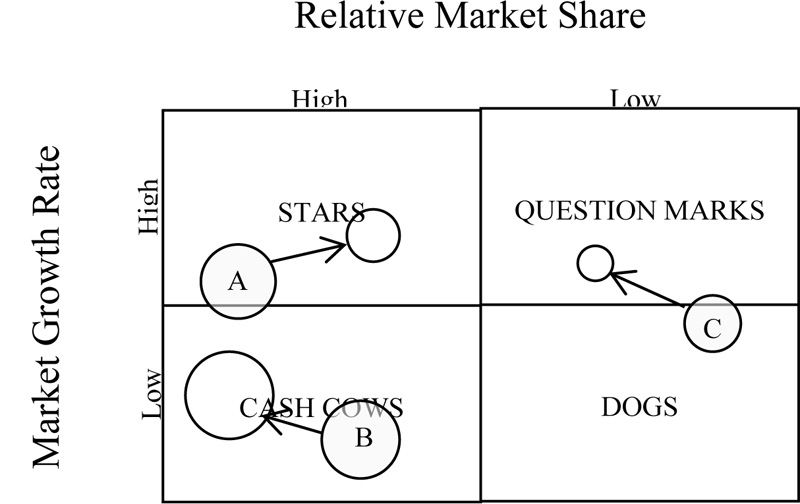
Circles A, B and C in Fig. (4) show the throughput of particular ports on the market. The grey circles represent the port’s current mean throughput, while the clear circles represent the predicted throughput of the same ports. The size of the circles reflects the size of the seaports which they represent, and their radius is calculated using the following formula:
 |
(3) |
Coordinates of the centre of the wheel are calculated as follows:
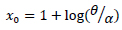 |
(4) |
 |
During the beginning of the process, the studied port is called a “Question”. It is impossible to know at this point whether it will succeed or not. Competition from other ports is important, and the studied port is not yet able to make a profit. The investments needed to improve market share can be significant. We must, therefore, anticipate the evolution of the market in order to decide whether it is more interesting to invest in the port concerned or to abandon it. If it generates profits, it can become a “cash cow”. If not, it will become a “Dog”. After the launch phase, if the port terminal enters the growth phase, it becomes a “star”. Its growth is accelerating and its position is strengthening in the market. It becomes very profitable and generates enough profit to be self-financing. The goal is, of course, not to stop there. Investments are needed to support the port's growth and positioning and move it to the “cash cow” stage. When the port matures in its life cycle, it generates significant profits while requiring much less investment. Its growth rate is low, even stable, but it is very well positioned in terms of market share. During this phase, the port must be maximized before it declines and must be replaced by a new more efficient one. It is a “cash cow”. At the end of its life cycle, a port's market share shrinks and its growth rate weakens. It becomes a “Dog”. If it remains profitable, it can be maintained provided that it does not consent to any investment in order to eliminate any risk of financial loss. If not, it can simply be dropped.
5. RESULTS AND DISCUSSION
Within the context of increasing globalization and marked by the intensification of trade in an increasingly competitive environment, the port sector has become an important resource for Morocco’s development and competitiveness. In this sense, assessing a strategic position analysis on major Moroccan seaports involves primarily the deployment of a dynamic analysis, which aims to monitor the evolution of selected port positions in different periods of the research. Thus, the objective of this approach is to highlight the progress of selected seaports within a chosen period in order to help port authorities gain coherent perspectives and forecast the future development possibilities of their seaports.
2014-2015 and 2016-2017 periods were chosen in this study in order to assess the recent positions of selected Moroccan seaports. The results of the BCG Matrix analysis are presented in Figs. (5 and 6). The data of Market Growth Rate and Relative Market Share was calculated in advance and illustrated accordingly in Tables 4 and 5.
| Port Operator | No. Employees |
|---|---|
| TMPA | 400 |
| APM TERMINALS TANGIER | 800 |
| EUROGATE TANGER | 600 |
| Seaports | Total throughput 2014 “Tons” |
Total throughput 2015 “Tons” |
Average Market Share (%) |
Average Annual Market Growth (%) |
| Nador | 30,830,00 | 2,953,488 | 7.03% | -4.20% |
| Tanger Med | 41,670,000 | 42,037,000 | 166.07% | 0.88% |
| Casablanca | 25,161,000 | 25,313,179 | 60.22% | 0.60% |
| Jorf Lasfer | 22,120,000 | 22,685,323 | 53.97% | 2.56% |
| Safi | 6,194,000 | 5,689,128 | 13.53% | -8.15% |
| Agadir | 4,177,000 | 4,002,534 | 9.52% | -4.18% |
| Laayoune | 3,186,000 | 2,368,375 | 5.63% | -25.66% |
| Dakhla | 459,000 | 525,750 | 1.25% | 14.54% |
| Seaports | Total Throughput 2016 “Tons” | Total Throughput 2017 “Tons” | Average Market Share (%) |
Average Annual Market Growth (%) |
| Nador | 3469373 | 2686745 | 5.23% | -22.56% |
| Tanger Med | 44615849 | 51328150 | 165.56% | 15.04% |
| Casablanca | 27715296 | 31002476 | 60.40% | 11.86% |
| Jorf Lasfer | 26091046 | 29598292 | 57.66% | 13.44% |
| Safi | 5969178 | 6152651 | 11.99% | 3.07% |
| Agadir | 4918325 | 4971334 | 9.69% | 1.08% |
| Laayoune | 2819625 | 2661138 | 5.18% | -5.62% |
| Dakhela | 653614 | 650257 | 1.27% | -0.51% |

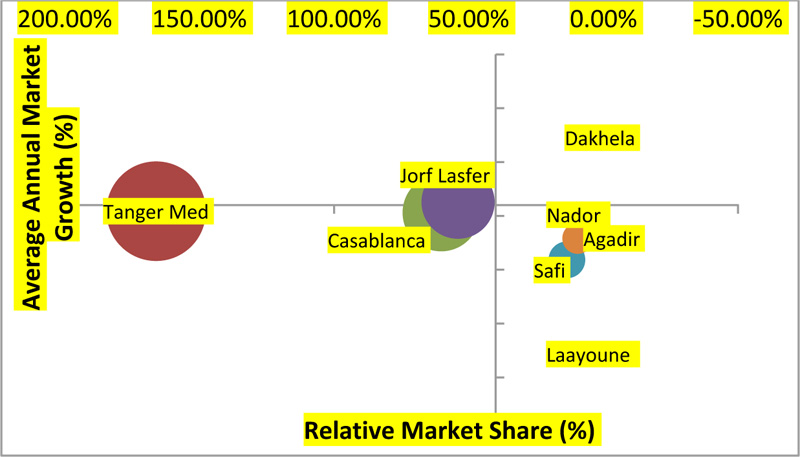
In the BCG matrix, the average annual market growth is represented in the vertical axis, and the relative market share is in the horizontal axis. As shown in Fig. (5), Tangier MED has an ideal market position, with a very high market share. This can be explained by the fact that its main role is as an international transshipment hub, whereas other ports rely only on regional activities. On the other hand, the growth rate of Tangier MED is only 0.88% as shown in Table 4, since the port reached its maximum capacity in 2014. These elements have contributed significantly to Tangier MED’s position as cash cow and star. This position indicates a need for infrastructure expansion, followed by sustained levels of higher funding to extend its capacity and increase its growth rate. Hence, if the industry growth slows down, stars become cash cows; otherwise, they become a dog due to low relative market share.
Jorf Lasfar and Casablanca ports are considered as cash cows and stars at the same time, but with moderate relative market shares compared to their highest competitor, Tangier Med port. In fact, they combine several advantages, that is to say, they are among leaders in the marketplace and generate more cash than they consume. In this regard, these ports need moderate increases in investment or traffic in order to position themselves completely as stars. Conversely, if the relative market share or average growth rate of these ports significantly declines due to the fierce competition, they are at risk of becoming “dogs.”
The other ports studied-Agadir, Safi, Laayoune and Nador-are considered to be “dogs” with depressed growth rates and relative market shares. This is especially true of the Laayoune port, whose position deep in the “dog” area reflects a negative growth rate of -25% as shown in Table 4. These seaports have a menacing market position, and therefore need to take serious measures and plan their strategic positioning accordingly. These negative results can be explained simply by their small market share. As shown in Fig. (6), the radius of these groups is much lower than ports with cow and star marks. Another possible explanation for their negative positioning could be a high operating cost, an unattractive position for liners, costly handling, and fewer alliance strategies compared to other rivals. In this regard, if they increase their growth rate they can become “question marks,” while they can become “cash cows” if they attract more traffic and satisfy their partners in the processing of their operation.
Dakhla port finished 2015 in the “question mark” position, signifying that its business is operating with a low relative market share in a high-growth market. Question marks have the potential to gain market share and become stars, and eventually cash cows when market growth slows down. Dakhla port has demonstrated a good positing in terms of its location in the “question mark” area, reflecting a positive annual growth rate of 70%. Therefore, it needs considerable investment to improve its total throughput in the future, and must also find a way to attract more traffic. If none of these proposals are done, it can easily become a “dog.” On the other hand, as presented in Fig. (6), in 2017, the seaport market structure performance of the evaluated port witnessed several changes. These changes took place due to several factors, such as the increase of the global maritime traffic, new expansion investments that have been done recently in some Moroccan seaports, the enhancement of port efficiencies to appeal more vessels, and new forms of cooperation between liners and port authorities.
Dakhla port has shown a negative performance, ending up in the “dog” position along with the ports of Agadir, Laayoune and Nador. they have a low relative market share as well as a low growth rate in a market where total traffic has increased gradually since 2016. These strategic business units typically break even, generating barely enough cash to maintain their ports’ activities. Nador port is positioned in the lowest area of the “dog” region, marking a dramatic decline which can be explained by a crisis at national and international levels of the steel production industry, since Nador port focuses mainly on the solid bulk field. However, the decline of Dakhla port to “dog” status can be explained by a decline in container throughput, due to a complex combination of several regional political issues. Safi port has witnessed a positive change, landing in the “question mark” performer position with a moderate growth rate of 3.07% that can be explained by an increase in exports of chemical goods. Jorf Lasfar and Casablanca port together in 2017 have performed well by attracting more traffic than in the previous year, and they find themselves in star performer position with a market share of 57.66% and 60.40% respectively. Tangier MED port stands out in terms of strategic positioning as well as performance. Its position within the BCG matrix improved considerably, landing itself completely in the “star” range and solidifying its dominant position compared to its Moroccan competitors. The annual growth rate shown in Table 5 is 15.04% with a score of 1.65 in terms of relative market share. This means that Tangier Med holds a 165% market volume of its direct competitor, the port of Casablanca.
This study indicates a worrying dynamic at play: while stiff competition exists between medium and small ports, market share inequality abounds and the Tanger Med enjoys a dominance that approaches monopoly. In the face of new social, economic, and environmental challenges, addressing this issue is more vital than ever. Through bold government initiatives to build nimble policies, form bilateral agreements with nearby countries such as Spain, and engage with China’s Belt and Road Initiative, Morocco can succeed in strengthening the position of its seaports on the global scale.
CONCLUSION AND RECOMMENDATIONS
This study highlights the strategic positioning of the eight major seaports in the kingdom of Morocco from 2014 to 2017 through a dynamic portfolio analysis. It has demonstrated that the dynamic characteristics of the Moroccan seaports have a substantial effect in explaining not only market concentration but also the competitiveness level of ports in the market. The BCG matrix shows that the advantage levels of the ports changed within the period of study, and describes that change. Tangier MED, Jorf Lasfar, and Casablanca ports have performed well in 2017 by attracting more traffic than their previous years and ending the year completely in the “star performer” position. This is in contrast with the 2015 BCG matrix, which shows a position between “star performers” and “cash cows” for the same seaports. Rigorous and consistent efforts are required for these ports to maintain their strategic competitive position and properly forecast future disruptions, be they social, economic or environmental. Some of these ports are facing congestion challenges due to lack of storage capacity and shortage of berth, but it is possible to overcome these drawbacks by gradually adapting effective terminal expansion measures. Other ports, such as Safi, have proven themselves to be emergent, with a moderate growth rate of 3% that contributes to their status as “question marks.” Meanwhile, Dakhla, Agadir, Laayoune and Nador have proven to be inefficient ports, languishing in the “dog” region of the matrix.
On one hand, we recommend that port authorities of seaports holding “dog” performer positions pursue a strategic positioning of the Moroccan pioneering port such as Tangier MED and benchmark subsequently its progressive approach in the aim to improve the strategic position of these ports and enable them to reach stars mark.
On the other hand, it is recommended that port authorities of all other studied ports enact proactive policies based on the main action levers (regulation and development). Their ultimate purpose should go beyond the simple framework of accomplishing social and environmental engagement policy by opening themselves up to new prospects to unify the port community around values relating to environment protection, sustainability and integration of ports into their environment.
This study is considered as a preliminary guide for seaport authorities (ANP, MARSA MAROC, TMPA) and investors to visualize port performance through growth rate and market share, both of which are critical success factors. Benchmarking can be conducted with rivals in the region focusing on rationalized yields. Understanding current strategic positions allows port authorities and investors to develop an efficient and truly integrated port platform for complementary transshipment, import-export, value-added logistics, maritime, and port services. In addition, this study provides fundamental information and insight regarding the development of research on the competitiveness of seaports in the kingdom of Morocco. Thus, we have aimed to provide constructive steps for future research of competitive strategies, enabling port managers and the broader scientific community to contribute meaningfully to the development of the Moroccan economy.
In the end, shortcomings of this study are marked by the difficulty of commissioning Moroccan seaports, the simplicity of the BCG matrix, and the selection of containerization throughput instead of other forms. Therefore, further studies could be conducted based on complementary datasets and other managerial assessment tools such as Data Envelopment Analysis, which take into consideration more harmonized types of inputs such as, berth length, workforce and equipment, with the goal of providing a bold and comprehensive strategic evaluation.
CONSENT FOR PUBLICATION
Not applicable.
AVAILABILITY OF DATA AND MATERIALS
The data supporting the findings of the article can be obtained from Morocco’s Port Authority and Tanger Med Port Authority upon request by e-mail.
(https://www.anp.org.ma/En/Agency/Pages/Annual-Report.aspx
https://www.tangermed.ma/wp-content/uploads/2018/12/Rapport_annuel2017_TM.pdf
https://www.tangermed.ma/wp-content/uploads/2019/11/Rapport_Annuel_Tangermed_VFR_2018-Web.pdf)
FUNDING
None.
CONFLICT OF INTEREST
The author declares no conflict of interest, financial or otherwise.
ACKNOWLEDGEMENTS
We thank Shanghai Maritime University and Inha University in Tashkent for their support. The authors also thank Patrick Powers (Oberlin College, the USA) and Iroda Saydazimova (Inha University in Tashkent, Uzbekistan) for language editing.

