All published articles of this journal are available on ScienceDirect.
Bridge Safety Analysis Based on the Function of Exceptional Vehicle Transit Speed
Abstract
Background:
The road management agencies often prescribe very low-speed limits for exceptional vehicles transiting on the deck. These restrictions aim to reduce the dynamic effects due to the vehicle-bridge interaction because it is assumed that these effects increase with speed. However, sometimes, a reduction in speed increases the encounter probability of two exceptional vehicles travelling in opposite directions and this could compromise the safety of the bridge when the total masses of both vehicles exceed the bridge bearing capacity (or limit mass).
Objective:
While the literature has investigated the encounter probability in a theoretical way and has investigated the vehicle-bridge interaction, especially in terms of dynamic load increment, to the best of our knowledge, no study has investigated the conjunction probability of encounters and of exceeding the limit mass also by using real data. This paper aims to cover this gap by proposing an integrated model that computes the “Annual Probability of Failure” of the bridge, defined as the likelihood to exceed the “Limit Mass" of the deck when two opposite exceptional vehicles encounter.
Methods:
According to the probability theory, the “Annual Probability of Failure” can be obtained by multiplying the likelihood that during the reference year, at least once, two exceptional vehicles, travelling in two opposite directions (ascendant and descendant), will be simultaneously on the bridge deck (“Annual probability of encounter”) with the likelihood that the sum of the single masses of two exceptional vehicles randomly extracted from the sample, including the dynamic effects, exceeds the limit mass ml (“Probability of exceeding the limit mass”).
Results:
The results show that the probability of encounter increases with both the exceptional vehicles flow rate and the length of the span, whereas it decreases with the passing speed. The probability of exceeding the limit mass increases with speed. Nevertheless, by combining both the probabilities, these results suggest the existence of an “Optimal Speed”, which minimizes the “Annual Probability of Failure”.
Conclusion:
The existence of an “Optimal Speed” should be considered when defining the exceptional vehicle transit rules on bridges as well as the speed limit.
1. INTRODUCTION
The term “exceptional vehicles” indicates those vehicles which, in their travel configuration, exceed size and / or mass limits imposed by traffic codes.
At the European Union level, vehicular circulation is regulated by the Directive 96/53/EC [1], recently updated by the Directive 2015/719 [2], which prescribes the “maximum authorized dimensions”, “maximum authorized weight” and “maximum axle weight” for use in international traffic. Particularly, the maximum authorized weight depends on the vehicular configuration, ranging from 18 t for two-axle trailers up to 44 t for articulated vehicles with five or six axles.
In Italy, these limits are prescribed by Art. 61 and Art. 62 of D.lgs. 30 April 1992 n. 285 [3]. In particular, the mass limit varies according to the vehicular typology, as shown in Table 1.
| Vehicle Type | Mass Limit |
|---|---|
| Isolated | 18 t for 2-axle vehicles |
| 25 t for vehicles with 3 or more axles | |
| 20 t for 2-axle heavy machinery | |
| 33 t for 3-axle heavy machinery | |
| 40 t for heavy machinery with 4 or more axles | |
| Articulated | 24 t for 3-axle road trains |
| 30 t for 3-axle articulated lorries | |
| 40 t for 4-axle articulated vehicles | |
| 44 t for articulated vehicles with 5 or more axles | |
| 44 t for 4-axle heavy machinery | |
| 56 t for heavy machinery with 5 or more axles |
Exceptional transport regulation is currently of primary importance for road management agencies. Indeed, the growing heavy vehicle flow and the progressive increase in transported masses can negatively affect road circulation and infrastructure safety. Regarding infrastructure, the problem mainly concerns the acceleration of road pavement deterioration and bridge stability impairment. This is a crucial issue in Italy, considering the recent collapse of bridges built in the second half of the last century, designed to withstand lower vehicle loads than those currently transiting on road networks.
For these reasons, exceptional vehicles must comply with complex regulations and are subject to specific circulation authorizations issued by the road owner or by road management agencies. In Italy, for instance, the authorization is issued on a case by case basis (single authorization), or for several transits (multiple authorization), or for certain time limits (periodic authorization). In the authorization provision, pre-established routes and an eventual technical escort service can be imposed. Authorization can only be given when it is compatible with the preservation of road superstructures, with the stability of structures and safety of traffic [3].
In order to ensure safety, road management agencies often prescribe very low-speed limits for exceptional trucks moving on bridge decks, especially when the structure shows evident signs of material degradation. The aim of these restrictions is to reduce the dynamic effects due to the vehicle-bridge interaction, assuming that these rise with speed. However, on two-way bridges, the encounter of two exceptional vehicles travelling in opposite directions (ascendant and descendant) is crucial, if the sum of their masses exceeds the bridge bearing capacity. Since speed reduction leads to an increase in the encounter probability, the favorable effects of the agency’s prescriptions could be invalidated.
Theoretically, authorities could prevent the encounter event by simply prohibiting the simultaneous presence of exceptional vehicles on the deck. However, compliance with this requirement is difficult to implement in the absence of weighing systems at the bridge entrances, especially for those vehicles that are exceptional only in mass: indeed, the technical escort, in the Italian Code, is prescribed exclusively for vehicles that are exceptional even in size. Moreover, the current Italian authorization system does not facilitate the implementation of this prohibition, as the authorized trips, even if single or multiple, must not be carried out on a specific date and time, but within a certain time interval, which can also be equal to a few months.
The analysis of vehicle loads acting on bridges is a recurrent topic in the scientific literature. Stephenson [4] developed a theoretical method, based on the elementary probability theory, to estimate live load frequencies on the highway that may be expected from various types and levels of heavy motor vehicle operation. The main objective of the method was to provide a relatively simple mathematical basis to estimate approximately how often any specified sequence or group of two or more vehicles might be expected to occur on any particular part or length of a bridge as a result of given or anticipated compositions, volumes and speeds of traffic. Based on Poisson’s Law, the method shows how the probability that a fixed number of vehicles occurring at a given location, in any manner, in either or both directions of travel, within a fixed time interval or length, decreases when the average vehicular speed increases. However, no experimental measurements were conducted; therefore theoretical values were assumed for traffic volumes and compositions.
The lack of experimental data was still present in 1984 when Fenwick [5] outlined the requirements to derive design loads for bridges and pavements that should have been contemplated during the drafting of a new Bridge Design Code in limit state format. The author noted that previous bridge codes had defined live loads in a deterministic manner. Typically, the serviceability design load was defined by increasing the legal load by an arbitrary factor (about 15%) to cover overloading, future increases in legal loads, etc. Conversely, no attempt has been made to actually measure real traffic loads on a statistical basis and to confirm the design values. The main reasons for not bothering to measure real traffic loads were technical as the necessary instrumentation was not available. He concluded that it was necessary to undertake data collection campaigns in order to measure the real traffic loads on bridges and to conduct statistical analyses on them.
Only recently, the development of the Weight In Motion (WIM) systems has finally provided large amounts of experimental observations on heavy vehicular traffic. For instance, examples of extreme value statistics of traffic loads and effects on a medium span bridge were presented [6]. Gross vehicle weight associated with a return period of 1000 years, as prescribed by Eurocode 1 [7] for traffic on the main roads in Europe, was estimated using available WIM data recorded on a bridge located on a heavily trafficked itinerary in the North of Paris. Conversely, Enright and O’Brien [8] presented a comprehensive model for the Monte Carlo simulation of bridge loading for free-flowing traffic, and showed how the model matched results from measurements on five European highways. An estimation of site-specific lifetime extreme traffic load effects, in terms of mid-span moment, mid-support hogging moment and support shear, was made using statistical distributions derived from weight-in-motion measurements as the basis for the Monte Carlo simulation of traffic loading.
Previous studies focused on traffic load determination but did not deal with dynamic effects due to bridge-vehicle interaction. Since the 20th century, a lot of research works have been conducted on this topic, initially in the railway field and, only later, on road structures. It was discovered that the magnitude of the dynamic load depends on several factors, including bridge dynamic behaviors, road roughness, vehicle dynamic characteristics, vehicle speed, type, weight, number of axles, axle spacing, the position of vehicles on the bridge, and other parameters [9, 10].
Theoretical investigations on this issue can be split into two categories: analytical and numerical studies.
Analytical studies on the dynamic effects of a moving vehicle are mostly mathematical investigations on simple-span highway bridges and generally incorporate the following assumptions [11].
- The actual bridge deck system, consisting of a floor system of several girders, can be represented by a single beam of equivalent stiffness;
- Only the first natural frequency of vibration needs to be considered;
- Regardless of the number of axles and the corresponding number of springs and tires, the vehicle can be idealized as a system with a single degree of freedom;
- The weight of a vehicle is applied at the center of its mass.
Numerical studies are based on Finite Element Analysis (FEA). A bridge is described by using a three-dimensional model that includes all the structural elements, such as longitudinal beams, transverse beams, side curbs, concrete slabs and elastomeric bearing pads. Vehicles are modeled as mechanical systems with multiple degrees of freedom, consisting of masses connected to each other by elastic springs and viscous dampers, to simulate the behavior of the suspension and the tires. The number of these elements determines the complexity and degree of accuracy in describing the response of the vehicle. Equations of motion solution are then calculated through iterative integration procedures [12].
Overall, there are no doubts that all these studies provided interesting and captivating results for both research and practice. However, as far as the authors know, no study has ever been conducted on how the encounter probability of exceptional vehicles on the bridge deck and the dynamic effects due to vehicle-structure interaction globally concur in determining the level of infrastructural safety. This paper aims to cover this gap, by developing a model for calculating the “Annual Probability of Failure” of a bridge subject to exceptional vehicle transits, understood as the annual probability of exceeding an assigned limit state. The prediction is made by multiplying the probability of encounter of two exceptional vehicles on the deck, estimated through the Poisson distribution, with the probability that the sum of the masses of these two vehicles exceeds a fixed limit value associated with the considered limit state.
The remainder of this paper is organized as follows. In Section 2, a model is presented to estimate the “Annual Probability of Failure”. In Section 3, the implementation of this model is illustrated by using real data provided by an Italian road management agency and the results are briefly discussed. Finally, in Section 4, conclusions and research perspectives are provided.
2. METHODS
The goal of the design of engineering work is to ensure that it fulfills the function for which it was conceived while maintaining an established "Level of Safety", generally understood as a degree of protection for people and property against the effects of a possible system failure. In this context, the term "System Failure" does not necessarily mean the collapse of the structure, but indicates, in a much broader sense, the achievement and/or overcoming of any situation (defined as the "Limit State") which could lead to a malfunction of the entire system or of a portion thereof and which, therefore, is capable of causing unwanted consequences [13].
It is noteworthy that the bridge damage/collapse is a catastrophic event; the occurrence of which is unacceptable, at least from a theoretical viewpoint. However, the parameters that govern the behavior of a structure during its entire service life, such as the resistance of the materials (endogenous factors) and the actions acting on it (exogenous factors) are not deterministic. In order to consider these uncertainties in a "scientific" and "rational" way, typical not only of civil engineering, but more generally of physics and natural sciences of which the engineering discipline is a direct descendant, it is useful to rely on "Theory of Probability ”. This theory can translate into mathematical language the confidence nourished on the outcome of a certain phenomenon as a function of how much one is able to describe it in every aspect. The "Limit States" design method, currently prescribed by the codes of the most advanced countries, such as the Eurocodes [14], is based on a probabilistic approach.
In this model, for ease, a system constituted by a simply supported single span bridge is considered. However, the results can be easily extended to a single span of an isostatic multiple span bridge. Let “Limit Mass” (ml) be the overall vehicular mass value, simultaneously acting on the deck, capable of inducing a “Limit State” condition for the bridge.
This limit state could be:
An “Ultimate Limit State”, i.e. a condition beyond which the adequate level of structural safety is not guaranteed, e.g. the ultimate bending moment of the beams that support the deck;
A “Serviceability Limit State”, i.e. a condition beyond which good structural behavior is not ensured, for example, limit deflection, crack opening, vibrations, etc.
In order to quantitatively measure how the exceptional vehicle speed could affect bridge reliability, it is necessary to define an indicator. This indicator can be, for example, the “Annual Probability of Failure” (Pfail), i.e. the probability that, during a generic reference year, the sum of the vehicular masses simultaneously acting on the deck exceeds the limit mass associated with an assigned limit state. Moreover, the bridge reliability could be assessed through the “Return Period” (Tret), intended as an average time between two failures. According to the probability theory, Pfail can be obtained by composing the two single probabilities Penc and Pml:
 |
(1) |
Penc is the “Annual Probability of Encounter”, i.e. the likelihood that during the reference year, at least once, two exceptional vehicles, travelling in two opposite directions (ascendant and descendant), will be simultaneously on the bridge deck.
Pml is the “Probability of Exceeding the Limit Mass”, i.e. the likelihood that the sum of the single masses of two exceptional vehicles randomly extracted from the sample, including the dynamic effects, exceeds the limit mass Pml.
The “Return Period” (Tret) can be obtained as the reciprocal of Pfail:
 |
(2) |
2.1. Calculation of the “Annual Probability of Encounter” (Penc)
In order to calculate the probability of encounter, it is required to define a “Reference Period” (Tref) within which this likelihood is evaluated:
 |
(3) |
Where:
- dfi [h] is the "Daily Flow Interval", i.e. the daily time interval within which exceptional vehicle circulation is assumed to occur;
- nwd [d] is the annual number of working days;
- ny [y] is the number of years within which the probability of encounter events is calculated.
The flow is assumed to occur only during a defined daily time interval (dfi) and only during a certain number of working days (nwd). This is a realistic hypothesis, more conservative than assuming that it occurs at any time during the whole year.
Assuming that the exceptional vehicles move on the bridge at a constant speed, then the permanence time on the deck is:
 |
(4) |
Where:
- L [m] is the span length;
- v [m/s] is the transit speed, assumed to be constant over time.
The average daily exceptional vehicle flow rate, in ascending and descending directions respectively, is computed as follows:
 |
(5) |
 |
(6) |
Where:
- Qy,A [veh/y] is the annual exceptional vehicle flow rate in the ascending direction;
- Qy,D [veh/y] is the annual exceptional vehicle flow rate in the descending direction.
The probability that an exceptional vehicle, in ascending and descending directions, is on the bridge in each assigned time interval ∆t ϵ dfi is obtained by (7) and (8):
 |
(7) |
 |
(8) |
Where n = (3600∙dfi)/∆t [rep/d] is the number of repetitions of the permanence time (∆t) within the daily flow interval (dfi).
Equations (7) and (8) are directly derived from the classical definition of probability. It states that, if h indicates the number of favorable cases to the occurrence of a considered event E and H indicates the number of possible cases, then the probability P(E) of the event is provided by (9):
 |
(9) |
In our example, the event E can be defined as the fulfillment of the proposition “An exceptional vehicle is on the bridge during the assigned time interval ∆t ϵ dfi”, the number of favorable cases (h) is the number of exceptional vehicles that transit on the bridge during the daily flow interval (i.e. the average daily exceptional vehicle flow Qd,A and Qy,D) and the number of possible cases (H) coincides with the number of repetitions of the permanence time within the daily flow interval (n).
The probability that, in each time interval ∆t, two exceptional vehicles coming from opposite directions are simultaneously on the structure is obtained by combining the two single probabilities pA and pD:
 |
(10) |
The probability of a given number x ϵ N of encounter events occurring in the fixed reference period (Tref) is provided by (11):
 |
(11) |
Where:
• λ= p∙N [rep] is the most probable number of repetitions during the reference period (Tref);
• N=Tref/∆t [rep] is the number of repetitions of the permanence time ∆t within the reference period (Tref), i.e. the number of trials.
Equation (11) represents the Poisson probability mass function, that is, an approximation of the binomial distribution under certain conditions. Indeed, in a binomial process (i.e., an experiment in which each trial can have only two outcomes, called success and failure) of N trials, the probability P(x) that an event will occur exactly x times is provided by the binomial distribution (12):
 |
(12) |
Where p is the probability of success in a single trial.
If the number of trials (N) is very large, in a limit case tending to infinity, then the binomial distribution can be approximated with the Poisson probability mass function. Indeed, the Poisson Limit Theorem, the proof of which is reported in Appendix 1, states that:
 |
(13) |
Considering that, in our case study, N is very large; then equation (11) is a good approximation for P(x).
The probability that the encounter event will occur at least once during the reference period is the complement to one of the likelihoods that the event will occur zero times:
 |
(14) |
As reported in Appendix 2, by making the appropriate substitutions, equation (15) is obtained:
 |
(15) |
The “Annual Probability of Encounter” can be calculated considering a reference period of 1 year, i.e. by setting ny=1:
 |
(16) |
2.2. Calculation of the “Probability of Exceeding the Limit Mass” (Pml)
Let mA and mD [t] be the masses of the vehicles coming from the ascending and descending direction, respectively. These are random variables, described by their probability density functions fA and fD [1/t], respectively.
In order to compute the dynamic effects due to the interaction between the vehicles, the road pavement and the structure, the respective dynamic masses mA,dyn and mD,dyn [t] are defined. These are obtained by increasing the static masses through the “Dynamic Load Allowance” (DLA), a dimensionless coefficient that is a function of the transit speed v, assumed as being the same for both directions:
 |
(17) |
 |
(18) |
Failure occurs when the sum of the two dynamic masses exceeds the limit mass (ml) that can be supported by the structure:
 |
(19) |
By substituting (17) and (18) in (19), equation (20) is obtained:
 |
(20) |
Or, equivalently (21):
 |
(21) |
Where:
• mtot = mA + mD [t] is a new random variable, which represents the total mass of the two exceptional vehicles;
• g(v) = ml / (1+DLA(v))[t] is a function of transit speed (v), which represents the limit mass reduced by factor 1+DLA(v) to account for dynamic effects.
It is clear that the “Probability of Exceeding the Limit Mass” (Pml) coincides with the probability that the inequality (21) is true, i.e. with the probability that the random variable mtot exceeds the value g(v):
 |
(22) |
Where
 is the cumulative distribution function associated with the random variable mtot.
Therefore, it is essential to know the probability density function fA+D [1/t] associated with the same random variable. Once a generic value z ϵ R+ of mtot is fixed, it is well known that the probability density fA+D(z) associated with this value is given by (23):
 |
(23) |
Indeed, the probability that mA + mD assumes the z value is given by the sum of the single probabilities of the following events:
 |
(24) |
In order to compute g(v), the formalization and computation of DLA are requested. This is shown in the next section.
2.3. Estimation of the “Dynamic Load Allowance” (DLA)
The traffic load, being one of the most important live loads acting on bridge structures, always produces dynamic effects, because of the vibration caused by road surface roughness and vehicle-bridge interactions [15].
Bridges are traditionally designed using static loads that are increased by the “Dynamic Load Allowance” (DLA) or, equivalently, by the “Dynamic Load Factor” (DLF). These dimensionless factors are functions of the span length or the first flexural natural frequency of the bridge, and indirectly incorporate the dynamic effects of moving vehicles in the design [11].
The classical definitions of DLA and DLF are (25) and (26), respectively:
 |
(25) |
 |
(26) |
Where Rdyn and Rstat are the maximum dynamic response and the maximum static response of the structure, respectively, intended as the maximum stress, internal action, deformation or deflection in the presence and absence of dynamic amplification effects [9].
Assuming that the structural response is proportional to the applied load, then DLA can be expressed in terms of weight force or, equivalently, in terms of masses:
 |
(27) |
Where:
• m is the static mass, i.e. the real vehicular mass;
• mdyn is the “Dynamic Mass”, i.e. a fictitious mass, larger than the static one, which considers the effects due to dynamic amplification.
By inverting equation (27), the dynamic mass (mdyn) can be expressed as a function of the static mass (m) through DLA or DLF (28):
 |
(28) |
Therefore, a model to estimate DLA and DLF is requested.
The simplest case is the response of a simply supported prismatic beam to a constant force traveling at a constant speed. Because many bridges consist of simply supported girders, this model provides a useful insight into their dynamic behavior. In this configuration, an estimate of the DLF can be made through the equation (29), which is derived assuming that the maximum response occurs when the amplitude of load and free vibration are added together, assuming that the behavior is governed only by the first vibration mode [11]:
 |
(29) |
Where:
•
 is the transient frequency, that is a function of the transit speed v [m/s] and span length L [m];
•
 is the natural angular frequency associated with the first vibration mode of the beam, that is a function of the flexural stiffness EJ [N∙m2], of the span length L [m] and of the unit mass m [kg/m];
Equation (29) is applicable when Ω1<ω1. The limit case Ω1=ω1 represents the resonance phenomenon between vehicle and bridge. However, the possibility of resonance can be ruled out because the loading exists only for a limited number of cycles, e.g. only a half-cycle for the first mode. Moreover, as discussed in Appendix 3, an extremely high load velocity is required for resonance and only a limited amount of energy is present in the bouncing vehicle as it enters the span. Usually, the transient frequency (Ω1) is quite small compared with the natural angular frequency (ω1) [11].
Although the previous model does not consider many parameters (i.e. road roughness, vehicle weight, number of axles, suspension characteristics, tire characteristics, etc.), it is adopted as a first approach to the problem for ease. Further improvements may be developed in the future.
Natural angular frequency (ω1) is related to the natural fundamental frequency f1 [Hz] of the beam through equation (30):
 |
(30) |
Fundamental frequency determination should be carried out through a dynamic modal analysis of the structure. However, several studies have shown that the relationship (31) adequately represents the dynamic behavior of a large range of bridge decks [16].
 |
(31) |
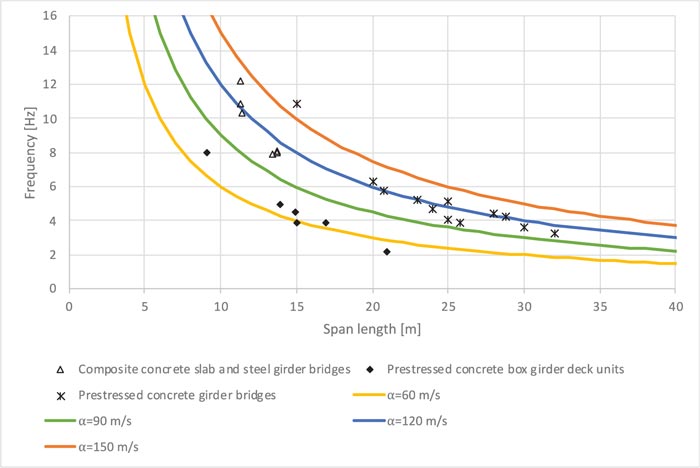
Where α [m/s] is an empirical parameter, quite constant with span length (L), dependent on the structural type. As illustrated in Fig. (1) for simply supported structures, the constant value 60 is indicated for prestressed concrete box girder deck units, while the constant value 120 is reasonable for prestressed concrete girder bridges and composite concrete slab and steel girder bridges.
As reported in Appendix 4, considering (26), (29), (30) and (31), making the appropriate substitutions, equation (32) is obtained, which gives DLA as a function of only transit speed (v) and the structural type empirical parameter (α):
 |
(32) |
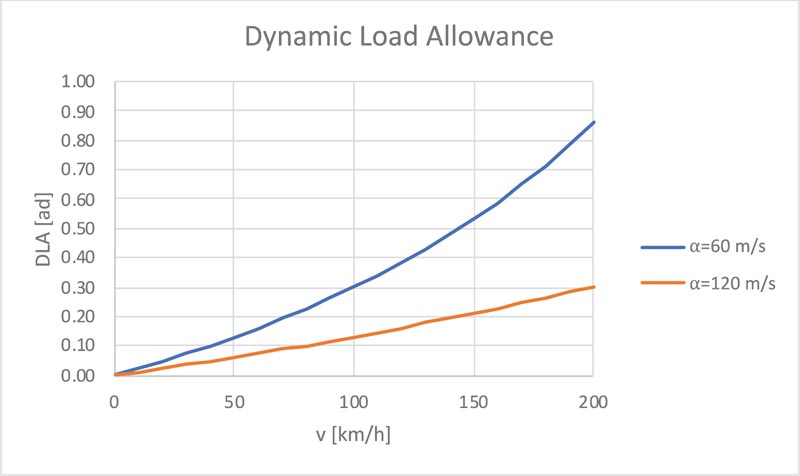
As illustrated in Fig. (2), elaborated by assuming α=60 m/s and α=120 m/s, the DLA appears to increase with transit speed (v). Moreover, the results show that, once a certain transit speed (v) is fixed, DLA increases as the empirical parameter α decreases. This is reasonable: indeed, a decrease in bridge stiffness, to which the α parameter is strictly correlated, implies an increase in vehicle-bridge dynamic interaction.
3. RESULTS
In order to illustrate the results that can be obtained through the developed model, a realistic example is considered, referred to a simply supported bridge with a span length (L) of 30 m.
Suppose that the structure is a prestressed concrete box girder deck unit. This implies that α = 60 m/s is a good representation of the structural dynamic behavior.
Assuming that the limit mass associated with an assigned limit state (i.e. bending ultimate limit state) is 300 t, that could be a realistic value for a bridge designed in the second half of the last century, especially if it is subject to a material degradation phenomenon.
Supposing that the annual flow rates in the ascending and descending direction coincide (Qy,A = Qy,D) and are equal to 300 veh/y; these flows occur during 260 working days (nwd). Each working day is characterized by a daily flow interval (dfi) of 8 hours: indeed, generally, exceptional vehicle transit occurs during night hours only. All these values are realistic for the main itineraries of highly industrialized regions, such as Northern Italy.
Let us assume, for ease, that the probability density functions (fA and fD) associated with the random variables mA and mD are the same for the ascending and descending direction. It is worth remembering that the random variables mA and mD are “static masses”. During the processing of the model, the dynamic effect is indirectly considered multiplying these masses by the Dynamic Load Allowance (DLA) as reported in equations (17) and (18).
In order to ensure realistic results, these distributions are defined by analyzing the data in our possession, relating to single and multiple authorizations issued by the Province of Brescia (Lombardy, Italy). The database contains 3155 records in the time period between August 2016 and January 2019.
Fig. (3) and Fig. (4) illustrate the individual distributions (fA and fD) and the compound distribution (fA+D) obtained from the analysis, respectively. The amplitude of discretization intervals, indispensable to perform numerical integrations, is set equal to 1 t. The fA and fD functions resemble Gaussian distributions, with "anomalies" corresponding to mass values immediately below 44 t, which prove to be the most likely. This is due to the contribution of those transports that are exceptional only in terms of size, but not in mass. For the same reason, the fA+D function shows “anomalies” corresponding to mass values around 88 t.
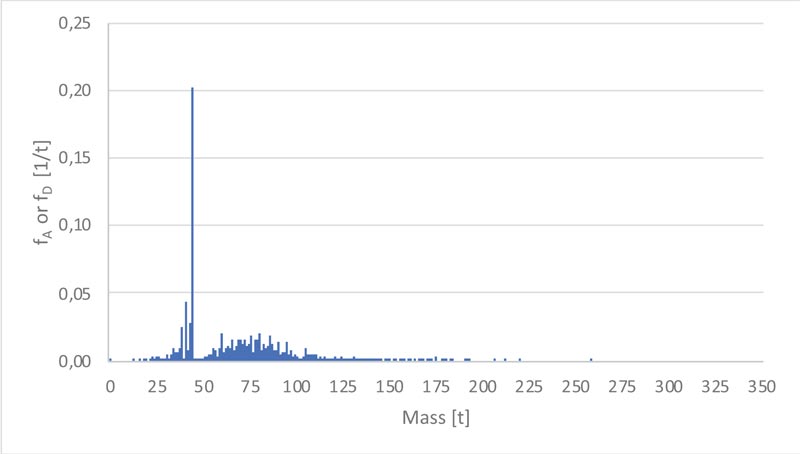
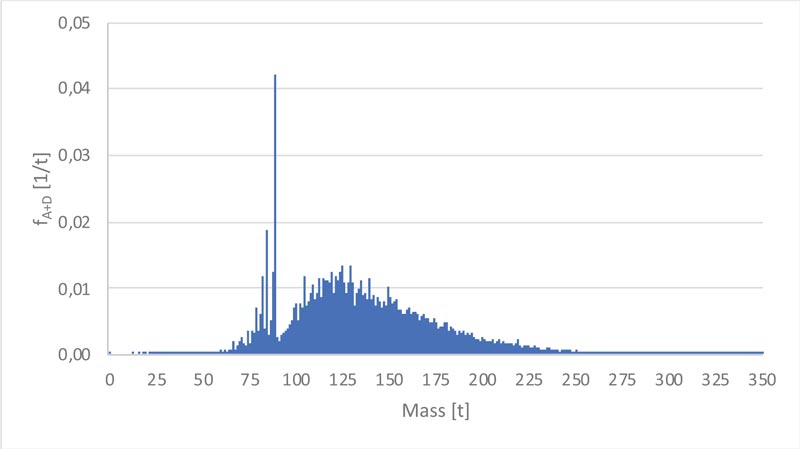
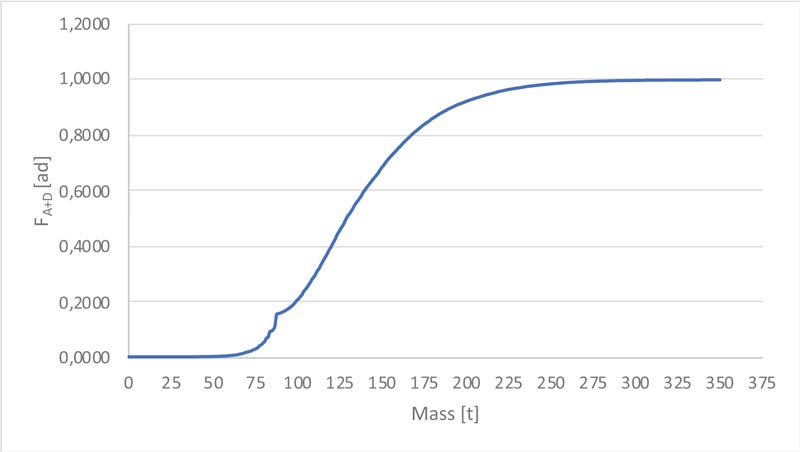
Fig. (5) illustrates the cumulative distribution FA+D associated with random variable mtot. It resembles a Gaussian cumulative distribution, with an “anomaly” corresponding to mass values around 88 t, due to those transports that are exceptional only in terms of size.
The results obtained by the application of eqs. (16), (22) and (1) are illustrated in Fig. (6) and Fig. (7).
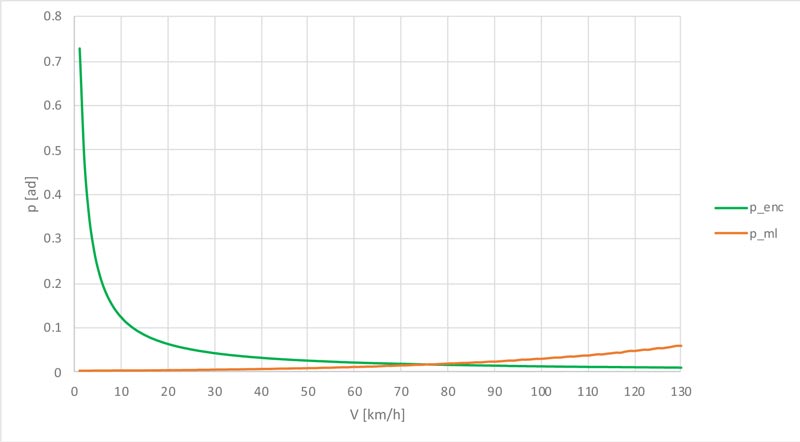
More precisely, Fig. (6) shows that the annual probability of encounter (Penc) results in a hyperbolic decrease as transit speed (v) increases. This is reasonable, because the increase in speed leads to a reduction in the vehicular permanence time on the deck. Conversely, the probability of exceeding the limit mass (Pml) shows a growth as transit speed (v) increases; this is due to the increment in dynamic amplification.
Fig. (7) shows that the annual probability of failure (Pfail), results in an initially decreasing trend until it reaches a minimum point at a certain speed which could be defined as "Optimal Transit Speed" (v0 ), in this example approximately equal to 38 km/h. Beyond the "Optimal Point", the annual probability of failure begins to increase again.
In order to understand the dependence of the annual probability of failure (Pfail) and the optimal transit speed (v0 ) by the main input parameters, a sensitivity analysis was carried out, based on varying empirical parameter (α), span length (L), annual flow rates (Qy,A = Qy,D) and limit mass (ml) individually.
Fig. (8) indicates that, once a certain transit speed (v) is fixed, the annual probability of failure (Pfail) decreases as the empirical parameter (α) increases. This is due to an increase in the structural stiffness that implies a decrease in the vehicle-bridge interaction and therefore, a decrease in the DLA. For the same reason, the optimal transit speed (v0 ) shows an increasing trend as the empirical parameter (α) increases.
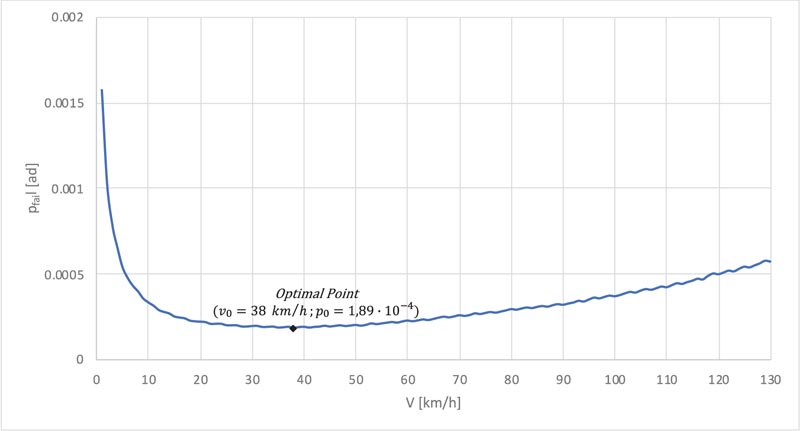
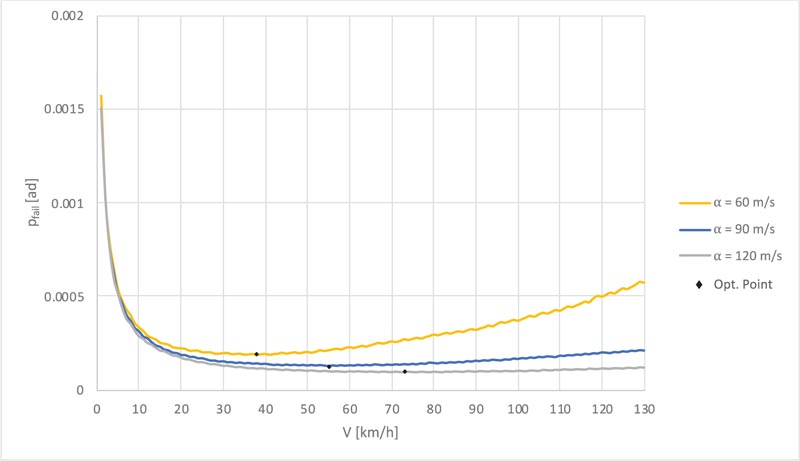
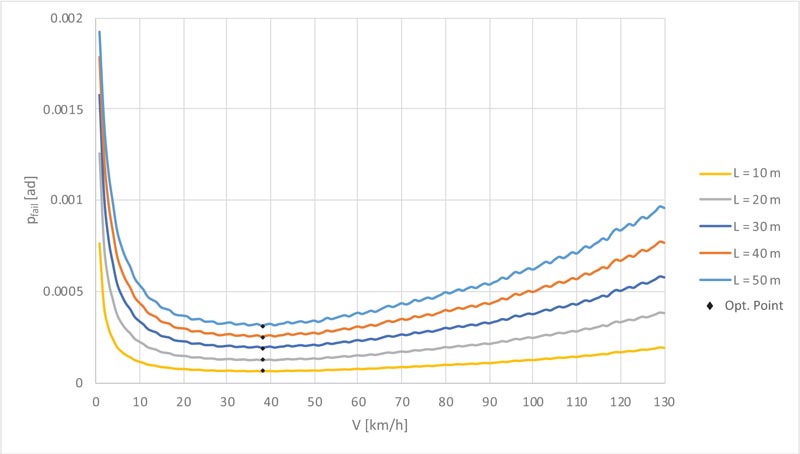
Fig. (9) indicates that, once a certain transit speed (v) is fixed, the annual probability of failure (Pfail) increases as span length (L) increases. This is due to an increase in the vehicular permanence time on the deck, which leads to a rise in the encounter likelihood. Instead, no variation is detected in the optimal transit speed (v0 ), which remains constantly equal to 38 km/h. For the sake of completeness, it should be remembered that actually the bearing capacity of the bridge, and therefore the limit mass (ml), tend to increase with the span length (L). The choice of setting the same limit mass for different bridge spans is dictated by the need to perform the sensitivity analysis. To achieve this goal, all parameters other than (L) must be kept constant, as it is used when calculating the partial derivative of a multi-variable function.
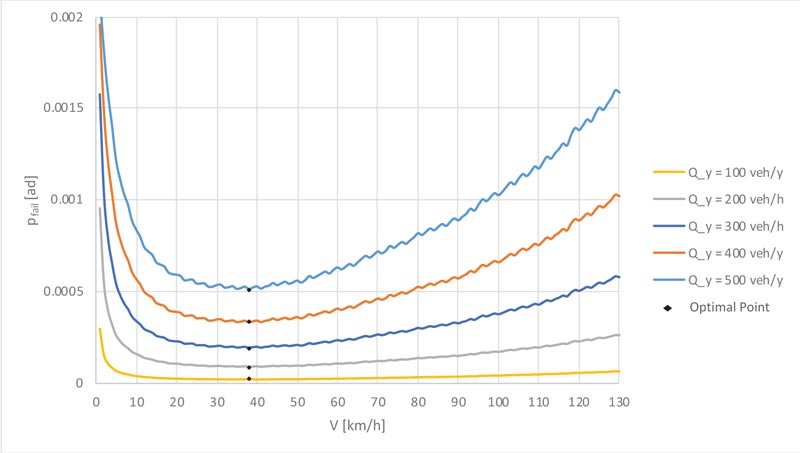
Similarly, Fig. (10) shows that, once a certain transit speed (v) is fixed, the annual probability of failure (Pfail) increases as annual flow rates (Qy,A = Qy,D) increase. Again, no variation is detected in the optimal transit speed.
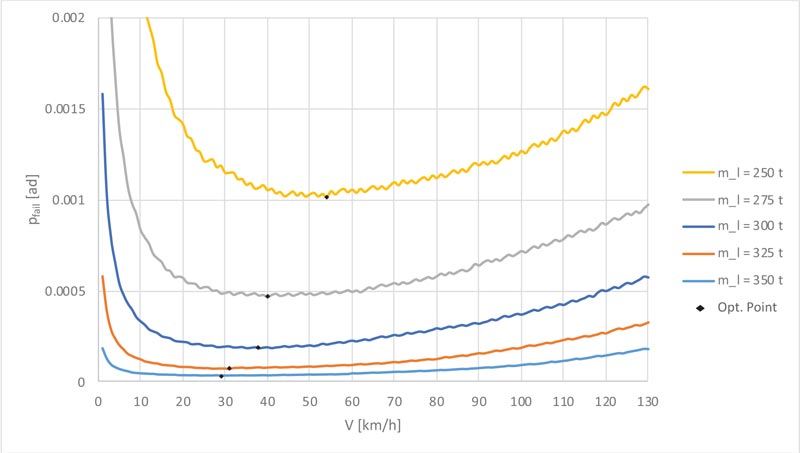
Conversely, Fig. (11) suggests that, once a certain transit speed (v) is fixed, the annual probability of failure (Pfail) decreases as the limit mass (ml) increases. This is attributable to a reduction in the likelihood of exceeding the limit mass. The optimal transit speed (v0 ) shows an increasing trend as the limit mass (ml) decreases which may seem counterintuitive. To understand the reasons for this result, let's consider the extreme case of a bridge characterized by a probability of exceeding the limit mass (Pml) equal to 1 regardless of the transit speed, i.e. a structure that is unable to withstand the simultaneous presence of two exceptional vehicles. In this case, the only way to reduce the probability of failure (Pfail) is to reduce the encounter probability (Penc) by increasing the transit speed (v).
4. DISCUSSION
A model for evaluating the annual probability of failure of a simply supported bridge subjected to exceptional vehicle transit has been developed. The results demonstrate the existence of an “Optimal Transit Speed” that minimizes the risk of failure. According to this evidence, the imposition of very low-speed limits for exceptional vehicles moving on the deck may be inappropriate. Conversely, it would be more appropriate to define a speed range obtained by imposing an annual failure probability (Pfail) that does not exceed a “Threshold Value” (Pfail,max).
This threshold should be chosen according to the maximum risk of failure deemed acceptable for the system. For example, Eurocode 1 [7] prescribes a 1000 year return period (Tret) for traffic on the main roads in Europe, which corresponds to an annual failure probability of 0,001. This would imply a certain transit speed range. Obviously, the upper limit could be only theoretical because it will have to take into account the other problems related to road safety.
The developed model is straightforward and presents general validity. Indeed, it allows calculating the probability of failure as a function of several parameters. The generality of the model implies that it can be applied to all simple supported two-way bridges. Conversely, the estimated “Optimal Transit Speed” is specific, as it is calculated assuming a certain limit mass and certain vehicles’ masses distribution. For this reason, the “Optimal Transit Speed” determined in this article may be considered acceptable only for contexts similar to that here analyzed. Therefore, the imposition of speed limits related to exceptional vehicle transit over a bridge should be decreed by applying the proposed probabilistic model, after a survey aimed at determining the site-specific model input parameters, such as heavy vehicle flow rates, masses’ probability distribution functions and the limit mass associated with the “Limit State” from which the bridge should be safeguarded. More precisely, masses’ probability distributions associated with the vehicular flow acting on the road on which the bridge is located could be experimentally determined by using weight-in-motion (WIM) systems placed on the bridge access.
The results illustrated in this article were deduced from a simplified model, regarding a simply supported single span bridge or a single span of an isostatic multiple span bridge. As a result, extensive experimentation could reinforce the hypothesis of the inadequacy of very low-speed limits and it will be investigated in a later study.
Moreover, future studies may be carried out along three research lines in order to consider the effect of the parameters neglected here.
The first research line concerns the implementation of road surface irregularities. Indeed, the roughness of the road pavement significantly affects the dynamic amplification factors: lower quality profiles result in more significant actions than “very good” profiles [10]. Moreover, the impact factor is also influenced by expansion joints. Recent studies have shown that expansion joints are one of the main causes of many defects in bridges. With an increase in gap width, the impact and possible damage are potentially more serious [17].
The second research line regards modeling vehicle dynamic characteristics, type, weight, number of axles, axle spacing and the horizontal position on the bridge. These parameters have proved to influence the dynamic amplification factors [9].
The third research line is based on analyzing the effects of fatigue and material degradation phenomena, which could lead to a limit mass reduction over time.
CONCLUSION
Finally, further studies may investigate the applicability of tools capable of managing the transit of exceptional vehicles on bridges, for example, through the implementation of ITS (Intelligent Transportation Systems) technologies based on GPS and telecommunication devices. For instance, these technologies help in tracking the movement of trucks as it happens in other transportation fields [18, 19]. In addition, the implementation of truck-specific traffic signals and Closed-Circuit Television Cameras (CCTV), having the purpose of avoiding the presence of an excessive load on the deck, may be further investigated. These are noteworthy solutions, certainly more expensive and time-consuming than the simple imposition of a vehicle transit speed, the suitability of which should be assessed in relation to economic resources available to the bridge management authorities. These research topics will have great relevance for future smart mobility.
CONSENT FOR PUBLICATION
Not applicable.
AVAILABILITY OF DATA AND MATERIALS
Some or all data, models, or codes generated or used during the study are proprietary or confidential in nature and may only be provided with restrictions.
FUNDING
None.
CONFLICT OF INTEREST
The authors declare no conflict of interest, financial or otherwise.
ACKNOWLEDGEMENTS
The authors are grateful to anonymous referees for their very helpful suggestions.
APPENDIX 1
In this appendix, the proof of the Poisson Limit Theorem (i.e., equation (13)) is provided.
In a binomial process (i.e., an experiment in which each trial can have only two outcomes, called success and failure) of N trials, the probability P(x) that an event will occur exactly x times is provided by the binomial distribution (12):
 |
(12) |
Where p is the probability of success in a single trial.
Let us define the quantity λ = p∙N, which represents the most probable number of successes in N trials and substitute it in equation (12):
 |
(33) |
Let us calculate the limit for N, which tends to infinity:
 |
(34) |
Let us develop the factorial term:
 |
(35) |
Now it is possible to simplify the terms (N-x)! to the numerator and denominator of the first fraction:
 |
(36) |
As N tends to infinity, the term N(N-1) (N-2) ....(N-x+1) tends to N x, so equation (37) can be written:
 |
(37) |
Moreover, as N tends to infinity, even the term
 tends to 1, that is:
 |
(38) |
By substituting equations (37) and (38) in (36), equation (39) is obtained:
 |
(39) |
Defining
 and substituting in equation (37), the equation (40) is obtained, that is the proof of Poisson Limit Theorem (i.e, equation (13)):
 |
(40) |
Where
 is the notable limit of the exponential.
APPENDIX 2
In this appendix, the proof of equation (15) is provided.
The probability that the encounter event will occur at least once during the reference period is provided by equation (14):
 |
(14) |
Given equation (11), by substituting x = 0, equation (41) is obtained:
 |
(41) |
Considering equation (10), the parameter λ = p∙N can be expressed as:
 |
(42) |
By substituting equations (7) and (8) in (42), equation (43) is obtained:
 |
(43) |
By substituting equations (5) and (6) in (43), considering that n=(3600∙dfi)/∆t and N=Tref / ∆t, the equation (44) is obtained:
 |
(44) |
By substituting equations (4) and (3) in (44), the equation (45) is obtained:
 |
(45) |
By substituting equation (45) in (41), equation (15) is obtained:
 |
(15) |
APPENDIX 3
In this appendix, the potential onset of the resonance phenomenon is discussed.
From equation (29) is evident that as the transient frequency (Ω1) tends to natural angular frequency (ω1), DLF tends to infinity. Indeed:
 |
(46) |
This limit case represents the resonance phenomenon between vehicle and bridge. However, the possibility of resonance can be ruled out because the loading exists only for a limited number of cycles, e.g. only a half-cycle for the first mode.
Moreover, an extremely high load velocity (vres) is required for resonance. Indeed, the limit condition Ω1 = ω1 implies that:
 |
(47) |
Assuming, for example, α=60 m/s, it would imply that vres = 120 m/s = 432 km/h, which is much higher than the usual operating speeds.
APPENDIX 4
In this appendix, the proof of equation (32) is provided.
By rewriting equation (26), the DLA can be expressed as a function of DLF:
 |
(48) |
Substituting the estimate of the DLF provided by equation (29), equation (49) is obtained:
 |
(49) |
Transient frequency (Ω) and natural angular frequency (ω1) can be expressed, respectively, as indicated in equations (50) and (51):
 |
(50) |
 |
(51) |
By inverting equation (31), equation (52) is obtained:
 |
(52) |
By substituting equations (50), (51) and (52) in (49), equation (32) is obtained:
 |
(32) |


