All published articles of this journal are available on ScienceDirect.
The Effect of Modifying Double Continuous Flow Intersections Layout Geometric Features on their Operation
Abstract
Introduction:
Continuous flow interventions were first introduced as an alternative to improve traffic operations in the intersections with severe congestion caused by heavy left-turn movements.
Objective:
This study quantified the effect of modifying the intersection angles of Double Continuous Flow Intersections (DCFI) on their operational characteristics. Mainly, the effects of changing the intersection angle between the different approaches of the main intersection and the angle of the minor cross-over intersections were investigated.
Methods:
VISSIM software simulation models were used for modifying several design features related to the DCFI and the operational performance was compared between the different simulation scenarios.
Results and Discussion:
Changes to the cross-over intersection angle increase the safety levels by providing better channelization of traffic movements on the minor intersections of the DCFI and reduce the intersection footprint to be used at high-density urban locations. Increasing the cross-over intersection angle and changing the layout geometry have adverse effects on the capacity of the conventional DCFI. This is mainly because of the added curvature in the intersection approaches which reduces the vehicle speeds, therefore reducing the overall capacity of the modified intersection when compared to the conventional DCFI. However, the total footprint for the intersection is reduced for the modified layout geometry, which improves the capacity of the DCFI.
Conclusion:
The study has explored the effects of modifying the DCFI intersection angles to fit the limited space in major urban areas on the capacity and performance of the intersection. It showed that DCFI designs could be applied in areas with limited space availability and skewed intersection angles.
1. INTRODUCTION
The interest of transportation engineers has been fueled by the high demand for transportation on the roadway networks in major urban areas [1]. The emphasis of such engineers is majorly on the testing and application of unconventional solutions for enhancing the service level of major roadway intersections [2]. These innovative unconventional intersection designs can accommodate higher traffic volumes with reduced delays in travel time [3]. This can be done by eliminating some of the phases from the signal timing plans and reducing the number of traffic conflict points within the major intersection area [4]. The unconventional intersection designs improve the Level Of Service (LOS) of at-grade intersections without the need for grade-separated interchanges, but they suffer from safety and accessibility issues that may affect the decision to apply them at a certain location [5]. The applications of unconventional intersection designs are also planned on different roadway networks around the world [6]. Such unconventional designs include Displaced Left Turn (DLT) intersections, Restricted Crossing U-Turn (RCUT) intersections, Continuous Flow Intersections (CFI) and Quadrant Roadway (QR) intersections [7].
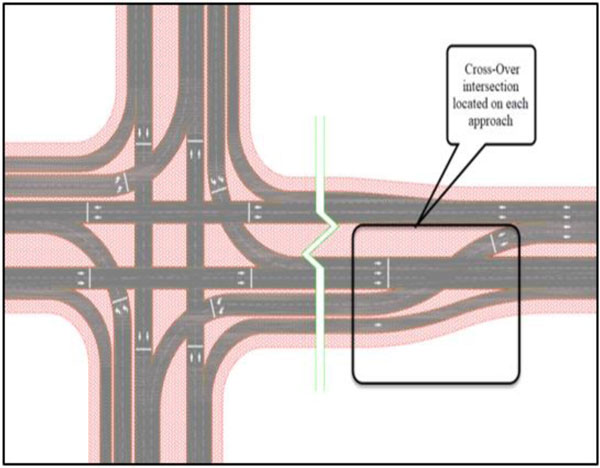
CFIs were first introduced by Francisco Mieras as an alternative to improve traffic operations in the intersections with severe congestion caused by heavy left-turn movements [8, 9]. The design of the CFI relocates the left-turn bay downstream from the main intersection area and provides an additional cross-over for that particular movement [10]. This increases the capacity of the intersection by eliminating the left-turn phase from the major signalized intersection and also helps reducing the number of conflict points at the main intersection [11]. Coordinated traffic signals are present at the main intersection area to the locations of the left-turn crossovers [12]. Due to the relocation of the left turning movement from the main intersection, this type of intersection design is sometimes called a Displaced Left Turn (DLT) intersection. The four major classes of CFIs include [13]:
- Full CFI or Double CFI (DCFI): It has a left-turn cross-over on all the four approaches of the intersection.
- CFI-T intersection: It has one cross-over intersection on a leg of the T-intersection.
- Type (A) CFI: This CFI has two cross-over intersections on two opposite intersection approaches.
- Type (B) CFI: This CFI has two cross-over intersections on two perpendicular intersection approaches.
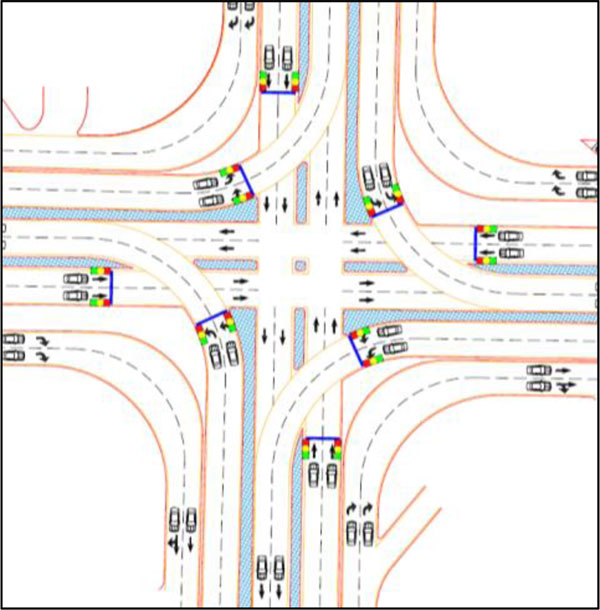
There are numerous examples of DCFI intersections that are built in different countries around the world (e.g., The U.S., Mexico and Britain) [13]. The typical layout of full DLT intersections (or DCFI), including the left turning movements, relocated on all the four approaches of the main intersection, is shown in Fig. (1). The main intersection area with slight modifications from the standard design is illustrated in Fig. (2).
Previously, studies have focused on comparisons between traditional and conventional intersection designs under similar traffic conditions or comparisons between the operational conditions of the unconventional intersection design types under different traffic conditions [14-18]. Several innovative geometry designs, such as unconventional intersection designs, have been proposed for enhancing the capacity utilization at bottleneck intersections [19]. The conflict between right-turn and left-turn is removed by most of these designs since left-turn movement is a major cause, contributing to the conventional inefficiency of at-grade intersections [20]. For instance, several designs, including median U-turn, reduce left turns by allowing drivers to first travel straight via the main intersection and then execute their left turns by making U-turns downstream [21]. The total number of phases is reduced by this design, which increases the intersection capacity [22]. However, the obstacles include that vehicles are rerouted in some traffic platforms for experiencing long-travel distance, which not merely wastes more time and fuel but also escalates the intersection demand [14]. Other designs reorganize the left-turn and traffic in tandem, such as minor intersection design before the intersection, so that all travel streams are used for both left-turn and through traffic [24]. Nonetheless, lane blocking may occur if the anterior movement is somehow unable to be fully utilized in tandem.
The performance of CFIs has been evaluated previously compared to conventional intersection design using both simulation and field observations [25]. However, most of these studies focused on optimizing the signal timing and geometric design to improve the safety levels for intersections [25, 26]. The available literature suggests that CFI and DCFIs are effective and cost-efficient design methods to increase the capacity of the intersection with some drawbacks, mainly when it comes to accessibility, pedestrians, and safety [5]. When compared to conventional four-legged signalized intersections, the DCFI design provides higher intersection capacity and has less traffic conflict points [7]. The DCFI design was found to have considerably fewer average intersection delays when compared to conventional intersections [7]. This is mainly because of the simultaneous movement of through and left-turning traffic from opposing approaches at the main intersection. However, DCFI intersections need larger areas than conventional intersections to restrict access to the intersection adjacent lands. As for pedestrian movement, the DCFI design does not provide them with the ability to cross all approaches as easily as conventional intersections because the traffic movements are not typical [7].
Al Esawey and Sayed [21] concluded that an increase of 90% in the capacity was achieved by CFI over conventional intersection design. Several studies compared the performance of CFI to conventional intersections control using VISSIM simulation software and stated that CFI intersections produced better results under different traffic demand conditions [6, 27-30]. Jagannathan and Bared [8] utilized VISSIM simulation software to evaluate CFIs of three cases with different traffic flow conditions and concluded that CFIs outperform conventional intersection control at any level of traffic demand. A major issue facing the real-life applications of DCFI is the lack of public acceptance at the early stages after operating the intersection [31]. However, the public approval ratings usually improve after the driver is more adopted to navigate through the DCFI [6]. A similar study showed a 92% satisfaction rate towards a CFI, which was developed in Baton Rouge, Louisiana.
Zhang et al. [32] have introduced a hybrid colored Petri net model for optimizing the traffic signal control of isolated intersections, comprising of a traffic signal control module and a traffic flow module. According to Bevrani and Chung [33], accurate measurement of vehicle accident queue lengths can help traffic managers to provide enhanced plans for traffic control. The length of vehicle queues during incidents is one of the major issues in highway accidents.
This study presents a new double continuous flow inter- section for urban intersection considering the critical issues of the conventional intersections discussed above. The design of urban DCFI is discussed, providing the characteristics of urban intersections and the geometrical design principles. Experi- ments taking the continuous intersections and subsequent DCFI as the study objectives are executed and the performance of the proposed DCFI using VISSIM has been validated. Lastly, the adaptability of the DCFI is also discussed by considering the characteristics of urban intersections. This study presents the findings from simulation models related to modifying design features of the double continuous flow intersection. In particular, changes to the minor cross-over intersection angle were made to increase the safety levels and reduce the intersection footprint to be used at locations where the available right of way is limited. Mainly, the variation of the intersection angle is tested to determine its effect on the space needed to apply such designs and traffic volume passing through the main intersection.
There is very little research performed to test the effect of different geometric features on the performance of unconventional intersection design. This study aims to provide a quantitative analysis of the effect of some of the DCFI design features on its operation. In this study, different design features of the DCFI are tested under different traffic volume conditions. Furthermore, a comparison of the vehicle delay and queue lengths is provided for the different tested scenarios.
2. METHODS
The study team has been involved in several studies and applications of unconventional intersection designs over the past few years. They have faced many challenges related to changes in the design features of the unconventional designs to solve issues in the site or local drivers’ behavior. There has been very limited research on the effect of geometric changes in the layout of DCFIs on their performance. This study aims to quantify the impact of modifying the geometric features of DCFIs on their operational characteristics. Mainly, the intersection angle between the different approaches of the main intersection and the angle of the minor cross-over intersections were investigated.
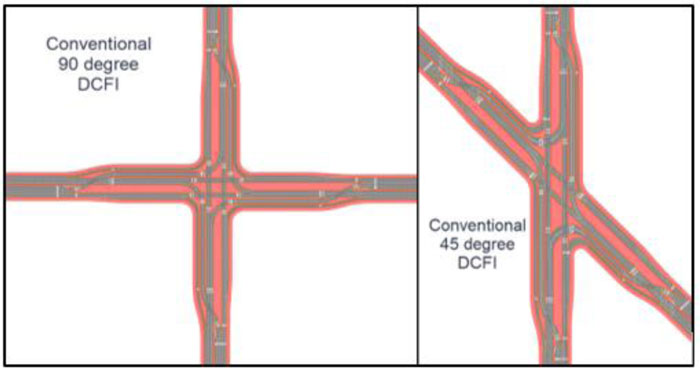
For the intersection angle of the approaches on the main intersection, two cases were modeled and tested at 45° and 90° intersection angles [34-36]. This study examined the skew angle and related factors which impacted the safety performance of the intersections. Generally, skewness refers to the angle where the intersection deviates from 90°. This is evident in the design of the highway where the alignment of the intersection is held at 90°, which results in a skewness of 0°s [37].
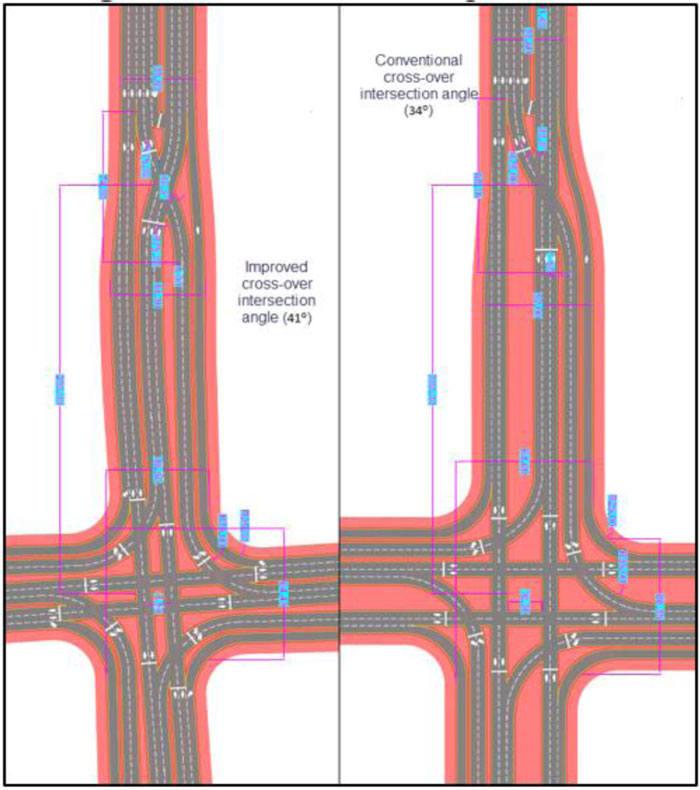
Fig. (3) illustrates the main intersection layouts that were modeled. As for the intersection angle of the minor cross-over intersections, two cases were also used, at 34° and 41° intersection angles based on the designs developed for the roadways right of way in major urban areas. The values for the minor intersections modeled scenarios resulted from the final fitted DCFI layout of the intersections based on standard roadway widths. Fig. (4) shows the two cross-over intersection angles, which were used to minimize the footprint of the DCFI. The capacity may be affected by the limited available right-of-way, which is the main objective of the modified intersection angle.
In case the intersection approach of the vehicle occurs in the presence of a queue, the vehicle can stop multiple times prior to exiting the intersection. This vehicle stopping point depends on the length of the queue. Given this, it is integral that the first stop point of the vehicle should be determined which helps obtain the queue length. The vehicle stop is identified when its speed decreases to 5km per hour. Given that a large number of urban intersections have been proposed, the detection of a stop point can depend on proposed speed at intersections. Mostly, the formula of Haversine is used for the distance computation between the vehicle stop point and stop line [38, 39]. This formula is used as it is not sensitive to the roundoff error which occurs when the distance is being measured for the two-close point. This method is executed for each route that is recorded for determining the time-dependent set of queue lengths that are processed as well as averaged in definite time intervals.
All the remaining geometric features were fixed for the different scenarios to measure the effect on the performance of the intersections. The microscopic simulation VISSIM software was used in the simulation to measure the effect of the variations in the different intersection angles and traffic conditions [40-42]. For the different test scenarios, the following conditions were applied for the traffic simulation scenarios:
- 1- All the approaches of the main intersection had equal traffic volume to give equal green time for the different phases in the signal cycle and to eliminate the effect of different phasing schemes on the performance of the intersections.
- 2- The cross-over intersections on all the approaches were located 200 meters from the main intersections (Fig. 4) based on the queuing analysis to avoid any spillback of queued vehicles on the main intersection that will affect the operation of the intersections.
- 3- The total traffic volume was increased in increments of 1000 vehicles for each model run to measure the changes in the different intersection performance parameters with increasing traffic volume.
- 4- For each simulation run, the following parameters were measured:
- (a) Total discharge volume (Q) in vehicles
- (b) Delay (t) in seconds
- (c) LOS for the intersections
- (d) Stop delay (ť) in seconds
- (e) Average queue length (θ) in meters
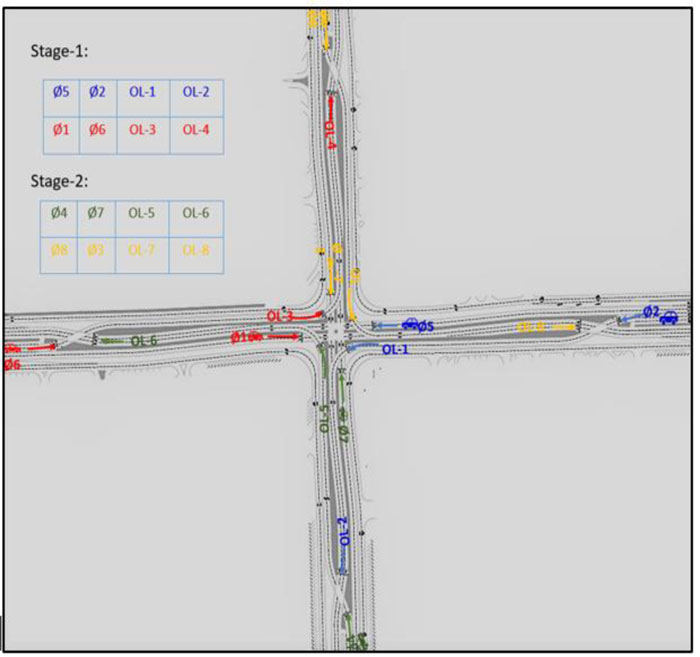
- 5- The main intersection is controlled by a two-phase signal where the phasing for the intersections will operate on two stages, as shown in Fig. (5).
3. RESULTS AND DISCUSSION
Overall, a total of sixteen scenarios were modeled for the different traffic volumes before exceeding the capacity of the intersection. This was decided to test the effect of geometric changes under different traffic conditions. In particular, only the last seven simulation runs (when the total traffic volume exceeded 10,000 vehicles per hour) were presented as the different alternatives showing similar patterns for the initial simulation runs. The scenarios presented in the results are summarized in Table 1.
| Scenario | Total Volume (Veh/Hour) | Intersection Geometry Case |
|---|---|---|
| 1 | 10,000 | A* |
| - | - | B** |
| - | - | C*** |
| - | - | D**** |
| 2 | 11,000 | A |
| - | - | B |
| - | - | C |
| - | - | D |
| 3 | 12,000 | A |
| - | - | B |
| - | - | C |
| - | - | D |
| 4 | 13,000 | A |
| - | - | B |
| - | - | C |
| - | - | D |
| 5 | 14,000 | A |
| - | - | B |
| - | - | C |
| - | - | D |
| 6 | 15,000 | A |
| - | - | B |
| - | - | C |
| - | - | D |
| 7 | 16,000 | A |
| - | - | B |
| - | - | C |
| - | - | D |
| Geometric Design Alternative | |||||
|---|---|---|---|---|---|
| A | B | % Change | C | D | % Change |
| Discharge Traffic Volume | Discharge Traffic Volume | ||||
| 9,960 | 10,027 | 0.67% | 9,920 | 10,045 | 1.26% |
| 10,912 | 11,039 | 1.16% | 10,891 | 11,006 | 1.06% |
| 11,899 | 11,994 | 0.80% | 11,933 | 11,997 | 0.54% |
| 12,898 | 12,862 | -0.28% | 12,683 | 12,857 | 1.37% |
| 13,621 | 12,992 | -4.62% | 12,685 | 12,754 | 0.54% |
| 13,217 | 12,875 | -2.59% | 12,640 | 12,794 | 1.22% |
| 13,306 | 12,701 | -4.55% | 12,519 | 12,610 | 0.73% |
The first parameter used for comparison was the total traffic volume discharged through DCFI intersections, which is considered to be an indication of the actual capacity of the intersections. The profile of the queue length depicts the changes for the single intersection approach at the day. The results for the intersections and the approaches to the queue length profile are presented in Fig. (3). The computation of every queue length is held from the aggregated queue lengths of all routes that use the traverse analyzed approach. The results are summarized in Table 2.
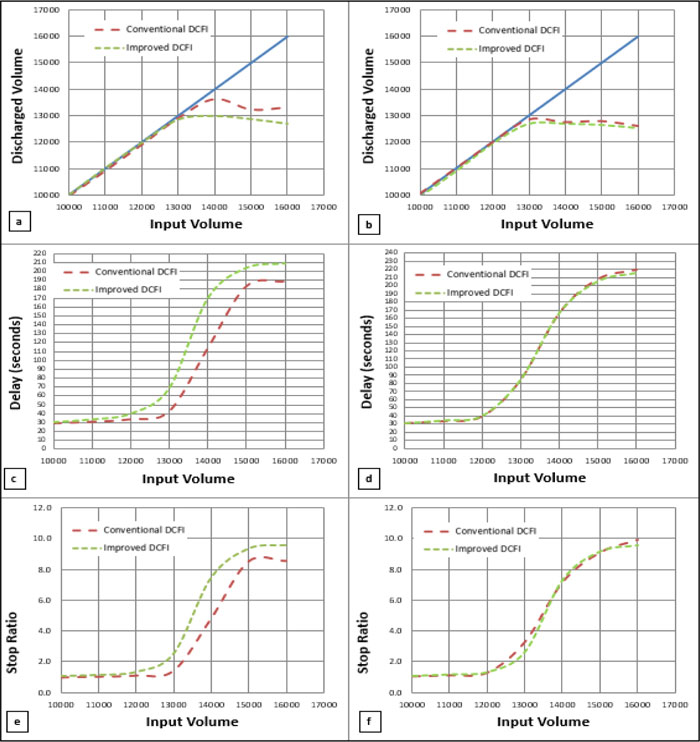
Table 2 shows the effect of changing the cross-over intersection angle, which had a minimal effect (less than 5% volume) on the discharged traffic volume through the intersections. However, the improved angle has an adverse effect on the discharged volume for the 90o DCFI because of the added curvature for the traffic leaving the main intersection. Volume-to-capacity ratio (V/C) measures the quality and mobility of a facility travel or a facility section [43-45]. When the traffic volumes approach the capacity, the added curvature affects the ability of the vehicles to maneuver smoothly through the intersection, and thus the discharged traffic volumes begin to drop. As for the 45o DCFI, there is no effect as the curvature already exists for the discharged volumes in the presence of the main intersection angle.
The results for the average vehicle delay (in seconds) for vehicles on the DCFI modeled alternatives are presented in Table 3. The delay had increased when the cross-over intersection angle of the 90o DCFI was changed because of the added curvature in the geometry. The effect of the changed geometry was significant at lower traffic volumes but was much lower as the volumes approached the capacity of the DCFI. The average delay did not change much by changing the cross-over intersection angle for the 45o DCFI where it had a maximum difference of three seconds only.
Considering the previous parameters, the stops ratio was also measured which correlates with the rear-end collisions on the DCFI over the long term. This was used as a measure of traffic safety levels of the different layout design and traffic volume scenarios. The higher stop ratios indicate a higher potential for traffic accidents within the intersection area and it is an effective tool for evaluating the long-term safety of the intersections. The stop ratios measure the roadways’ congestion level by dividing the traffic volume by the roadway capacity [46-49]. The results for the different scenarios are summarized in Table 4.
The effects of geometric changes on the layout of the DCFI are summarized in Table 5. The total width of the carriageway at the cross-over and main intersections is reduced with the changed alignment. The results of the approaches concerning the intersection present the difference between the measured performance approaches. The signal program quality is mapped by the control delay values directly. The increased control values depict high traffic volume as a result of queue formation.
| - | Geometric Design Alternative | |||||
|---|---|---|---|---|---|---|
| Input Traffic Volume | A | B | % Change | C | D | % Change |
| Average Delay (Second) | Average Delay (Second) | |||||
| 10,000 | 29 | 30 | -4.44% | 31 | 31 | -0.03% |
| 11,000 | 31 | 34 | -8.81% | 33 | 34 | -3.04% |
| 12,000 | 34 | 40 | -18.89% | 39 | 40 | -1.92% |
| 13,000 | 43 | 69 | -60.68% | 84 | 85 | -0.53% |
| 14,000 | 114 | 170 | -49.47% | 166 | 167 | -0.41% |
| 15,000 | 184 | 204 | -11.30% | 208 | 206 | 0.99% |
| 16,000 | 189 | 209 | -10.70% | 219 | 216 | 1.54% |
| Geometric Design Alternative | ||||
|---|---|---|---|---|
| Input Traffic Volume | A | B | C | D |
| Stops Ratio | Stops Ratio | |||
| 10,000 | 1.0 | 1.07 | 1.05 | 1.07 |
| 11,000 | 1.0 | 1.14 | 1.12 | 1.17 |
| 12,000 | 1.1 | 1.33 | 1.30 | 1.33 |
| 13,000 | 1.4 | 2.52 | 3.30 | 2.66 |
| 14,000 | 4.8 | 7.47 | 7.16 | 7.33 |
| 15,000 | 8.5 | 9.38 | 9.08 | 9.18 |
| 16,000 | 8.6 | 9.60 | 9.90 | 9.58 |
| Geometric Design Alternative | Area (m2) | % Improvement | Total Carriageway Width at Cross-over Intersection (m) | %Improvement | Total Carriageway Width at Main Intersection (m) | %Improvement |
|---|---|---|---|---|---|---|
| Conventional 90 Degree DCFI | 45,867 | 13.5% | 52.00 | 14.8% | 64.60 | 24.9% |
| Improved 90 Degree DCFI | 39,666 | 44.30 | 48.50 | |||
| Conventional 45 Degree DCFI | 44,869 | 12.9% | 52.00 | 14.8% | 64.60 | 22.4% |
| Improved 45 Degree DCFI | 39,069 | 44.30 | 50.10 |
Similar results are observed for the north approach control delay value in non-rush and rush periods. This is in correspondence to the estimation of the queue length concerning the analyzed approach. While the large difference in Total Control Delay (TCD) for the non-rush and rush hours for the south approach depicts an unbalanced flow of traffic, requiring the improvement in the signal program.
The simulation results for the different scenarios are shown in Fig. (6). It provides a summary of the different parameters for 45o DCFI and 90o DCFI. The two lines on each part of the graph represent the conventional design where the cross-over intersection angle was 34o while the improved layout at the cross-over intersection angle was 41o.
CONCLUSION
To address the issues of limited available space, local drivers’ behavior, and issues regarding the improvement in the safety of DCFIs, this study has introduced some changes to the layout geometry for the cross-over intersections of some of the cases. The cross-over intersection angle has been found to increase the safety of DCFI users but its effects on the operation of the DCFI are unknown. Several scenarios have been modeled using VISSIM software to evaluate the impact of the changes on the operation of the DCFI. The results from the VISSIM simulation for the different scenarios of layout geometry and traffic volume showed different results for 90o DCFI and 45o DCFI. This was mainly because of introducing curvature to the alignment of the intersection legs discharging traffic from the main intersection of the 90o DCFI. As for the 45o DCFI, the curvature already exists on those approaches because of the main intersection angle, which minimizes the effect of the modified geometry on the performance of the intersection.
The results also showed that the effects of the changed layout were negligible for low traffic volumes but became significant when the traffic volumes approached the DCFI capacity. This was mainly noticed in the average vehicle delay in the DCFI. The trends from the simulation results include the following:
- Changing the cross-over intersection angle had a very minimal effect on the traffic volume discharged from the DCFI and it mainly affected the 90o DCFI.
- The results for the average vehicle delay (in seconds) for vehicles on the DCFI showed an increase in that delay when the cross-over intersection angle of the 90o DCFI was changed. The difference in the average delay was significant at lower traffic volumes but was much lower as the volumes approached the capacity of the DCFI.
- The average vehicle delay did not change much by changing the cross-over intersection angle for the 45o DCFI.
- Changing the cross-over intersection angle improved the safety at those intersections by helping to better guide the drivers through the DCFI. Also, changing the angle helped reduce the speed of vehicles discharged from the main intersection by introducing additional horizontal curves on their path, which improve the safety of the DCFI.
- Despite increasing the cross-over intersection angle, the total width of the carriageway at the cross-over and main intersections was reduced with the changed alignment angles.
Based on the results of different scenarios, increasing the cross-over intersection angle and changing the layout geometry will have adverse effects on the DCFI if no curvature already exists in the path of the discharged vehicle (90o DCFI). The effect was found to be minimal in the case of the 45o DCFI because it already has horizontal curves in the path of vehicles discharged from the main intersection. However, the total footprint for the intersection was reduced for the modified layout geometry, which could help improve the capacity of the DCFI with the limited available space for it. Also, the safety levels for DCFI users improved with the changed layout.
It is recommended that engineers and officials should be aware of the advantages and disadvantages of the different changes made to the conventional designs of DCFI. They should maintain the right balance between available space, safety and other operational characteristics when they introduce changes in the standard design elements of the DCFI and also address driver behavior or site conditions. This will have a significant effect on the success of DCFI intersection applied on the ground. The study has explored the effects of certain geometric and volume conditions but not to replace the judgment of the professionals and officials. There are many other factors such as signing, pedestrian movement, accessibility, etc., which were not a part of the scope of this study and must be considered.
CONSENT FOR PUBLICATION
Not applicable.
AVAILABILITY OF DATA AND MATERIALS
Not applicable.
FUNDING
None.
CONFLICT OF INTEREST
The authors declare no conflict of interest, financial or otherwise.
ACKNOWLEDGEMENTS
The study team would like to acknowledge the support from the University of Jordan and Riyadh Municipality for this research.


