All published articles of this journal are available on ScienceDirect.

The Role of Attitude, Behavior, and Road Conditions in Traffic Violation among Workers and Students in Bandung City, Indonesia
Abstract
Introduction:
This study aims to explore the attitudes towards riding safety, behavior regarding safety gear, documents, and vehicle and riding preparedness, and perceived road conditions among worker and student motorcyclists, and the influence of these on their violation behavior.
Methods:
To further explore the violation behavior, the effects of the infrastructure quality, personal and travel characteristics, and the experience of accidents were also included in the variables. This study collected data on motorcycle users’ behavior in Bandung City and used Structural Equation Modeling (SEM).
Results and Discussion:
This research underlines that behavior regarding safety gear, documents, and vehicle and riding preparedness is an important factor that decreases the violation behavior. Interestingly, a positive attitude towards safe riding does not straightforwardly lead to better behavior in preparing the vehicle, safety gear, and documents.
Conclusion:
Good quality infrastructure also promotes a reduction of traffic violations. Improving road infrastructure safety and both promoting and monitoring users’ safe riding behavior are suggested to lower the number of traffic violations.
1. INTRODUCTION
Indonesia has experienced rapid motorization in recent decades, and motorcycles are among the forerunners of this growth, mainly because of their affordability, flexibility, and maneuverability [1]. Along with the rapid growth, the number of motorcycle traffic accidents has also increased significantly. In fact, in 2018, in line with the significant share of motorcycles among the total number of vehicles, motorcyclists were involved in 73% of all accidents [2]. In response to this issue, since 2015, the Indonesian government has increased the campaign to reduce aggressiveness and encourage safe driving behavior for motorcycle use, namely riding safety. The campaign consists of promoting requirements for riding such as personal safety equipment (i.e., helmet, jacket, shoes, etc.), vehicle requirements (i.e., rear-view mirror, light, etc.), and legal requirements (i.e., driving license, and vehicle document) [3, 4]. The campaign developed to personalize the importance of motorcycle equipment for safety, consequently aiming to promote safe driving behavior.
The role of driving behavior and the factors that affect it have attracted the interest of several researchers, whose user-side analysis has been found very sensitive to the causes of accidents (i.e., capabilities, failure of judgment, desire, etc.) [5-8]. The issue of driving behavior and traffic accidents are more observed in motorcyclists, such as aggressive riding, risk-taking, and exposure to danger [9]. Motorcyclists tend to deviate from safe operating practices (i.e., ignoring road rules, making miscalculations, and aggression) for various reasons. Previous studies [1, 9, 10] have indicated that riding behaviors, involving complex interactions of individuals’ intentions, attitude, and general desire to satisfy sensation-seeking behavior, are among the main causes of accidents [1]. In addition, mostly, riding behavior is also influenced by road conditions, including weather, traffic conditions, and infrastructure (i.e., geometry design, marking, etc). For instance, Sukor et al. [8] found that a more exclusive lane for a motorcyclist leads to more risky behavior, such as speeding, and Malin et al. [11] found weather as one of the determinants that influences traffic accident and driving behavior.
Moreover, some studies report that the types of traffic accidents vary according to the type of driver, such as age and occupation [12-14]. Age-related changes are found to be in line with increasing driving experience, and consequently, the perceived safety of driving is also more personalized [14]. For instance, studies have found that young motorists tend to drive more aggressively [5, 10] than older ones [1, 15]. There is also a relationship between the driver’s occupation and travel behavior. Meanwhile, younger drivers tend to be students with lower action space, repetitious trips, and fewer spatial constraints than older ones, the majority of whom can be described as workers [16]. Many studies have combined attitudes, behavior, and intentions in explaining the behavior of disregarding traffic regulations [1, 17]. However, most studies only used age variables to explain traffic accidents and disobedience towards traffic regulations, while the investigation of specific age or occupation groups for their attitudes and behavior towards safe riding, as well as their perceptions of the laws on driving, is still limited. This kind of investigation will be important in determining the right policy for specific groups of users and, therefore, in making more effective interventions to reduce traffic accidents.
Furthermore, while these factors have been investigated in various developed countries, most of the developing countries have given less attention to these issues. However, their economic, social, and cultural conditions are different from those of developed countries. Studies on traffic safety, especially for motorcyclists, using data from Indonesia, have been reported by Susilo et al. [1] and Joewono et al. [18], who employed data from a survey of 2010. A more recent study by Joewono et al. [5] used data of motorcyclists from a survey of 2017 that investigated the stability of attitudes towards safety among young (younger than 30 years old) and mature (30 years old or older) motorist groups. However, a more up-to-date study is needed due to changes in infrastructure and behavior, as well as increasing government intervention to address safe riding behavior, as the previous study found that the factors that affect traffic violations change with time.
Understanding the safety behavior of motorcyclists in Indonesia is very important. Firstly, the numbers of motorcycle users in Indonesia are predicted to continuously increase in the next decades, supported by the significant economic growth and easier affordability [18], as well as by massive development of the road network and improvement of road conditions (i.e., signing, marking, pavement, etc.) [3]. Secondly, in response to the issue of motorcycle traffic accidents, the government has been continuously promoting riding safety, with interventions addressing driving behavior [4]. Studies to investigate attitudes towards riding safety refer to the perception that riding safety (i.e., riding behavior, vehicle preparedness, etc.) could prevent accidents, and behavior regarding safety gear, documents, and vehicle and riding preparedness could produce a round of evaluations and inputs for policymaking to enable the policy of promoting riding safety to be more effective in the future. In addition, the investigation on how road conditions affected violation behavior is necessary to recommend infrastructure improvement for decreasing road accidents. Moreover, investigations are also very important to develop policy and intervention measures for changing the behavior of motorcyclists and to promote a safe driving environment in developing countries [7].
By investigating motorcyclists’ behavior based on their occupation (i.e., workers and students) in Bandung City, this study aims to explore the role of attitudes towards riding safety, the use of safety gear, documents, and vehicle and riding preparedness, and road conditions as factors affecting violation behavior. To further explore the violation behavior, the effects of personal and travel characteristics, driving conditions, and the experience of accidents were also included among the variables. Using data collected from motorcycle users in Bandung City in 2020, this study used Structural Equation Modeling (SEM) to understand the relationships between personal and travel characteristics, attitudes, and behavior regarding the use of safety gear, documents, vehicle and riding preparedness, road conditions, violation behavior, and experience of accidents.
The remaining paper is structured as follows. The second section discusses the theoretical background and research hypotheses. The third section explains the research method describing the collection of data and the respondents’ characteristics. The fourth section presents the model estimation, followed by the discussion and conclusion sections.
2. DRIVING VIOLATIONS AND TRAFFIC SAFETY
As a backbone of the transport system, ensuring the safety of road mobility has been the main policy agenda in various countries. However, due to increasing road mobility caused by motorization and increasing economic activities, road accidents are still a leading cause of the loss of life worldwide. Traffic accidents mostly involve motorcycle users in both developing and developed countries [1]. However, most traffic accidents are preventable due to the greater influence of human factors. The characteristics of road transportation, differing from air or rail transportation, are not designed with safety as a jumping-off point; therefore, it is mainly the users who make the difference between danger and safety [19].
Among many other reasons, it is the behavior of motorcyclists that is mostly responsible for accidents. A study by Cunto and Ferreira [20] showed that traffic accidents in Brazil were partly caused by risk-taking behavior by motorcyclists and their disregard for traffic laws, such as speeding, illegal lane changes, failing to wear a helmet, and running on red lights. Anger and aggression during driving have also been highlighted by Sarma et al. [21] as causing an increase in the probability of traffic accidents and have been a serious concern in Australia, India, Indonesia, and many other countries [1, 9, 22]. Interestingly, motorcyclists are conscious that being on a motorbike exposes them to greater danger and, even when they know the limitations and capabilities of the vehicle, they do not want to lose the enjoyment and sensation of riding [23]. These researchers underline that more studies are needed to comprehensively investigate the motives and decision-making processes behind the risky behaviors and attitudes of motorcyclists.
Moreover, research has also found that traffic violations are influenced by the users’ socio-demographic factors, vehicle characteristics, attitudes and desires, and environment. An investigation on the socio-demographic factors observed that more aggressive and risky behaviors are found to be associated with male and younger motorcyclists [5, 21]. In contrast, more experienced, mature, or married drivers tend to avoid traffic violations [1, 24]. The maturity of driving behavior can also be explained by the motorcyclist’s occupation, and Susilo et al. (2015) found that student motorcyclists were less compliant with traffic regulations than commuters or workers. In terms of environment design, some studies found that infrastructure design also influences driving behavior and traffic accidents. A study by Sukor et al. (2017) found that speeding behavior mostly occurred on wider, straight, and segregated roads, where the infrastructure increases the sense of overwhelming confidence. Higher street levels such as major roads tend to lead to more aggressive driving [25].
The violation behavior caused by motorcyclists’ attitudes towards driving has also been investigated. While a greater tendency towards anger management has the effect of less violation [21], a positive attitude toward speeding tends to be associated with a higher possibility of traffic violation [26]. Lower social norms or normlessness, such as disregarding law enforcement, also leads to a higher tendency to violation [8], [27]. In terms of driving behavior, violation of the rules increases the probability of accidents and is related to risky and aggressive driving [27]. The behavior of thrill-seekers is found to involve either underestimating or accepting risks as the price of the sensation or experience, and this influences motorcycle riders’ decisions to engage in unsafe and, particularly, risky behavior [28].
Most of the attitude and traffic violation studies have adopted the approach of the Theory of Planned Behavior (TPB) [29]. It is argued that individuals’ actions are a function of individual intentions, influenced by the individual’s attitude towards the behavior, subjective norms, and perceived behavioral control to execute the choices. Sukor et al. [8] implemented this relationship to study the psychological factors, defined by six factors (i.e., attitudes, desires, fears, moral obligation, perceived behavior controls, and perceived behavior of others), and their implications for motorcyclist’s risky behaviors in Malaysia. Susilo et al. [1] extended the analysis to compare the relations of motorcyclist driving behaviors and their traffic regulation violation between the populations of multiple cities in Indonesia. The studies using TPB on traffic accidents and driving behavior [1, 30] underline the importance of understanding better this relation between behaviors and populations.
Overall, given the previous studies, it is important to include attitudinal factors in studies on traffic violations. It is also essential that the relations are investigated along with the effect of road conditions. Moreover, by conducting a separate analysis based on motorcyclist occupations (i.e., students and workers), the investigation of the role of their attitudes and infrastructure in traffic violation will give more insight into specific users. Unlike studies in developed countries, this study took place in Indonesia, as representative of developing countries undergoing significant motorization and experiencing high levels of motorcycle traffic accidents. This study will potentially enable us to develop policies for specific groups in society and enrich the studies on traffic accidents in developing countries.
3. METHODOLOGY
3.1. Structural Equation Modeling (SEM)
SEM is a statistical modeling technique that can handle multiple and simultaneous regression equations by accommodating a large number of endogenous and exogenous variables [31]. Thus, SEM has a unique capability than multiple regression, factor analysis, multivariate analysis of variance, discriminant analysis, and other techniques which can examine only a single relationship at a time [32]. As a simultaneous equations system combining path analysis, factor analysis, regression analysis, etc., SEM is a confirmatory method used to capture the causal influences of exogenous variables on endogenous variables and that of endogenous variables upon one another [31]. Also, an important benefit found in SEM is that variables can be conceptualized as latent variables where they act as theoretical constructs that cannot be observed directly. Instead, they must be operationally defined by observable behaviors.
Mostly, SEM application is for a confirmatory analysis as it requires the structure/construct in terms of a system of the relationship of one variable to another [31]. As there are simultaneous equations in SEM, SEM requires a distinction between variables or constructs, namely exogenous and endogenous constructs. The exogenous construct refers to the latent, multi-item equivalent to independent variables, while the endogenous constructs are the latent, multi-item equivalent to dependent variables [32]. With latent variables, the constructs in the SEM are conducted by three sets of simultaneous equations [31]. The first one is a measurement model (or submodel) for the endogenous (dependent) variables. The second one is a measurement (sub)model for the exogenous (independent) variables, and the last one is a structural (sub)model. All these models are estimated simultaneously. The structural model in SEM is used to capture the regression effect of the exogenous variables on the endogenous variables. The causal relationship among endogenous variables is also captured by SEM [31, 32], and it also allows the specification of error-term covariances.
While there are various estimation procedures for SEM (i.e., Generalized Least Square (GLS) and weighted least squares (WLS), the most common SEM estimation procedure is Maximum Likelihood Estimation (MLE) [32]. The MLE procedure has been proven to maximize the probability that the observed covariances are drawn from a population that has its variance-covariances generated by the process implied by the model. The parameters of MLE estimators have been widely investigated [33, 34] for their effect on violations from normality and sample size on biases of estimators. Hair et al. argued [32] that under ideal conditions, MLE provides valid and stable results with sample sizes as small as 50. As one deviates from ideal conditions (very strong measurement and no missing data) to minimum sample sizes, it is difficult to ensure stable MLE solutions due to sampling error [32].
There are several parameters to assess the model validity of SEM [32]. Root Mean Square Error of Approximation (RMSEA) is one of the most widely used methods for assessing how well the model fits a population [31], and not just a sample used for estimation. Previous research had sometimes pointed to a cutoff value of .05 or .08; more recent research points to the fact that drawing an absolute cutoff for RMSEA is inadvisable [35]. The second most common parameter is the root mean square residual (RMR), which represents the square root of the discrepancy between the sample covariance matrix and the model covariance matrix. RMR is assessed whether the sample variances and covariances differ from their estimates obtained under the assumption that the model is correct [32]. The third one is the normed chi-square obtained by dividing the chi-square (χ2) by the model degree of freedom (df). While chi-square (χ2) statistics represents the absolute fix index, the objective of dividing it with df is to decrease its sensitivity to the sample size [32]. The criterion for acceptance varies across researchers, ranging from less than 2 to less than 5 [36].
Moreover, with advantages over other methods, as explained in this article, SEM has been applied in various research studies on various topics such as psychology, sociology, biological science, and market research [31]. Some studies on traffic safety have also applied SEM, especially when the objective is to reveal the relationship between underlying behavior, reason, attitude, habit, etc [1, 5, 8, 37, 38]. With this feature, this study used SEM for investigating the underlying relationship between attitude, behavior of riding safety, road conditions, and driving conditions of motorcyclists in traffic violation among workers and students.
3.2. Research Hypotheses
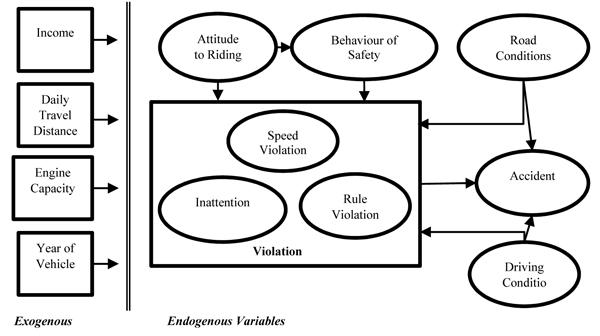
Hair et al. [32] argued that SEM should be used when the research has a strong theoretical basis for specification. Therefore, the theoretical relationship of the role of attitudes and behavior in riding safety, as well as of infrastructure and driving conditions in influencing violations and consequently traffic accidents, was developed based on the findings of previous literature [1, 8, 12]. Data has provided evidence that most of the traffic violations that occur include speeding, inattention while driving, and disregarding traffic laws [21], [26], resulting from human behavior associated with general desire and satisfaction seeking. The structural model that represents the theoretical relationship is illustrated in Fig. (1). The hypotheses which construct the structural model are as follows:
3.2.1. First Hypotheses
Motorcyclists’ violation behavior is represented by their attitude towards riding safety and their behavior regarding safety gear, documents, vehicle and riding preparedness, and driving conditions. Previous research studies [1, 30] argued that attitude influences the decision to perform an activity. From the perspective of safety research, the attitude towards riding safety, referring to the perception of individuals that riding safety and vehicle and riding preparedness influence to decrease the probability of accidents, will influence the individuals’ intention and behavior to do traffic violations. Moreover, preparing the driving gear and the vehicle to ensure safe riding influences behavior that is also assumed to influence traffic violation.
3.2.2. Second Hypotheses
The road conditions (i.e., traffic, weather, and infrastructure) and driver conditions are related to the traffic violations and attitudes towards riding safety. Previous studies have found that the quality of the road conditions affects aggressive riding and speeding, and consequently, the occurrence of accidents [8, 11]. Moreover, driving when tired, fatigued, or sleepy [1] has been associated with a decrease in the ability to drive safely, thus increasing the probability of traffic accidents [39, 40].
3.2.3. Third Hypotheses
The effects of attitudes towards riding safety and behavior regarding safety gear, documents, and vehicle and riding preparedness on violation differ between workers and students. As previous studies [10, 24] have indicated that there is a significant socio-demographic (i.e., occupation) influence and mediated variables for a traffic violation, the multigroup analysis will be performed on motorcyclist occupations (i.e., workers and students as separate groups). According to earlier studies [5, 21, 24], it was found that students are more aggressive with less personalized attitudes towards riding safety.
Moreover, the researchers assumed that exogenous variables of personal characteristics (i.e., income), travel characteristics (i.e., daily travel distance), and vehicle characteristics (i.e., engine capacity and year of vehicle) are influenced by all endogenous variables. SEM is performed with AMOS software, and the MLE estimation procedure is also used.
4. DATA COLLECTION
4.1. Questionnaire Development
This study distributed questionnaires to motorcycle users in Bandung City, Indonesia. We determined the sample size of 400 using Yamane’s equation [41], considering that the population of Bandung was 2,503,710 [42] and assuming a 5% significance level. The sample size was upgraded to 450 to overcome the possibility of errors during the survey. The questionnaire was constructed based on the literature regarding attitudes towards riding safety and behavior regarding safety gear, documents, and vehicle and riding preparedness [1, 23], road safety infrastructure [8, 21], and traffic violations [5].
The questionnaire had six parts. The first part contained questions about the respondents’ socio-demographic characteristics, such as gender, age, occupation, education level, income, and access to a car/motorcycle. Travel characteristics, such as travel distance, travel time, and motorcycle characteristics (i.e., engine capacity and year vehicle), were asked in the second part of the questionnaire. The third part was related to the attitude towards riding safety. In this part, the respondents had to indicate their agreement with riding safety policy (e.g., riding safety could prevent accidents, always carry one’s driving license, and routine services needed for ensuring safe driving) using a 5-point Likert scale from 1 (strongly disagree) to 5 (strongly agree). In the fourth part of the questionnaire, respondents were asked about their riding safety behavior, including the use of safety equipment (i.e., helmet, gloves, and jacket), vehicle control (i.e., warming up, checking fuel, and regular maintenance), and document requirements (license) using a 5-point Likert scale from 1 (never) to 5 (always). The fifth section of the questionnaire was related to traffic violations (i.e., speed violation, inattention while driving, and rule violations) using an ordinal level from 1 representing never to 5 representing more than 30 times a month. In the last part of the questionnaire, the respondents were asked about their behavior when driving under body conditions (i.e., fatigued, tired, and sleepy) and their experience of accidents (i.e., fatal, minor, and moderate) using an ordinal level from 1 representing never to 5 representing more than 10 times.
We administered the questionnaire survey from April 1 to June 16, 2020, after a series of reviews and revisions from a pilot survey. With the limitation of face-to-face interactions during the outbreak, the data collection was conducted on an online platform. The web-based questionnaire was distributed through various online forums (i.e., WhatsApp, Facebook, Instagram, Twitter, and Line). Given the natural limitation of respondents’ accessibility of online questionnaire, this survey retains bias from the possibility that some groups of the society cannot access the questionnaire due to their limitation, such as people who do not have smartphone or access to the internet and thus not have a social media account. On the other hand, people who are more familiar with social media and have higher access to the internet and ICT facilities tend to be more likely to access this online questionnaire. Therefore, this study defines the respondents as people who have a smartphone and have access to the internet and social media. However, with most of the people in Indonesia having access to a smartphone in 2020 [43], especially in big cities such as Bandung, this limitation was not considered. The web-based questionnaire was distributed by the authors through various connections and was facilitated by students and other colleagues. Moreover, to maximize the randomness of the sample, some surveyors recruited through social media randomly also helped in the questionnaire distribution. Similarly, they distributed the questionnaire through their social media and connections to avoid physical interactions. After the survey was completed, we evaluated the data based on completeness. We found that 396 questionnaires could be used for further analysis.
4.2. Data Description
Table 1 presents the respondents’ characteristics. The majority of respondents are males, and the most common occupation for workers is to become an entrepreneur (40.7%). While the monthly income distribution for workers is dominated by respondents within a range of 3 to 6 million IDR/month (equal to 206-413 USD) (38.7%), most of the students have less than 1 million IDR (equal to 68 USD) allowance/month (61.4%). Interestingly, students have more motorcycle availability than workers, but they use older motorcycles. The majority of the respondents travel 11–25 km taking 15-30 minutes of travel time. Workers and students differ statistically in terms of age, income, and years of motorcycles based on the Chi-Square value.
Table 1.
| Variables | Workers |
Students (N=246) |
Chi-Square W vs. S |
|
|---|---|---|---|---|
| (N=150) | ||||
| Gender | Male | 60.0 | 63.8 | -0.580 |
| Female | 40.0 | 36.2 | ||
| Age | <18 years old | 0.0 | 7.3 | -245.648** |
| 18-23 years old | 25.3 | 91.5 | ||
| 24-40 years old | 44.0 | 1.2 | ||
| 41-60 years old | 30.7 | 0.0 | ||
| >60 years old | 0.0 | 0.0 | ||
| Monthly income/allowance‡ | < IDR. 1.000.000 | 14.7 | 61.4 | -184.974** |
| IDR. 1,000.000 - IDR. 3,000,000 | 8.0 | 24.4 | ||
| IDR. 3,000.001 - IDR. 6,000,000 | 38.7 | 6.9 | ||
| IDR. 6,000.001 - IDR. 9,000,000 | 23.3 | 1.2 | ||
| IDR. 9,000.001 - IDR. 12,000,000 | 9.3 | 5.3 | ||
| > IDR. 12,000,000 | 6.0 | 3.7 | ||
| Availability of motorcycle | 1 | 64.7 | 0.4 | 4.772* |
| 2 | 26.7 | 69.5 | ||
| >2 | 8.7 | 30.1 | ||
| Average travel distance | < 10 km | 34.7 | 42.3 | 5.846 |
| 10-25 km | 52.7 | 49.6 | ||
| 26-50 km | 11.3 | 8.1 | ||
| > 50 km | 1.3 | 0.0 | ||
| Average travel time | < 15 minutes | 8.0 | 11.0 | 4.551 |
| 15 - 30 minutes | 44.0 | 41.9 | ||
| 31 - 60 minutes | 35.3 | 39.8 | ||
| 61 - 90 minutes | 10.7 | 5.7 | ||
| > 90 minutes | 2.0 | 1.6 | ||
| Years of motorcycle | < 2010 | 8.0 | 56.1 | -7.986** |
| 2010 - 2015 | 41.3 | 41.1 | ||
| > 2015 | 50.7 | 2.8 | ||
| Engine Capacity | 125 cc | 64.7 | 56.1 | 2.875 |
| 150 cc | 33.3 | 41.1 | ||
| 250 cc and above | 2.0 | 2.8 | ||
Table 2 describes the violation and accident characteristics. It shows that students tend to have more traffic violations and a higher mean. The t-test that compares workers and students indicates t-statistics, which also shows significant numbers across all violation factors. The students’ violation behaviors are mostly inattention while driving and riding at a higher speed than other riders. The least frequent violations are for not installing a rear-view mirror. For workers, the highest violation is inattention while driving, and the lowest is a rule violation. Moreover, most of the worker respondents have less experience of accidents, especially fatal accidents.
| Variables | Students | Workers |
Compare Means W vs. S |
||
|---|---|---|---|---|---|
| Mean | Std. Dev. | Mean | Std. Dev. | T-stat | |
| Speeding violationa | |||||
| Higher speed than other riders | 2.683 | 1.001 | 1.740 | 1.083 | 8.815 |
| Higher speed than allowed | 2.057 | 0.686 | 1.360 | 0.571 | 10.435 |
| Higher speed than the regulation | 2.541 | 0.869 | 1.567 | 0.893 | 10.705 |
| Speeding in residential areas | 2.215 | 0.884 | 1.487 | 0.792 | 8.271 |
| Activity influencing inattention while drivinga | |||||
| Thinking about what I want to do at the destination | 2.736 | 1.022 | 2.007 | 1.026 | 6.868 |
| Thinking about work/study task when driving | 2.313 | 0.805 | 1.787 | 0.774 | 6.403 |
| Thinking about social life when driving | 2.484 | 0.846 | 1.600 | 0.76 | 10.473 |
| Listening to music while driving | 2.797 | 1.125 | 1.893 | 1.024 | 8.018 |
| Rule violationa | |||||
| Stopping at the wrong side on the traffic light | 1.732 | 0.746 | 1.287 | 0.56 | 6.748 |
| Riding at the wrong side | 1.679 | 0.722 | 1.247 | 0.491 | 7.084 |
| Illegal U-turn | 1.898 | 0.707 | 1.447 | 0.681 | 6.254 |
| Not installing rear-view mirror | 1.715 | 0.885 | 1.273 | 0.612 | 5.865 |
| Riding on the sidewalk | 1.898 | 0.891 | 1.433 | 0.727 | 5.659 |
| Experience of accidentb | |||||
| Minor accident: minor physical injury | 1.907 | 0.864 | 1.687 | 0.743 | 2.587 |
| Moderate accident: moderate physical injury | 1.557 | 0.690 | 1.480 | 0.621 | 1.117 |
| Fatal accident: fatal injury | 1.305 | 0.607 | 1.133 | 0.428 | 3.290 |
Most of the respondents had a strong perception of riding safety. This is shown by a number higher than the median value (3). Safe riding behavior also showed a high adaptation level. The highest behavior was bringing their license for workers and using a standard helmet for students. Several indicators such as accidents, the perception that riding safety could prevent accidents, checking/warming up the motorbike, vehicle document/license, and regular checking up of the motorbike were statistically different among the two groups. Considering the road conditions, most of the respondents had average perceptions. The highest perception was for road sign conditions for both workers and students, while the lowest was traffic conditions for workers and students (Table 3).
| Variables | Students | Workers | Compare Means | ||
|---|---|---|---|---|---|
| Mean | Std. Dev. | Mean | Std. Dev. | T-stat | |
| Attitude towards riding safetya | |||||
| Riding safety could prevent accidents | 4.516 | 0.517 | 4.353 | 0.725 | 2.405 |
| Checking vehicle even for short-distance travel could avoid accidents | 3.045 | 1.062 | 2.920 | 1.251 | 1.018 |
| For security, always bring the driving license and vehicle document | 4.476 | 0.583 | 4.487 | 0.621 | -0.179 |
| Routine servicing needed to ensure safe driving | 4.297 | 0.668 | 4.127 | 0.929 | 2.113 |
| Behavior on safety gear, documents, and preparednessb | |||||
| Checking/warming up the motorbike engine before riding | 3.972 | 0.901 | 4.227 | 0.812 | -2.836 |
| Checking the fuel of the motorbike | 4.260 | 0.786 | 4.213 | 0.747 | 0.586 |
| Bringing vehicle documents | 4.484 | 0.704 | 4.647 | 0.636 | -2.374 |
| Bringing driver license | 4.407 | 0.902 | 4.74 | 0.573 | -4.499 |
| Using standard helmet | 4.500 | 0.716 | 4.447 | 0.681 | 0.733 |
| Using jacket | 4.309 | 0.763 | 4.273 | 0.81 | 0.440 |
| Using gloves | 3.447 | 0.949 | 3.560 | 0.945 | -1.691 |
| Regularly checking the motorbike | 3.707 | 0.805 | 3.873 | 0.762 | -2.030 |
| Road conditionsc | |||||
| Road sign conditions | 3.646 | 0.665 | 3.760 | 0.748 | -1.573 |
| Road surface conditions | 3.325 | 0.717 | 3.553 | 0.764 | -2.995 |
| Road marking conditions | 3.427 | 0.695 | 3.607 | 0.704 | -2.487 |
| Road width conditions | 3.362 | 0.725 | 3.507 | 0.749 | -1.905 |
| Weather conditions | 3.537 | 0.692 | 3.607 | 0.713 | -0.967 |
| Traffic conditions | 3.020 | 0.81 | 3.373 | 0.816 | -4.188 |
| Lighting conditions | 3.341 | 0.692 | 3.533 | 0.702 | -2.663 |
| Sidewalk conditions | 3.195 | 0.882 | 3.48 | 0.712 | -3.346 |
| Road geometry conditions | 3.321 | 0.618 | 3.493 | 0.610 | -2.702 |
| Physical driving conditionsd | |||||
| Fatigued | 2.126 | 0.649 | 1.620 | 0.587 | 7.802 |
| Tired | 2.118 | 0.797 | 1.633 | 0.689 | 6.170 |
| Sleepy | 1.931 | 0.717 | 1.413 | 0.604 | 7.388 |
5. MODEL OF TRAFFIC VIOLATION
The Confirmatory Factor Analysis (CFA) in SEM is used to estimate the EWB relationship with the travel changes during the new normal. The CFA, which was developed based on nature or current theory, assumed that the latent constructs cause the measured variables, and this assumption results in an inability to explain these measures completely [44]. For the proposed model construct, there are eight latent variables which construct by their indicators. Estimation of the latent construct and the observed variables is described in Table 4. It shows that except for the latent variables of inattention while driving, including speeding violations and experience of accidents for students, the Cronbach’s alpha values for all the latent variables ranged from 0.707 to 0.90, exceeding the critical value of 0.7, thus indicating good internal consistency [45]. Furthermore, the study by Ursachi et al. [46] stated that the value of Cronbach’s alpha of 0.6 or above also reaches the acceptable level of reliability. The t-statistics values given in Table 4 indicate that all the observed indicators for the latent variables performed well, taking into account the threshold of 1.96 t-stat for 5% significance.
| Latent Construct | Workers | Students | ||||
|---|---|---|---|---|---|---|
| Std. Coeff | Unstd. Coeff | T-stat | Std. Coeff | Unstd. Coeff | T-stat | |
| Inattention while driving (α [Student; Workers] = 0.612; 0.720) | ||||||
| Thinking about what I want to do at the destinations | 0.703 | 1 | 0.559 | 1 | ||
| Thinking about work/study task when driving | 0.762 | 0.817 | 8.022 | 0.708 | 0.995 | 7.300 |
| Thinking about other social life when driving | 0.660 | 0.694 | 7.100 | 0.804 | 1.185 | 7.373 |
| Hearing music while driving | 0.511 | 0.725 | 5.598 | 0.222 | 0.437 | 2.967 |
| Rule violation (α [Student; Workers] = 0.750; 0.736) | ||||||
| Stopping at the wrong side on the traffic light | 0.700 | 1 | 0.603 | 1 | ||
| Riding at the wrong side | 0.753 | 0.939 | 7.750 | 0.768 | 1.228 | 9.007 |
| Illegal u-turn | 0.630 | 1.098 | 6.686 | 0.381 | 0.600 | 5.207 |
| Not installing rear-view mirror | 0.491 | 0.776 | 5.322 | 0.653 | 1.283 | 8.082 |
| Riding at the sidewalk | 0.467 | 0.877 | 5.068 | 0.637 | 1.259 | 7.935 |
| Speeding violation (α [Student; Workers] = 0.612; 0.772) | ||||||
| Higher speed than other riders | 0.660 | 1 | 0.367 | 1 | ||
| Higher speed than allowed | 0.725 | 0.576 | 7.521 | 0.605 | 1.124 | 4.566 |
| Higher speed than the regulation | 0.879 | 1.081 | 8.478 | 0.761 | 1.779 | 4.702 |
| Speeding in residential areas | 0.543 | 0.606 | 5.873 | 0.471 | 1.133 | 4.177 |
| Accident experience (Cr [Student; Workers] = 0.667; 0.690) | ||||||
| Minor accident: minor physical injury | 0.772 | 1 | 0.522 | 1 | ||
| Moderate accident:: moderate physical injury | 0.788 | 0.853 | 6.692 | 0.724 | 1.109 | 6.145 |
| Fatal accident: fatal injury | 0.439 | 0.328 | 4.659 | 0.697 | 0.938 | 6.165 |
| Physical driving conditions (α [Student; Workers] = 0.735; 0.701) | ||||||
| Fatigue | 0.633 | 1 | 0.781 | 1 | ||
| Tired | 0.664 | 1.236 | 4.604 | 0.786 | 1.238 | 7.729 |
| Sleepy | 0.688 | 1.118 | 6.678 | 0.556 | 0.787 | 7.525 |
| Attitude towards safety riding (α [Student; Workers] = 0.796; 0.658) | ||||||
| Safety riding could prevent accident | 0.822 | 1 | 0.727 | 1 | ||
| Checking vehicle even for short distance travel | 0.576 | 0.817 | 6.159 | 0.699 | 0.851 | 10.288 |
| For security, always bring the driving license and vehicle document | 0.727 | 0.837 | 7.222 | 0.826 | 1.104 | 12.056 |
| Routine services needed for ensuring the safety driving | 0.343 | 0.624 | 3.743 | 0.575 | 0.905 | 8.475 |
| Behavior of safety driving gear, documents, and preparedness (α [Student; Workers] = 0.779; 0.759) | ||||||
| Checking/warming up the motorbike engine before riding | 0.752 | 1 | 0.82 | 1 | ||
| Checking the fuel of motorbike | 0.571 | 0.638 | 6.316 | 0.647 | 0.992 | 10.653 |
| Bring vehicle documents | 0.636 | 0.790 | 7.020 | 0.776 | 0.930 | 13.446 |
| Bring driver license | 0.590 | 0.861 | 6.528 | 0.644 | 0.860 | 10.59 |
| Using standard helmet | 0.319 | 0.506 | 3.544 | 0.356 | 0.543 | 5.437 |
| Using jacket | 0.600 | 0.949 | 6.636 | 0.61 | 0.79 | 9.92 |
| Using glove | 0.392 | 0.725 | 4.353 | 0.099 | 0.160 | 1.476 |
| Regularly checking up the motorbike | 0.433 | 0.645 | 4.808 | 0.299 | 0.409 | 4.537 |
| Infrastructure quality (α [Student; Workers] = 0.834; 0.900) | ||||||
| Road sign conditions | 0.660 | 1 | 0.550 | 1 | ||
| Road surface conditions | 0.696 | 1.408 | 7.567 | 0.641 | 1.526 | 7.393 |
| Road marking conditions | 0.498 | 0.880 | 5.606 | 0.400 | 0.814 | 5.250 |
| Road width conditions | 0.665 | 1.235 | 7.277 | 0.64 | 1.364 | 7.390 |
| Weather conditions | 0.816 | 1.427 | 8.643 | 0.673 | 1.375 | 7.622 |
| Traffic conditions | 0.849 | 1.615 | 8.925 | 0.652 | 1.374 | 7.472 |
| Lightning conditions | 0.797 | 1.481 | 8.482 | 0.74 | 1.447 | 8.045 |
| Sidewalk conditions | 0.686 | 1.195 | 7.478 | 0.611 | 1.243 | 7.174 |
| Road geometry conditions | 0.709 | 1.253 | 7.694 | 0.612 | 1.588 | 7.184 |
| Model Estimation for Workersa | ||||||||
|---|---|---|---|---|---|---|---|---|
| Variables | Attitude towards safety riding | Behavior of safety driving gear, documents, and preparedness | Road conditions | Speeding violation | Physical driving conditions | Inattention while driving | Rule violation | Experience in accident |
| Endogenous variables | ||||||||
| Attitude towards safety riding | 0.394*** | 0.033 | 0.004 | -0.104 | ||||
| Behavior of safety driving gear, documents, and preparedness | -0.307 | 0.183 | -0.273*** | |||||
| Road conditions | -0.561*** | -0.594*** | -0.199** | -0.167 | ||||
| Speeding violation | -0.016 | |||||||
| Physical driving conditions | 1.218*** | 1.476*** | 0.655*** | 0.844 | ||||
| Inattention while driving | 0.053 | |||||||
| Rule violation | -0.045 | |||||||
| Exogenous variables | ||||||||
| Income | 0.075** | 0.067** | -0.039* | 0.071** | -0.002 | 0.002 | 0.033 | -0.028 |
| Travel distance | -0.096 | -0.023 | -0.006 | -0.104 | 0.012 | 0.075 | -0.026 | 0.008 |
| Engine capacity | 0.01 | -0.04 | 0.014 | 0.001 | 0.067 | -0.186* | 0.013 | 0.072 |
| Year of motorcycle | -0.037 | 0.151** | 0.182*** | -0.019 | -0.133** | -0.08 | -0.014 | 0.126 |
| Model Estimation for Studentsa | ||||||||
| Variables | Attitude towards safety riding | Behavior of safety driving gear, documents, and preparedness | Road conditions | Speeding violation | Physical driving conditions | Inattention while driving | Rule violation | Experience in accident |
| Endogenous variables | ||||||||
| Attitude towards safety riding | 1.11*** | 0.62** | 1.184*** | -0.023 | ||||
| Behavior of safety driving gear, documents, and preparedness | -0.529*** | -0.687*** | -0.567*** | |||||
| Road conditions | -0.243** | -0.414** | -0.078 | 0.163 | ||||
| Speeding violation | -0.145 | |||||||
| Physical driving conditions | 0.283*** | 0.272** | 0.213*** | -0.009 | ||||
| Inattention while driving | -0.027 | |||||||
| Rule violation | 0.471*** | |||||||
| Exogenous variables | ||||||||
| Income | 0.041** | 0.037** | -0.007 | 0.045** | -0.029 | -0.018 | 0.009 | 0.025 |
| Travel distance | 0.078* | 0.044 | -0.076** | 0.041 | 0.069 | 0.025 | -0.01 | 0.088 |
| Engine capacity | -0.266*** | -0.004 | -0.02 | 0.012 | 0.154** | -0.05 | 0.012 | 0.01 |
| Year of motorcycle | 0.175*** | 0.058 | 0.003 | 0.026 | -0.032 | -0.043 | -0.092** | 0.01 |
Before interpreting the results of the SEM model, the model fitting indicators were evaluated. With the threshold of the RMSEA at 0.08 for a good fit, the models showing the values of 0.072 and 0.055 indicated that the models are a good fit. The root-mean-square (RMR) was also found to be lower than the threshold of 0.08, indicating a reasonable error. The values of χ2/df lower than 5 indicate an adequate fit of the model (1.736 and 1.78). As all the indices are a good or reasonable fit, it can be concluded that the model can perform reasonably well. The results of the SEM model are described in Table 5.
The model estimation for workers is described in the upper half of Table 5. The relationship in Table 5 is represented by a matrix between the first column variables (i.e., exogenous and endogenous variables) and the first row of the table (i.e., endogenous variables). The table shows the unstandardized coefficient in every variable, and as suggested by Hair et al. [44], only variables that are statistically significant will be interpreted as positive, and the interpretation of the models is based on a negative/positive relationship. As the exogenous variables in the models are in continuous and interval scale (the level is 5), the interpretation in the model can be made by evaluating the higher/lower number of the variables. The higher number of variables increases the influence of the positive/negative relationship on the coefficient.
It has been observed that high-income workers tend to have strong attitudes and behavior regarding safety gear, documents, and preparedness but have a lower appreciation for the city infrastructure. In terms of years of motorcycling, it has been observed that the newest motorcycle users tend to be associated with a high appreciation of the city road conditions. They also have assertive behavior on riding safety. Moreover, the stronger attitude towards riding safety influences their positive behavior regarding safety gear, documents, and preparedness. Moreover, traffic violations were found to be influenced by various factors. High adoption of riding safety is associated with the lower violation, although a strong attitude to riding safety is not found to reduce the violation level. High-quality infrastructure is associated with lower violations involving speeding, inattention while driving, and disregarding the law. By contrast, poorer physical conditions influence higher violations. The higher income group tends to have more speeding violations while, on the other hand, the newest motorcycle users tend not to drive when the physical conditions are poorer. Surprisingly, no violations were found to be influenced by the experience of accidents.
The lower half of Table 5 presents the detail of the estimation for students. High allowance students tend to have strong attitudes and positive behavior regarding safety gear, documents, and vehicle and riding preparedness. Students who use the newest motorcycles tend to show a strong attitude towards riding safety. In contrast, users of larger engine capacity motorcycles tend to have poorer attitudes towards riding safety. Students who have longer travel distances tend to have a lower appreciation of the road conditions quality. Similarly, for workers, a high adaptation to riding safety tends to positively decrease the violation level, while a strong attitude towards riding safety is not found to contribute to lowering the violation level, although it has a positive influence on behavior regarding safety gear, documents, and vehicle and riding preparedness. High-quality infrastructure is associated with lower speeding and inattention violations. In contrast, students who drive in poorer physical conditions tend to violate more. Moreover, rule violation tends to have a positive influence on a greater experience of accidents.
6. RESULTS AND DISCUSSION
This study aims to explore how the role of attitude towards riding safety, behavior regarding safety gear, documents, and preparedness, and road conditions influence the violation behavior. To further explore the violation behavior, personal and travel characteristics, driving conditions, and the experience of accidents were also included in the variables. This study used data of motorcycle users in Bandung City, Indonesia, to represent developing countries. In order to investigate the relationship, the CFA in SEM was performed, and three hypotheses were tested. The discussion of the findings is given below:
6.1. First Hypotheses
Motorcyclists’ violation behavior is represented by their attitude towards riding safety and their behavior regarding safety gear, documents, and vehicle and riding preparedness, and driving conditions.
This research found that behavior regarding safety gear, documents, and vehicle and riding preparedness is an important factor that can reduce the violation behavior. Interestingly, for students, a positive attitude towards riding safety does not straightforwardly influence the decline of a traffic violation, while on the other hand, a positive influence on behavior regarding safety gear, documents, and vehicle and riding preparedness is an important factor that can reduce the violation behavior. It appears that attitudes towards safety are not enough to minimize traffic violations, which might be related to the desire, thrill, and sensation of riding a motorcycle [23]. Previous studies [26, 27] have indicated that this sensation, thrill, and desire might overcome the attitude. As these feelings accumulate and dominate when driving, the influence of external factors such as other driver's behavior [47, 48] in terms of disregarding traffic law might occur.
6.2. Second Hypotheses
The road conditions (i.e., traffic, weather, and infrastructure) and driver conditions are related to the traffic violations and attitudes towards riding safety.
Generally, good quality infrastructure also has an effect on reducing speeding violations and inattention while driving for both workers and students, which is also indicated in past studies [8]. However, the effect of infrastructure quality on reducing rule violations (i.e., illegal U-turns, driving in the wrong lane, etc.) was found to be stronger for workers than students. The studies by Susilo et al. [1] and Sukor et al. [8] found that engineering aspects of the roads and additional safety features have a greater influence than vehicle conditions. A road with more safety features will lead to fewer violations. However, in line with this, the study by Sukor et al. [8] also underlines that the development of road conditions for motorcyclists that do not include exclusive lanes results in more speeding behavior.
Moreover, this study extends the findings of Susilo et al. [1] that vehicle conditions do not have that important influence on violations as road conditions, especially for workers. This study found that vehicle and riding preparedness, as a way of maintaining vehicle and driving conditions, reduces violations by students. Furthermore, interestingly, a higher income has a positive influence on speeding violations for both workers and students. Moreover, poor health and physical conditions were found to increase all types of traffic violations for both workers and students. These findings are consistent with previous studies [1, 23, 40, 49], which reported that fatigue or sleep influences to increase traffic violation, as well as traffic accidents. These negative driving conditions are found to be associated with excess driving hours or due to the participation of drivers in intense activities, which is also indicated by previous studies [39, 49].
6.3. Third Hypotheses
The effects of attitudes towards riding safety and behavior regarding safety gear, documents, and vehicle and riding preparedness on violation differ between workers and students.
Some factors were found to influence students and workers differently. The characteristics of the vehicle were found to influence student motorcyclists’ attitudes, while there was no significant effect on workers. Particular vehicle characteristics were found to influence a decline in the attitude towards riding safety, and this might trigger their violation behavior. The newest motorcycles were also associated with a better attitude towards riding safety for students and reduced rule violations, but no influence of this factor was found on workers. Earlier studies [1, 50] found that young motorcyclists have more unstable emotions and personality traits, are over-confident, and have a lower perception of the risks of aggressive behavior. In addition, considering this instability and inexperience, rule violation is found to be influenced by the experience of accidents for students but not for workers.
Behavior about preparing the vehicle conditions and driving gear, as well as the documents to be carried, had a greater influence on reducing violations by students than by workers. The reason might be related to a perception that the importance of those behaviors within the workers’ conditions is less important than their experience behind the wheel, which is greater than that of students. A study by Taubman-Ben-Ari and Lotan [24] found that with more driving experience, accidents significantly decreased. With more experience behind the wheel, some aspects of the preparedness of documents and driving gear are less significant in reducing workers’ violation behavior, especially speeding and inattention violations.
CONCLUSION
This study examines how the attitude towards driving safety factors, behavior regarding safety gear, documents, and vehicle and riding preparedness, and perceived road conditions quality influence the violation behavior. Using data from Bandung City, Indonesia, the results of this study also contribute to enriching the knowledge of traffic accidents in developing countries. For students, the behavior regarding safety gear, documents, and vehicle and riding preparedness plays an important role in reducing the violation behavior than the attitude itself. A positive attitude towards riding safety does not straightforwardly influence positive behavior regarding safe driving preparedness, and consequently, a decline in a traffic violation. Behavior about preparing the vehicle conditions and driving gear and the documents to be carried had a greater influence on reducing violations by students than by workers. The decline in traffic violations for both students and workers is associated with higher road conditions quality and good driving conditions. Based on these findings, this study derived three main policy implications for reducing traffic accidents in Bandung City.
Firstly, as the behavior regarding safety gear, documents, and vehicle and riding preparedness was found to significantly influence violations, monitoring, encouraging, and promoting riding safety are also important. As these factors are more viable for students, this could be achieved by intervention in educational institutions. Promoting safety riding in school or university is suggested. Secondly, due to the influence of the road conditions on traffic violations, improving the road safety infrastructure and features (i.e., road markings, signs, etc.) and traffic management is an important priority for the City Government agenda. Thirdly, considering the significant influence of physical driving conditions on traffic violations, this study recommends more socialization to promote healthy driving conditions to reduce traffic violations, and consequently, accidents. The use of other modes, such as public transport, when motorcyclists’ physical conditions and well-being are less than ideal, should also be promoted.
While this study provides more information on traffic violations in Indonesia, the limitations of the study must also be considered. This study used the aggregate data of a one-week period during and before the outbreak. Considering the individuals’ variability of travel and activities, future research that accommodates more disaggregated day-to-day travel data, including traffic violation, might enrich the discussion of research findings and investigate the habit of the traffic violation. Moreover, while this study investigates the role of infrastructure in violation behavior, the relationship of driving behavior to safety factors (e.g., infrastructure characteristics and quality) and physical and emotional factors are still missing. Further analysis to investigate the relationship between driving behavior and the safety factors, as well as physical and emotional factors, is important. Therefore, the behavior of the driver and attitudes can be compared to the one directly measured.
CONSENT FOR PUBLICATION
Not applicable.
AVAILABILITY OF DATA AND MATERIALS
The data used to support the findings of this study are available from the corresponding author [M.R] upon reasonable request.
FUNDING
This research was funded by the International Publication Research Grant of the Institut Teknologi Nasional Bandung under Contract No. 335/B.05/LP2M-Itenas/1/2020.
CONFLICT OF INTEREST
The authors declare no conflict of interest, financial or otherwise.
ACKNOWLEDGEMENTS
This authors acknowledge the funding support by the International Publication Research Grant of the Institut Teknologi Nasional Bandung. The authors also thank all the parties who have participated in the data collection.

