All published articles of this journal are available on ScienceDirect.

An Empirical Study to Estimate the Economic Effects of the Introduction of a Periodical Technical Inspection (PTI) for Motor Vehicles in Punjab (Pakistan)
Abstract
Aims:
In 2016, the government of Punjab (Pakistan) established a new system for inspecting road vehicles. The inspection system tests the roadworthiness, noise level, and emissions from the vehicles. These test metrics have further economic benefits that will be analyzed throughout the study. As the main aim of this study, we provide an economic impact analysis of the introduction of a periodical technical inspection (PTI) system that acts as a basis for political decision-making.
Background:
We used a cost-benefit analysis (CBA) to assess the economic impact of the introduction of a periodical technical inspection (PTI) in Punjab. With the CBA, the economic benefits and costs can be empirically weighed against each other to provide a precise result for policymakers. Such results could help in decision-making regarding new policies, such as whether to introduce a new system or not. This is especially important for the region of Punjab since it has a large population and a substantial number of cars which lead to many fatal car accidents. A primary reason for the numerous fatal accidents is the poor quality of the present vehicle stock. Punjab lacks a regulatory body that systematically ensures that all vehicles on the road are safe and of good quality. Therefore, an effective approach to reducing fatalities would be the introduction of a systematic inspection body that controls vehicle quality.
Objective:
The objective of this study is to assess the feasibility and effectiveness of introducing a PTI in the region of Punjab. To this end, we calculate a benefit-cost ratio and determine whether the PTI would have a positive economic impact on the region. Throughout the analysis, cutting-edge empirical methodologies are used to provide a structured approach for precise assessment of the benefit-cost ratio related to the introduction of a PTI system.
Methods:
To weigh in on the benefits and costs, we used a CBA analysis. This method is commonly used in welfare economics to find out if certain measures are socially desirable. The overall result of the CBA is a benefit-cost ratio (BCR). Ratios greater than one prove that the system implementation is profitable for society. Such an analysis provides an empirically supported result that can be used throughout the decision-making process in the public sector.
Results:
According to our analysis, the implementation of a PTI together with an emission test would yield a benefit-cost ratio of 12.45. A benefit-cost ratio of 10 means that one dollar invested in the PTI results in an economic benefit of 10 dollars in Punjab. The introduction of a PTI system would have a positive impact on the economic welfare of Punjab and is therefore socially desirable. The empirical results show a high degree of statistical significance (p = 0.001). Due to this, the coefficients of the cause-effect relationships can be interpreted unambiguously. Avoiding an estimated 198 fatalities would enable accident-related savings of US$ 11,616,462. Moreover, 382 fewer injured people would lessen the financial burden on the state by another US$ 1,568,874. The total estimated emission savings would amount up to $2,647,966.87. Altogether, the benefits arising from the implementation of PTI would equate to US$ 15,833,302,9.We calculate that the sum of all inspection fees (for a total of 179,977 vehicles inspected) is to be US$ 1,271,460. When leveraged against each other, the savings and fees lead to a benefit-cost ratio (BCR) of 12.45.
Conclusion:
The implementation of PTI would have a significant and measurable effect on the reduction of road accidents in Punjab. The list of potential benefits is not exhaustive, as other effects, like noise reduction, could not be considered due to missing data. Despite considering a limited list of benefits, we have demonstrated a high BCR which speaks in favour of the introduction of PTI and its favourable impact on Punjab’s economic welfare.
1. INTRODUCTION
In 2016, the government of Punjab (Pakistan) established a new system for inspecting road vehicles. The inspection system tests the roadworthiness, noise level, and emissions from the vehicles. These factors have a wide-spanning economic benefit.
The roadworthiness tests lead to safety benefits by reducing the number of road accidents. Even if accidents occur, they would likely be less severe due to factors such as brake improvement, maintenance of fully functional headlights, and a mandatory tire tread depth.
Testing and regulating noise levels with the aim to reduce them would bring about benefits that improve human health. Regulation of emissions, on the other hand, would have a beneficial impact on environmental pollution. Emissions from road vehicles account for 50% of the air pollution in Pakistan [1]. The World Health Organisation (WHO) ranks Pakistan as one of the countries with the highest level of air pollution [2]. The city of Lahore, for example, is ranked number 9 on the list of cities with the worst air quality in the world [1].
Typically, all these economic effects have to be considered within an economic impact analysis for the new Periodical Technical Inspection (PTI). Their inclusion is, however, limited by the lack of available data. The lack of data is the reason why this study focuses only on the impact on road safety. The estimation of the effects of PTI on road safety is possible because vehicle pool, accident, and inspection data for Punjab are readily available.
However, the available data does not allow for time-series analysis. The inspection regime was only introduced in 2016, which means that performing a regression analysis to derive a causal relation between PTI introduction and road accident development is impossible due to the short period of time. However, empirical models of causality between PTI and road accidents exist for Turkey and Costa Rica [3, 4]. The empirical findings of those models can be applied to the introduction of the PTI in Punjab. With this, it is possible to estimate the safety benefits which could be achieved by implementing a PTI system.
The objectives of the study thus are
- To estimate the potential road safety benefits of PTI,
- To calculate the vehicle inspection costs, and
- To check whether a benefit-cost ratio higher than one can be expected.
The “Report on Punjab road accidents and Traffic 201” published by the local police office offers invaluable information on transportation in Punjab [5]. The total road network in Punjab covers 72,037 km, of which national highways constitute only 3,269 kilometers. Even though this accounts for only 4.6% of the total road network in Punjab, 44% of the road accident fatalities occur on national highways, mainly due to speeding [5]. The combination of speeding and technical defects, such as malfunctioning of brakes, leads to an increase in the number and severity of accidents, resulting in greater damage. It is assumed that even if the technical inspection regime could not reduce the number of accidents, it would impact their severity because a car with a lower number of technical defects may only lead to a major injury and not a fatality.
2. LITERATURE REVIEW
The previous vehicle inspection program in Punjab province was overseen by the Government of Punjab (GoPb); however, it was minimally enforced and was performed manually. As a result, no easily accessible and accurate historical data exist that reliably reports on the impact of the former program [6].
This governmental system appeared ill-equipped and unable to reduce the number of technical issues, thereby resulting in higher emissions and accidents caused by technical defects. Currently, there is a lack of modern equipment for vehicle inspection and an insufficient number of inspection engineers to meet the increasing number of registered vehicles. Furthermore, there is no educational system in place which would train the inspection personnel. Having understood the importance of safe vehicles, the government of Punjab aimed to upgrade the vehicle inspection system by installing a modernized inspection and certification system for all types of vehicles in the province.
The new inspection program in Punjab is a Public/Private Partnership (PPP)1F1F2 between the Government of Punjab (GoPB) and Opus (global leader in vehicle inspection) known as VICS (Vehicle Inspection and Certification System).
The VICS is implemented in two phases:
Phase 1, which began in the summer of 2016, included two fixed, multi-lane Type A stations; both are in Lahore. Phase 2, initiated in the spring of 2018, consisted of an additional nine (9) Type-A stations, four (4) Type B stations, and 24 Type C stations. Below is a brief description of the station categories:
Type A: Fixed, multi-lane station capable of testing both Heavy Transport Vehicles (HTVs) and Light Transport Vehicles (LTVs)
Type B: Fixed, single-lane station which tests only LTVs
Type C: Single-lane “sheds,” used by a mobile inspection unit, which test both HTVs and LTVs
There are currently twelve operational stations – three (3) Type-A, one (1) Type B, and eight (8) Type C. Another 15-20 stations opened in 2019, while the remainder opened in 2020 [6].
All registered public service vehicles, regardless of the model issue and construction date, are required to be inspected (private vehicles may be added later). “New” vehicles (based on the model year and mileage) which pass inspection are granted a 2-year Fitness Certificate (FC); all other vehicles which pass inspection are granted a 6-month FC [6]. A summary of vehicle types inspected is given below.
Three-wheelers:
- Motorcycle taxi
- Auto rickshaws
- Motorcycle rickshaws (currently only in some districts)
Vehicles with four or more wheels:
- Motor cars, jeeps, and station wagons
- Trucks
- Pickups, delivery vans
- Taxis
- Minibuses, buses, etc.
The new program (“Agreement, Establishment of Vehicle Inspection and Certification System in Punjab”, Section 1.17, dated 03 February 2015) is enforced through a number of mechanisms, including:
- Current motor vehicle examiners are required to immediately cease issuing FC once a VICS station becomes operational within a district.
- Route permits are not to be issued without a valid VICS FC.
- The Transport Department (TD) is required to deny Token Taxes and to not allow initial registrations without the presentation of an official VICS FC.
- TD Personnel/Traffic Police/Wardens
Vehicle inspections consist of automated tests for items such as brakes, shocks/suspension, alignment, headlights, and excessive noise; emissions and opacity tests are performed on gasoline (petrol) and diesel-powered vehicles, respectively. A visual inspection is performed for both LTVs and HTVs on items such as seat belts, windshields, mirrors, lights, tire tread depth, etc., as well as an undercarriage inspection on steering, suspension, brake components, etc., to ensure they are present, connected, and functioning as required.
Type A and Type B stations consist of three position lanes; Type C stations have two position lanes. A brief description of activities performed at each position are below (Type A/B):
- Position 1: Chassis inspection system (sideslip, shock/suspension, brakes)
- Position 2: Joint tester (shaker plates), visual inspection, headlight test
- Position 3: Emissions/opacity test, noise meter
Position 2 and Position 3 activities are combined at Type C stations [6].
2.1. Introduction: Provincial Analysis of Traffic Accidents in Pakistan
According to the latest WHO data published in 2017, road traffic accident deaths in Pakistan reached 27,081 or 2.22% of total deaths (≈ 1.219.864 total deaths) [7, 8]. The age-adjusted death rate is 15.42 per 100,000 of the population, ranking Pakistan at number 104 in the world [9].
The data showed that an average of 35% of the total daily road crashes in Pakistan took place in Punjab [10]
A provincial analysis of traffic accidents in Pakistan from 2000 to 2010 shows that Punjab, in comparison to other provinces (Sindh, Khyber Pakhtunkhwa, Baluchistan, reference year: 2019), has the highest amount of fatal and non-fatal road accidents, except for the years 2014 and 2015 [11].
The situation of road traffic accidents in those provinces for the period from 2000 to 2015 is depicted in Fig. (1).
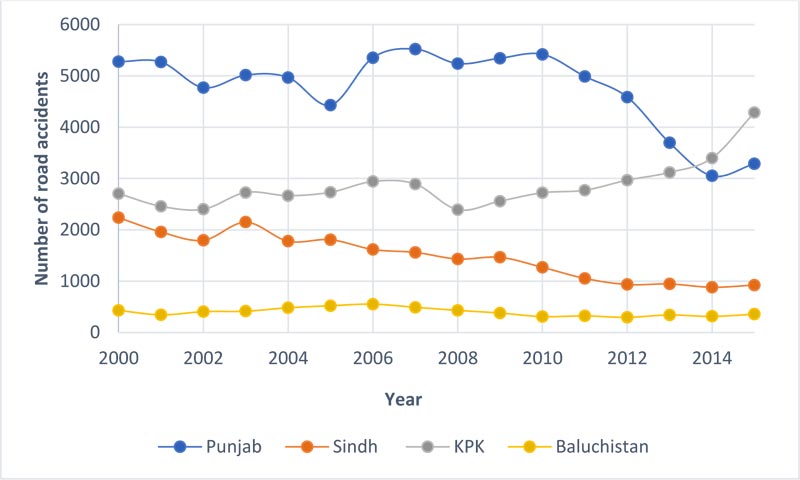
The rise in the number of traffic accidents warrants a closer investigation because the absolute number of accidents does not accurately reflect the various socio-economic preconditions in each province. However, the calculation of relative values is not possible because, for most variables, time-series data do not exist. It can be seen that road accidents in the provinces depend on the population size, the length of the road network, the number of vehicles, and the vehicle age. Population data are available for the years 1998 and 2017 (Table 1). Even if the results of the census are questioned [13], the population growth is above average.
| Province | Total Population | Percentage Growth | |
|
Census 1998 |
Census 2017 |
||
| Punjab | 73,621,290 | 110,012,442 | +49.4% |
| Sindh | 30,439,893 | 47,886,051 | +57.3% |
| KPK | 17,743,645 | 30,523,371 | +72.0% |
| Baluchistan | 6,565,885 | 12,344,408 | +88.0% |
The number of traffic accidents related to the number of inhabitants in the respective provinces is depicted in Table 2. In the first step, the mean of traffic accidents over the period from 2000 to 2015 is derived. In the second step, the mean values are divided by the number of inhabitants estimated by the census in 1998 and 2017 and ultimately multiplied by 100,000. Finally, the percent changes between the ratios are calculated. The data show that Punjab has the second-highest value with regard to the inhabitants. Furthermore, the increase in population size in different provinces is not correlated with an increase in traffic accidents. This effect, however, has to be brought into question. The censuses took place 19 years apart from each other, which in economic terms is a very long time.
| Province | Means of Traffic Accidents | Traffic Accidents per 100,000 inhabitants | ||
| Census 1998 | Census 2017 | Percentage Change | ||
| Punjab | 4,764 | 6.5 | 4.3 | -33.8% |
| Sindh | 1,489 | 4.9 | 3.1 | -36.7% |
| KPK | 2,859 | 16.1 | 9.4 | -41.6% |
| Baluchistan | 400 | 6.1 | 3.2 | -47.5% |
2.2. Previous Studies on the Impact of PTI on Road Accidents
The necessity of PTI for road vehicles is often questioned by the automotive industry and automobile clubs. The automotive industry favors on-board diagnostics (OBD) because OBD-guided vehicle maintenance binds the customer to the manufacturer’s car repair shop, ensuring an ongoing source of revenue. However, these services are not mutually exclusive, as the vehicle’s technical deficiencies need to be repaired irrespective of the outcome of the general inspection. In countries with a well-established PTI infrastructure, it is difficult to fully comprehend and acknowledge the benefits stemming from it, as the PTI-free scenario cannot be modelled.
The causality between PTI and road accidents was empirically investigated using data from Turkey [3] and Costa Rica [4]. The main difference between the two countries is that in Turkey, the implementation of PTI took place over a longer period of time and not on a single fixed date. Therefore, the empirical model developed for Turkey can be applied to Punjab’s case. In both instances, not all vehicles operating on the roads were inspected at once, which makes the data comparable. The Costa Rica model, on the other hand, could be used in the case where all road vehicles in Punjab are inspected periodically because an obligatory PTI is introduced for all vehicles on a fixed date.
In Turkey, PTI has been introduced recently, enabling a comparative analysis. Schulz and Scheler aimed to estimate the effects of the introduction of PTI in Turkey based on the number of accidents, fatalities, and injuries [3]. Comprehensive data on comparable pools of vehicles are available, starting from the introduction of the technical revisions in 2008 to the present day. Since the introduction of the technical revisions in 2008, a great amount of comprehensive data on comparable pools of vehicles have become available. Available data from both the revision authorities as well as official statistics were fed into a panel data model to establish the impact of the introduced changes. The results demonstrated that there is a measurable impact of periodical technical revisions on accident numbers and traffic safety.
Two different scenarios were modeled. The dependent variable in the first model is the number of accidents. This scenario can also be used for the PTI in Punjab. The second scenario used injured people as the dependent variable.
The dependent variable used in the first model is influenced by the following factors:
- Population
- Failed PTI
- Number of vehicles
- Length of motorways
- Length of provincial roads
When considering the number of vehicles that failed to meet the PTI criteria, an inverse relationship was assumed, such that the higher the number of detected vehicle errors, the fewer the accidents. This assumption was based on the premise that once detected, a large number of faults would be repaired, thereby improving the safety of the vehicle and preventing future accidents from happening.
The length of the motorways and provincial roads, on the other hand, has a direct proportional impact on the number of accidents. The higher the number of kilometers of motorways and provincial roads in the country, the higher the chance of an accident. This variable could not be analyzed for Punjab due to a lack of statistical data [3].
The population size has a slightly negative effect, suggesting that the more people in the country, the fewer accidents will occur. The rapid population growth in Turkey can negatively affect the outcome since this variable includes every age group in the country, not all of which contribute to traffic. This consideration might help explain the impact of this variable on the number of accidents. These findings correspond to the characteristics of Punjab regarding a rapid population growth (Table 2).
The number of vehicles, on the other hand, is a more meaningful and straightforward indicator of the number of accidents that could happen. The number of accidents is directly related to the number of vehicles on the road. All of the variables are significant, having a 1% significance level. The following table summarizes the findings.
The results show that a PTI failed due to detected technical faults would lead ceteris paribus to an estimated 0.7% fewer accidents (Table 3).
| Dependent Variable Accidents |
|
| Population | -0.002*** (0.0001) |
| Failed PTI | -0.007*** (0.001) |
| Number of vehicles | -0.008*** (0.0002) |
| Length of provincial roads | -0.954*** (0.253) |
| Length of Motorways | 9.600*** (0.750) |
| observations | 1,296 |
| R2 | 0.818 |
| Adjusted R2 | 0.805 |
| F Statistic | 1,085.044***(df=5;1210) |
3. MATERIALS AND METHODS
To weigh in on the benefits and costs, we used a cost-benefit analysis (CBA). This method is commonly used in welfare economics to find out if certain measures are socially desirable. The overall result of the CBA is a benefit-cost ratio (BCR). Ratios greater than one indicate that the benefit exceeds the costs and prove that the system implementation is profitable for society. Such an analysis provides an empirically supported result that can be used throughout the decision-making process in the public sector [14-17].
The general approach of a CBA covers the following steps [17]:
(1) Definition of cases (e.g., with or without PTI)
(2) Identification of relevant parameters (e.g., traffic, environment)
(3) Quantification of the physical effects
(4) Transformation of the effects into monetary values
(5) Calculation of the benefit-cost ratio
The study follows the proposed structure. Furthermore, step 3 requires empirical findings from other studies.
The software used for the analysis is the Statistical Package for Social Science (SPSS Version 24). The generation of graphics and tables was done using Microsoft Excel.
The data stem primarily from the datasets of the Pakistan Bureau of Statistics as well as police reports, which also collect various traffic data. Due to this, the data were considered to be reliable, and a statistically tenable evaluation of the data was made possible.
4. RESULTS & DISCUSSION
4.1. Cost-Benefit Analysis
4.1.1. Definition of Cases: The VICS in Punjab
The Cost-Benefit Analysis (CBA) requires a distinction between benefits and costs.
The term ‘benefits’ denotes resource savings achieved due to the introduction of a new measure, such as PTI. More specifically, the benefit equals the difference in costs without and with the measure. Within this CBA, the benefits are calculated by comparing the costs before and upon the introduction of VICS.
Unfortunately, dependable data related to traffic accidents and the vehicle stock covering the same time period when VICS was introduced were not available. Therefore, we have assumed that the number of rejected vehicles during the PTI has a similar impact (-0.7%) on the number of accidents as found in the Turkey study [3]. By introducing this assumption, we were able to estimate the number of avoided accidents and to calculate the fatalities and injuries.
4.1.2. Description of the Vehicle-Stock
Table 4 and Fig. (2) show the state of the vehicle stock for the period from 2007 to 2016. The total number of motor vehicles over this period increased by 235%. The number of motorcycles and scooters increased by 314%, taxis by 267%, auto-rickshaws by 261%. Motor cars, jeeps, and station wagon numbers rose by 102%. There is no available information on the age structure of the vehicle stock. Knowledge about the total numbers is crucial since an increase in vehicle stock leads to more congested traffic, which ultimately increases the likelihood of traffic accidents. This relationship has been observed in Turkey (Table 3), where a one-unit increase in the number of vehicles leads ceteris paribus to a 0.008 unit increase in accidents at a 1% level of significance [3].
4.1.3. Quantification of the Accident Effects
Data on accidents for Punjab were obtained from the Provincial Police Departments (Crime Branch) [11]. Variables include total accidents, fatal and non-fatal accidents, and numbers of killed and injured persons. There was no differentiation between severe and minor injuries. The total number of vehicles involved in accidents are mentioned in Table 5.
| Year | All Motor Vehicles | Motor Cars, Jeeps and Station Wagons | Motor Cycles & Scooters | Trucks | Delivery Vans | Buses | Taxis | Auto Rickshaws | Tractors | Other Vehicles |
| 2007 | 4,998,026 | 925,507 | 3,169,095 | 40,512 | 84,771 | 67,949 | 17,677 | 115,250 | 572,519 | 4,746 |
| 2008 | 5,697,935 | 1,026,071 | 3,711,923 | 43,010 | 91,932 | 69,991 | 17,811 | 140,630 | 591,484 | 5,083 |
| 2009 | 6,468,737 | 1,091,920 | 4,366,154 | 44,506 | 96,201 | 71,341 | 17,946 | 154,901 | 620,283 | 5,485 |
| 2010 | 7,483,860 | 1,156,353 | 5,253,715 | 46,545 | 102,681 | 72,103 | 18,217 | 175,921 | 652,284 | 6,041 |
| 2011 | 8,679,841 | 1,258,385 | 6,251,043 | 49,169 | 108,599 | 74,219 | 18,334 | 203,527 | 691,758 | 24,807 |
| 2012 | 9,893,373 | 1,279,445 | 7,309,223 | 51,542 | 175,550 | 76,147 | 37,163 | 229,596 | 709,351 | 25,356 |
| 2013 | 11,338,802 | 1,530,257 | 8,427,062 | 53,754 | 182,104 | 83,817 | 39,655 | 258,164 | 738,633 | 25,356 |
| 2014 | 13,485,482 | 1,588,905 | 10,389,810 | 57,051 | 192,321 | 88,573 | 39,859 | 319,215 | 784,147 | 25,601 |
| 2015 | 14,532,353 | 1,634,529 | 11,218,816 | 85,405 | 267,370 | 101,125 | 50,079 | 346,979 | 799,725 | 28,325 |
| 2016 | 16,742,882 | 1,867,363 | 13,144,241 | 61,394 | 238,346 | 94,629 | 64,917 | 415,764 | 829,618 | 26,610 |
| Vehicle accidents, injuries, and fatalities | ||||||
| Year | Number of accidents | Fatal | Non-fatal | Killed persons | Injured Persons | Vehicles involved |
| 2006 | 5,355 | 2,591 | 2,764 | 3,096 | 6,311 | 5,355 |
| 2007 | 5,522 | 2,721 | 2,801 | 3,293 | 6,163 | 5,522 |
| 2008 | 5,240 | 2,471 | 2,769 | 2,912 | 5,790 | 5,240 |
| 2009 | 5,344 | 2,590 | 2,754 | 3,083 | 5,856 | 5,344 |
| 2010 | 5,420 | 2,591 | 2,829 | 3,167 | 5,809 | 5,420 |
| 2011 | 4,990 | 2,361 | 2,629 | 2,888 | 5,071 | 4,990 |
| 2012 | 4,587 | 2,213 | 2,374 | 2,692 | 4,515 | 4,587 |
| 2013 | 3,696 | 1,717 | 1,979 | 2,145 | 3,941 | 3,696 |
| 2014 | 3,054 | 1,435 | 1,619 | 1,750 | 3,652 | 3,054 |
| 2015 | 3,288 | 1,576 | 1,712 | 2,053 | 4,550 | 3,288 |
| 2016 | 3,819 | 1,989 | 1,830 | 2,494 | 5,231 | 3,819 |
It is equivocal that the number of accidents is equal to the number of vehicles involved. Normally, the number of vehicles involved is expected to be slightly higher than the number of accidents because rear-end collisions always occur between vehicles. A factor of 1.03 was derived, which means that around 1.03 vehicles are involved per one accident [19]. The findings of Gulzar et al. are based on the data of the province Punjab.
Based on Table 5, the average empirical relation between injuries and accidents is 1.14 (Costa Rica: 0.399). The empirical relation between fatalities and accidents is 0.59 (Costa Rica: 0.005) [4]. The difference between these results can be due to a variety of factors, such as the quality of the roads, different driving behaviors, and culture-specific influences. A more in-depth analysis would be necessary to determine the exact reason for the differences in the respective ratios.
Table 6 sums the inspection results for the period from March 2017 to November 2018. The study conducted for Turkey included the independent variable “number of rejected vehicles at the initial inspection.” Therefore, the number of rejected vehicles at the initial inspection is relevant for the calculation of avoidable accidents by PTI. Using the empirical findings of the Turkey study [3], it can be assumed that 335 crashes could be avoided through the VICS in Punjab. This would translate into a reduction of 198 fatalities and 382 injuries due to the application of PTI.
| Vehicle Type | Result | Initial | 1st Retest | 2nd Retest | 3rd Retest | 4th Retest | Total Tests |
| Bus | Approved | 7,485 | 4,119 | 797 | 183 | 34 | 12,618 |
| Rejected | 5,301 | 1,070 | 244 | 52 | 4 | 6,671 | |
| Farm Truck | Approved | 10 | 3 | 0 | 0 | 0 | 13 |
| Rejected | 3 | 0 | 0 | 0 | 0 | 3 | |
| Panel Van | Approved | 6,623 | 4,052 | 887 | 287 | 51 | 11,900 |
| Rejected | 5,501 | 1,352 | 391 | 84 | 15 | 7,343 | |
| Passenger Car | Approved | 1,274 | 546 | 94 | 36 | 12 | 1,962 |
| Rejected | 749 | 172 | 68 | 23 | 5 | 1,017 | |
| Pickup Truck | Approved | 19,015 | 7,710 | 1,549 | 520 | 165 | 28,959 |
| Rejected | 10,758 | 2,575 | 879 | 275 | 68 | 14,555 | |
| Station Wagon | Approved | 15 | 9 | 2 | 2 | 0 | 28 |
| Rejected | 14 | 4 | 2 | 0 | 0 | 20 | |
| Three-Wheel Vehicle | Approved | 23,549 | 12,050 | 3,780 | 1,659 | 523 | 41,561 |
| Rejected | 19,179 | 6,950 | 2,946 | 1,030 | 244 | 30,349 | |
| Tow Truck | Approved | 44 | 10 | 0 | 0 | 0 | 54 |
| Rejected | 10 | 0 | 0 | 0 | 0 | 10 | |
| Truck | Approved | 9,120 | 4,764 | 902 | 209 | 28 | 15,023 |
| Rejected | 6,345 | 1,229 | 269 | 45 | 3 | 7,891 | |
| Total approved & rejected | 114,995 | 46,615 | 12,810 | 4,405 | 1,152 | 179,977 | |
4.1.4. Cost Unit Rates for Fatalities and Injured Persons
A national accounting system of the resource losses due to road accidents does not exist for Punjab. In Germany, the Federal Highway Research Institute determines the costs resulting from road traffic accidents annually [20]. Therefore, the recommendation for Punjab is to establish an economic road accident cost bill in order to calculate the economic loss related to road accidents. When classifying costs due to traffic accidents, Özen, Genç, and Kaya differentiate between direct and indirect costs [21]. The direct costs include funeral or medical costs, time loss, and diverse expenses [21]. Indirect are those costs related to losses of economic, productivity-related, and socio-economic characteristics [21].
This paper aims to establish the correct monetary values to evaluate welfare losses due to road accidents. This implies that cost unit rates for fatalities and injured people must be derived. Therefore, the monetary evaluation of accidents is of crucial importance. In order to calculate the savings due to accident avoidance, the economic theory must evaluate the costs incurred due to injuries and loss of human life.
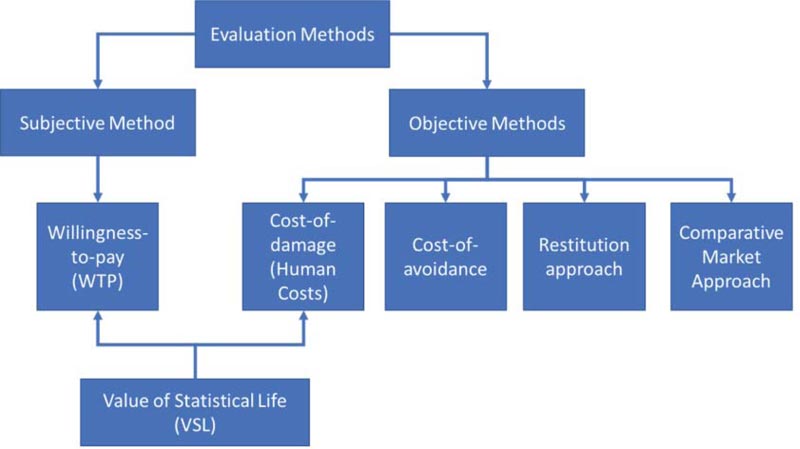
In order to define the traffic-related cost unit rates, different evaluation methods can be used. Fig. (2) shows which evaluation methods are in use. One can distinguish between subjective and objective methods. The subjective method relies on the rational decision of humans to pay money to avoid road accidents. The objective methods try to find empirical evidence that explains how road accidents affect the economic state of society.
The evaluation methods can be characterized as follows:
- The Willingness-To-Pay approach (WTP) is a subjective method that raises the question of how much the victim of an accident is willing to pay in order to avoid the accident or what compensation they would accept for the damage to occur.
- In line with the cost-of-damage approach, the damage caused by accidents is assessed; an essential criterion is the decline of the average gross domestic product because of the accident. The accident itself leads to repair costs or the need to buy a new car. Even though these expenses positively impact the GDP, they effectively lower the total budget of the consumers. Eventually, this leads to a consumption reduction in other segments and/or industries, resulting in economic welfare loss.
- The cost-avoidance approach determines the amount that must be paid so that an accident does not happen or so that the severity of the accident reduces (e.g., change from fatality to personal injury).
- The restitution approach accounts for the direct costs caused by road accidents (e.g., property damage, medical costs, administrative costs). Altogether, the restitution costs reflect the costs to restore road casualties.
- Within the comparative market analysis (also known as market data divergence analysis), the costs of the effects being evaluated are indirectly determined. Distinct types of damages cause different costs on other markets (e.g., real estate market); the difference is calculated as the equivalent value of the damage.
The value-of-statistical-life (VLS) can be calculated based both on subjective and objective methods [22]. McMahon & Dahdah found a strong correlation between the income level (GDP per capita) and human costs using data from 22 countries. The linear regression formula is as follows:
 |
HC = Human Cost, with m = 1 for VSL based on WTP, and m = 0 for VSL based on HC.
Table 7 presents the results for the estimation of human costs based on GDP per capita.
| Year | GDP per capita | Estimated human costs (HC) in US$ | Estimated WTP in US$ |
| in US$ | |||
| 2007 | 963 | 28,221 | 46,342 |
| 2008 | 1,038 | 30,705 | 50,422 |
| 2009 | 998 | 29,377 | 48,241 |
| 2010 | 1,031 | 30,472 | 50,040 |
| 2011 | 1,218 | 36,757 | 60,360 |
| 2012 | 1,254 | 37,982 | 62,371 |
| 2013 | 1,266 | 38,391 | 63,043 |
| 2014 | 1,312 | 39,963 | 65,626 |
| 2015 | 1,425 | 43,856 | 72,018 |
| 2016 | 1,441 | 44,410 | 72,928 |
| Average | 1,195 | 36,013 | 59,139 |
The average value of life calculated as human costs (HC) equals US$ 36,013, whereas the value of life based on the Willingness To Pay (WTP) averages US$ 59,139. The year 2016 is used as the base year for the calculation. According to the methods of McMahon and Dahdah (2008), the average HC- and WTP-values are equal to US$ 58,669. We have used this value for further analysis.
The projects UNITE (Chris Nash with contributions from partners, 2003) and HEATCO [23] suggest estimating the costs for severe and light injuries as 13 and 1 percent of the costs per fatality, respectively. Following this recommendation, the cost unit rates for severe injuries amount to US$ 7,627 and for slight injuries to US$ 587. Currently, there is no established empirical relationship between severe and slight injuries for Punjab. Therefore, we decided to use the average of these values, which are equal to US$ 4,107.
Table 8 shows the cost unit rates for fatalities and injuries according to the objective and subjective methods discussed earlier.
The accident savings due to an estimated 198 fewer fatalities add up to US$ 11,616,462. An estimated decrease of the number of injured persons by 382 cases would lead to savings of US$ 1,568,874. The total benefit amount is US$ 13,185,336.
4.1.5. Cost Unit Rates for Emissions
For a more accurate cost-benefit analysis, it is of central importance to also consider emission costs. In the study by Keogh et al., a detailed function for quantifying emissions from the fleet of motor vehicles was developed. Concerning this function, the authors also calculated a set of average emission factors derived using statistical analysis of a very large data set for different vehicle types. These factors are applicable when deriving emissions inventories for developed countries [24]. However, due to insufficient available data for our study, we had to resort to alternative calculation methods in order to determine the economic benefits due to the introduction of emission tests. We performed the calculations using a bottom-up approach. Our main question was what the monetary benefits would be if an emission test were to be performed during the regular technical inspection. We assumed that such a test would lead to improved emission values for the inspected vehicles [25, 26].
| Cost category | Objective method in US$ | Subjective method in US$ | Average values in US$ |
| Fatalities | 44,410 | 72,928 | 58,669 |
| Injuries | 3,109 | 5,105 | 4,107 |
To perform the benefit analysis, we relied on data from two studies. The Autofore study determined the economic benefits stemming from an emissions test for gasoline-powered vehicles. This study calculated that testing 27.6 million gasoline-powered vehicles would result in 21.6 million euros of economic benefits. When considering the average tested vehicle pool, the introduction of an emission test would lead to an economic benefit of 0.78 Euros per gasoline vehicle [27].
The second source of data is the TEDDI study, in which the calculated economic benefit amounts to 20 euros per vehicle if an emissions test is introduced [28-31]. These two values are from 2007 and 2010, respectively. To perform a cost-benefit analysis, we took the EUR-USD exchange rates from the respective years and adjusted them for the corresponding inflation in Pakistan. We then applied this value to the 114,000 tested vehicles. Based on a study conducted by the Bureau of Statistics in Pakistan, 52% of the vehicles are diesel-powered, and 48% are gasoline-powered [32]. We divided the 114,000 vehicles according to this ratio and then multiplied these numbers by the inflation-adjusted economic benefit-per-vehicle to obtain the total economic benefit [32]. The resulting $2.647 million were then added to the previously calculated accident savings (benefits) of $13.185 million, leading to a total benefit of 15.832 million USD (accident savings and emission savings).
Table 9.
| Diesel | Gasoline | |
| 2007 | ||
| Amount in € | $0.78 | |
| EUR-USD | $1.37 | |
| Amount in USD | $1.07 | |
| With Inflation correction (2016) | $2.49 | |
| 2010 | ||
| Amount in € | $20.00 | |
| EUR-USD | $1.33 | |
| Amount in USD | $26.54 | |
| With Inflation correction (2016) | $41.98 | |
| Total Initial Inspected Vehicles | 114995.00 | |
| Ratio | 52% | 48% |
| Nominal Value | 59797 | 55198 |
| Benefits in USD | $2,510,414.45 | $137,552.42 |
| Total Benefits in USD | $2,647,966.87 | |
| Main Vehicle Categories | VICS Prices for the First Inspection | VICS Prices for the Second Inspection |
| Heavy transport vehicles | PKR 1,080 | PKR 540 |
| Light transport vehicles | PKR 1,080 | PKR 540 |
| Delivery vans | PKR 720 | PKR 450 |
| Motor cars, taxi, rickshaw, | PKR 720 | PKR 450 |
| motorcycle rickshaws |
4.1.6. Costs for PTI and Benefit-Cost-Ratio
Table 10 shows the vehicle inspection fees in Punjab.
Market prices must be adjusted for transfer payments (for example, taxes, duties, subsidies) that do not affect the use of resources [25, 26]. Other profits and income taxes are irrelevant and should therefore not be considered [26]. Within the CBA, both the profit and taxes have to be subtracted from the market prices to be paid.
The sales tax rate for contractors in Punjab is 16% [29]. Reliable information on the corporate tax is not available. Furthermore, the market price has to be reduced by the amount of profit. It is assumed that after taxes, VICS has a profit rate of 10%.
The fee was further transformed into US dollars. For this, we used the exchange rate of 1 PKR = 0.0094 USD. This number reflects the average exchange rate for the year 2016. The current exchange rate is 0.0072 (January 4, 2018). The exchange rates show significant risk and high volatility. For this reason, a CBA in PKR would be useful. Because no information on the value of human life in the national currency is available, we performed the calculations in the US dollar. Altogether it is justifiable to use the fee for VICS as the cost unit rate without reducing the incorporated tax amount.
Tables 6 and 9 provide the information needed to calculate the total inspection costs for the period from March 1, 2017, to November 10, 2018. A total of 179,977 vehicles were inspected. The inspection fees amounted to US$ 1,271,460. The costs associated with an emissions test could not be included as a cost in a cost-benefit analysis. This stems from the fact that it is the vehicle owner’s responsibility to ensure and maintain the proper working condition of his vehicle and to perform repairs whenever technical faults are encountered. However, since very few people have the necessary knowledge to carry out such a technical analysis, this is a task that needs to be outsourced to a professional and paid for personally by the vehicle owner.
According to a benefit-maximizing perspective, owners will postpone and minimize the frequency and thoroughness of such technical checks according to their own risk tolerance and financial ability. Eventually, this would result in a vehicle pool with a growing number of technical faults due to a sub-optimal level of testing. Similarly, it can be assumed if the vehicle owners are assigned to perform the emissions test on their vehicles voluntarily, a similar market failure would arise.
This can and should be avoided by having the state set up and introduce a mandatory exhaust emission test. However, since the test costs are the responsibility of the vehicle owners, any cost associated with establishing and installing an emissions test system should not be included in the total costs, and subsequently, has not been included in this cost-benefit analysis [31]. The BCR is 12.45.
The following table serves as a summary to help visualize the main steps of the cost-benefit analysis. The individual explanations can be found above.
Table 11.
| Ratio injuries and accidents: 0.59 | Ratio fatalities and accidents: 1.14 |
| Avoided crash through VICS: 335 | |
| Multiplication by 0.59 = 198 | Multiplication by 1.14 = 382 |
| Human Cost (VSL): ln n (HC) = 2.519 + 1.125 * ln n (GDP/Capita) + 0.496 *m (1) | |
| HC 2016 (Fatalities): $44,410.00 | HC 2016 (Injuries): $3,109.00 |
| WTP 2016 (Fatalities): $72,928.00 | WTP 2016 (Injuries): $5,105.00 |
| Calculate the Average | |
| $58,669.00 | $4,107.00 |
| Multiplication by 198 | Multiplication by 382 |
| $11,616,462.00 | $1,568,874.00 |
| S = $13,185,336.00 | |
| + | |
| Emission saving: $2,647,966.00 | |
| = | |
| $15,833,302.00 | |
| ÷ | |
| Inspection Cost: $1,271,460.00 (2) | |
| = | |
| Benefit-Cost Ratio = 12.45 | |
| (1): Formula of McMahon & Dahdah | |
| (2): See Table | |
5. DISCUSSION
The introduction of PTI systems has considerable economic benefits for society. The benefits in Punjab outweigh the costs by a factor of 12.45. According to the cost-benefit analysis theory, projects must have a BCR of at least 3 to justify the introduction of a new system [14].
In the case of Punjab, the introduction of a regulated PTI system has a significant benefit. As already stated in the analysis, about 335 accidents can be avoided by a regulated introduction of a PTI system, 198 of which would be fatal. The economic loss of 198 fatal accidents amounts to 11.6 million USD, which is a considerable amount for a region like Punjab, whose economic power fades in comparison to that of a developed country. A PTI system would also help prevent costs associated with serious or minor injuries. Consequently, the economic damage associated with road accidents is incredibly significant. It has been shown in other countries that the introduction of PTI has a significant positive impact on the number of traffic accidents. Therefore, from a macroeconomic perspective, it is advisable for Punjab to introduce a regulated PTI system. The standards set would significantly increase the average quality of vehicles on the road. This would lead to a general improvement of traffic safety and a reduction in traffic accidents.
Road safety is one of the key points pursued in the framework of the Sustainable Development Goals of the United Nations [30]. According to Goal 3, which focuses on good health and well-being, the number of global deaths and injuries from road traffic accidents should be halved by 2020 [30]. Road traffic accidents continue to be one of the most frequent causes of death in our society. Improving road safety is, therefore, particularly important from a humanitarian perspective. However, it is necessary to look at these aspects from a scientific perspective as well to generate the necessary attention.
A full CBA could not be performed because other effects like noise reductions were not calculated. Moreover, the reduction of accidents with property damages by VICS was not calculated because of missing data. Therefore, the current analysis underestimates the actual benefits of VICS.
A standardized national accounting for the economic costs of road accidents does not exist in Punjab. Due to this, we had to derive national cost unit rates based only on GDP data. It is recommended to establish an economic assessment framework which can be used to assess all kinds of transport measures. This would ease the comparison of different measures and allocate the public budget to the most effective means.
Other costs related to accidents (e.g., administrative costs, congestion costs) were not measured due to a lack of detailed information.
It would also be interesting to look at how the numbers will develop over the next 5 years. A closer look at the vehicle stock shows that the average annual growth rate is approximately 14.41% [18]. If a constant ratio between the number of “initial inspections” per registered vehicle is assumed, the economic benefits should also increase by 14.41% annually, assuming that the value of statistical life remains constant. However, this cannot be assumed because GDP/per capita in Pakistan is increasing disproportionately, so the human cost and willingness-to-pay should also increase rapidly. This would result in much higher economic benefits, which would then be reflected in a higher benefit-cost ratio. This is a general forecast for the coming years [18].
CONCLUSION
In summary, we found that the implementation of PTI would have a significant and measurable effect on the reduction of road accidents in Punjab. Results from a comparative study done in Turkey were used, as the situation in Turkey is similar to that in Punjab. It would be useful to collect more data and monitor the process on an annual basis to get a deeper insight into the correlation between VICS and road safety.
However, the number of potential benefits is underestimated because other effects like noise level could not be considered due to missing data.
Furthermore, the empirical relations (killed persons per accident and injured persons per accident) used in this study are based on mean values for the period from 2006 to 2016. The ratio of killed people per accident is 0.65 in 2016, which is 10% higher than the value used in our calculations. The ratio of injured people per accident for 2016 is 1.37, which is 20% higher than the value we used. These results show that a deeper accident analysis is needed because a decrease in the accident rate is not correlated with a reduction in fatalities and injuries. The effect was found to be the opposite – the consequences of accidents worsened significantly. The severity of an accident is influenced by three main factors: the technical fitness of the vehicle, the driving behavior, and the condition of the road (e.g., pavement, traffic signs). Therefore, it would be advisable to consider these additional variables in any subsequent analyses. This would enable us to make strategic decisions regarding changes that would have the highest impact on the numbers and consequences of road accidents in Punjab.
NOTES
1 Chair of Mobility, Trade & Logistics,Zeppelin University, Am Seemooser Horn 20, 88045 Friedrichshafen, Germany
2 A Public/Private Partnership is defined as a formal or informal relationship between different institutions using public and/or private resources (financial, knowledge, infrastructure) to achieve a specific goal [7].
LIST OF ABBREVIATION
| ACC | = Accidents |
| BAST | = Bundesanstalt für Straßenwesen (Federal Highway Administration) in |
| Germany | |
| BCR | = Benefit-Cost Ratio |
| CBA | = Cost-Benefit Analysis |
| FC | = Fitness Certificates |
| GDP | = Gross Domestic Product |
| GoPB | = Government of Punjab |
| HC | = Human Costs |
| HTV | = Heavy transport vehicles |
| KPK | = Khyber Pakhtunkhwa |
| LTV | = Light transport vehicles |
| M | = Million |
| PKR | = Pakistani Rupee |
| PPP | = Public-Private Partnership |
| PTI | = Periodical Technical Inspection |
| TD | = Transport Department |
| VICS | = Vehicle Inspection and Certification System |
| VSL | = Value of Statistical Life |
| WHO | = World Health Organization |
| WTP | = Willingness-to-pay |
CONSENT FOR PUBLICATION
Not applicable.
AVAILABILITY OF DATA AND MATERIALS
The authors confirm that the data supporting the findings of this research are available within the article.
FUNDING
None.
CONFLICT OF INTEREST
The author declares no conflict of interest, financial or other.
ACKNOWLEDGEMENTS
The authors would like to thank the Institute for Economic Research & Consulting GmbH for this work.

