All published articles of this journal are available on ScienceDirect.

Funding the High-Speed Rail: A Case Study of the California Project
Abstract
Introduction:
High-speed rail (HSR) projects are considered high-stake investments– both in construction, operation, and maintenance. Thus, HSR requires financing from various sources - public, private or a mix of both, as the case maybe. Traditional funding for HSR has usually been the public funds through various bonds and taxes. However, public funds are not easy to come by and are usually subjected to strict audits and reviews. Therefore, alternative funding sources are always sought after, especially those that are sustainable.
Methods:
A multiobjective optimization problem is proposed in this paper encompassing revenue generation, accessibility maximization and workforce-centric access measure (WAM) consideration for financing HSR development costs and justifying its purpose. The procedure identifies key HSR stations that could be developed and improved to positively increase revenue collected through taxes on surrounding properties that appreciated due to the HSR, or the appreciation that either occurred through accessibility increase or WAM considerations from the HSR.
Results and Discussion:
Such key stations that score high in one or more of these considerations could be considered for further development by policymakers and planners. Based on the multiobjective optimization problem proposed in this paper, and with the California HSR as an example, the three proposed stations of San Francisco Transbay Terminal, University City and Downtown Merced are recommended to be developed and improved to attract economic growth with the HSR line.
Conclusion:
The findings could help authorities focus on these stations (and similar others) for a sustainable means of at least partially funding California’s HSR project.
1. INTRODUCTION
Despite the benefits being realized from high-speed rail (HSR) in terms of connecting people and influencing economic activity [1], its development in the United States is still currently ‘a work-in-progress’ and lies at varying stages, and somewhat slow and uncertain.There are examples of the HSR, such as in Texas, that is still in the proposal stages and is aimed to connect Dallas and Houston, while the California HSR program, which had temporary funding issues, has been ongoing and, once completed, will connect various urban and rural cities [2]. Various motivations are behind the idea of pursuing HSR developments in the United States, and the primary purpose is to connect the regions that need mobility as well as those that need economic [3]. Nevertheless, the road to a complete HSR line in the country has been an uphill one with hurdles that primarily have risen due to reasons including funding crunch, land acquisition issues, environmental clearances, and planning. Out of all of these challenges, funding shortage for HSR construction has been the primary and critical factor that has held smooth progress. The basis of funding HSR projects lies in an effective investment from public agencies in the United States; however, these projects turn out to be large-scale infrastructure improvement endeavors encompassing various counties, possibly states of the country. Thus, various local, regional, and national interests become important' when such projects are undertaken. With all of this, it makes sense to involve private players to contribute to offset the initial construction costs [4].
When it comes to using solely public funds, there are several barriers that need to be overcome, including those that are political in nature. Politically motivated investments in large-scale projects are quite common but are also primarily derived from public taxes and, more importantly, dependent on the funding agencies' financial health. These have been the reasons for California’s HSR, which will connect almost every populated city of the state [5]. Therefore, alternative means of funding HSR projects with the right goal and motivation are always a common pursuit by policymakers, investors, and researchers.
There are key benefits of the HSR, and one of these includes fast connectivity to remote locations, especially for congested cities with vehicular volumes. HSR also promotes safe transportation of people, and if integrated with other modes, it enhances the intermodal transportation network system. These benefits are highly beneficial for businesses that thrive around the HSR stations [6]. In general, it has been shown that infrastructure and operational improvements in rail transportation lead to an increase in property values around the stations and also encourage businesses and industries to set-up their locations close to the improved stations [7, 8]. However, there is limited knowledge in research on how to determine such stations that can be improved to attract businesses and generate investments to further support HSR construction and maintenance.
In states like Texas, alternative financing schemes for funding infrastructure projects have been probed, and these are popularly known as the Transportation Reinvestment Zone (TRZ) – which is an alternative means of generating revenue for public agencies and somewhat resembles the concept of value capture [8]. TRZ has been hailed as an innovative method that can be deployed by local public agencies to pay off capital loans.
Economic growth has been studied for improvements resulting from rail station developments and often from the perspective of transit-oriented development [9-11]. Various approaches that have been adopted also consider accessibility as a potential economic indicator to support transportation-related improvements and construction in a region [3, 12].
Similarly, the economic aspect of HSR introduction has also been justified by associating the resulting transport development with the new HSR in a region with surrounding property values in the vicinity of the HSR. For example, it is understood that HSR can impact property and land values in a region variably [13]. In an earlier study, both Cervero and Duncan [14] realized benefits and premiums for large apartments around rail stations. These benefits to apartments were for those that were contained within a threshold distance of a quarter mile to the stations. However, when it came to specifically housing prices, noticeable impacts were noted for those within a mile distance from the rail stations of the Shanghai South Railway Station in China [15].
Global examples from other rail transit studies of the Netherlands, South Korea, and Germany show similar findings of a positive correlation between residential housing prices and rail transit [16-18]. A very early study by Diaz [19] showed that investments that result in a new transit increase property value because of increase in accessibility to locations.
In accessibility studies, Kilpatrick et al [20] examined two kinds of scenarios for transit corridors. In one scenario, both the pros and cons of accessibility were accounted for, and the second scenario was studied without considering the access benefits. The findings showed that only being near to a transit corridor, presumably with high accessibility, was not sufficient to bring about positive impacts on the property values. On the contrary, being close to the corridor yet without a direct access can cause housing values to decrease. With a focus on the Beijing-Shanghai HSR line, Chen and Haynes [21] showed a negligible impact on the housing values for the large cities, while there was a significant increase in the values for the medium and small cities. Findings like this were noted in the study by Edwards [22] for the towns in Australia with the proposed HSR. Results showed agglomeration benefits to cities with HSR stations.
A study on the variety of other factors that are considered important in facilitating the HSR’s impact include circumstances and context of city development plans, regional accessibility, etc. These factors have been noted for the HSR of Taiwan and those in the Chinese cities of Shanghai and Minhang [23, 24]. Keeping these aspects of the HSR in mind, the HSR clearly has to be affordable by virtue of being accessible [25].
2. METHODOLOGY
Multiobjective optimization is a standard procedure to identify optimal solutions to problems. This research presents a multiobjective optimization problem and a solution in identifying one or more HSR stations that can be further developed to potentially offset costs involved in HSR project costs. The optimization problem analyzes the possibility of property value increase, changes in accessibility and workforce-centric access measure that can motivate and attract businesses surrounding the HSR stations. To the best of our knowledge, this is the first-ever study of HSR that evaluates each station of a HSR line by looking at various aspects of HSR justification that involves the workforce across age, earnings, industry distributions, race, ethnicity, educational attainment, and sex.
The basis of developing the multiobjective optimization problem is that while a station might have the largest revenue potential increase from the surrounding property values, the same station could experience the lowest accessibility increase or the highest workforce-centric access measure (WAM) value. To understand how these three objectives interplay, the multiobjective optimization problem can be successfully deployed [26].
2.1. Revenue Potential Formulation
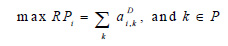
The revenue, RPi, generated can be written as,
 |
(1) |
where,
ai,kD = property tax collected from a parcel k that is within a (threshold) distance D from station i and P is the total number of parcels.
2.2. Percentage change in accessibility
The formula for accessibility adopted in this research is based on the potential accessibility derived by Chandra and Mazin [27]. The potential accessibility (PAi) of an HSR station i is expressed as:
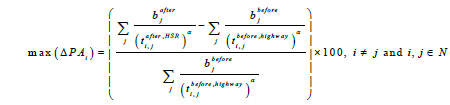
Therefore, the second objective function of maximizing the potential accessibility of station i,
 |
(2) |
where,
bjafter = employment surrounding an HSR station j ‘after’ HSR is operational
bjbefore = employment surrounding an HSR station j ‘before’ HSR is operational
ti,jafter, HSR = travel time from station i to station j with HSR operational
ti,jbefore, highway = travel time from a city with station i to a city with station j using a highway
2.3. Workforce-centric Access Measure
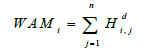
The Workforce-centric Access Measure (WAM) provides an estimate of the HSR’s ability to address mobility needs across the working class near its stations. Various variables can be WAM-related and could include age, earnings, industry distributions, race, ethnicity, educational attainment, and sex. The WAMi for a station i can be formalized as,
 |
(3) |
where,
Hdi,j= total workforce belonging to a class or category type j working within a threshold distance d around a station i. Typically, this threshold distance can be assumed to be walking distance around the HSR station i. The various categories that can be considered in the WAM could include age, earnings, industry distributions, race, ethnicity, educational attainment, and sex. These variables are considered important for US economic studies – particularly for businesses and industries [28].
2.4. Multi-objective Optimization Design
There are several established methods for determining a non-dominating solution for multi-objective optimization problem. The steps leading to each of the methods differ, thereby leading to differences in the nondominated solution. Wang and Rangaih [29] develop a summary of the popular methods, and we select the Technique for Order of Preference by Similarity to Ideal Solution (TOPSIS) for our purpose [30]. The steps involved in the TOPSIS algorithm are as follows:
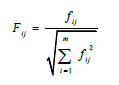
Step 1: A normalized objective matrix with m rows (each row standing for a value of an objective function) and n columns (each column stands for an objective function) is constructed. The matrix consists of objective function values.
 |
(4) |
where,
fij stands for the ith value of the objective function j,
Fij is the normalized objective function
m is the number of objective function values, and n is the number of objective functions
Step 2: The normalized function Fij is weighted using wj and defined using vij as,
Step 3: Define ideal solutions (positive, A+ and negative, A-) as follows:
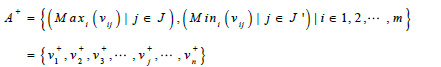 |
And
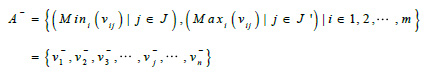 |
With J defined as a set of objectives that need to be maximized, and J’ as objectives that need to be minimized for {1, 2, 3, …, n}.
Step 4: Compute the distance (Euclidean) between each solution vij and the ideal solution (both for the positive and negative) as follows:
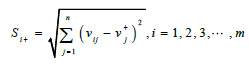 |
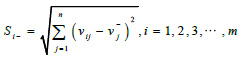 |
Step 5: Calculate the closeness Ci as:
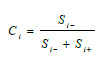 |
The optimal solution is determined by the largest Ci calculated above.
3. APPLICATION EXAMPLE
While some uncertainties prevail in funding the California HSR from the federal agencies [31], the situation can be considered ideal for demonstration of the methodology proposed in this paper – simply because there is a need for the HSR authorities to justify the purpose of the overall project and to procure alternative means of funding. Any lag in project funding for California’s HSR would continue to lead to the increased price of material, labor costs/availability and fast drying of funds. Thus, while innovative means of revenue generation should be found, there is also a societal need to serve as much workforce as possible for the State’s economic growth by access to the HSR. The three proposed objectives in this research can help identify key stations that can trigger economic activity surrounding them that may include increase in property values, employment opportunities and connectivity.
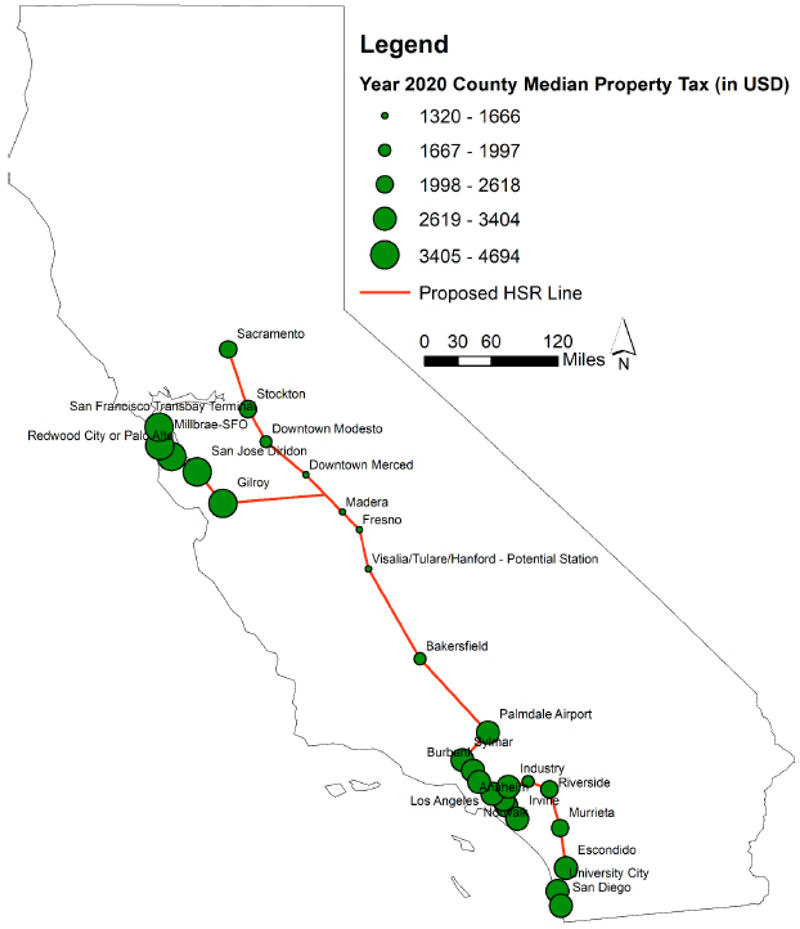
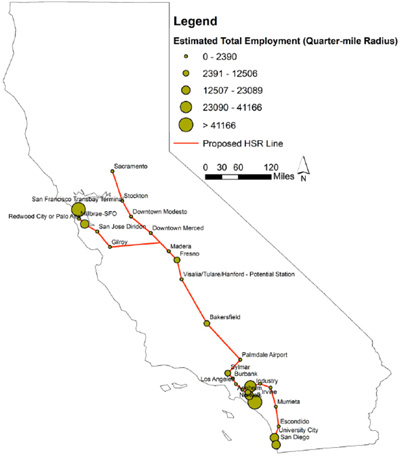
The data for the county median property tax has been used to evaluate the revenue potential (data source: Tax-rates.org [32]). In addition, only those properties from parcels are included that are within a quarter-mile distance of a station. Adopting this threshold distance has been recommended by Cervero and Duncan [14]. The spatial data for the parcels were obtained from the 2014 California Parcels Dataset from Los Angeles County GIS webpage [33]. The map in Fig. (1) shows the spatial location of the stations for the California HSR line, along with the spatial distribution of the county median property taxes for properties surrounding each station. The map in Fig. (2) shows the total employment distribution surrounding the stations for a quarter-mile distance. The data were originally available from the Longitudinal Employer-Household Dynamics [28] and extrapolated for 2020 to the anticipated HSR completion by 2022. Both the maps in Figs. (1 and 2) have been adopted from Chandra et al [26].
The data needed for WAM calculations are also obtained from the LEHD and extrapolated for 2020. The variables and their definitions used in the calculation are summarized in Table 1. The variables are widely used for economic measures that underlie the significance of the workforce for California’s businesses and industries and are presented as the North American Industry Classification System (NAICS) for the industry type.
For the calculation of accessibility, the impedance used has been derived from the travel time skim matrix that was constructed for the mutual distance between stations and the proposed speed of 200 miles per hour for the HSR [34]. The spatial maps for the HSR line in Figs. (1 and 2) show a total of 28 proposed stations in cities that were obtained from the California High-Speed Rail Authority [35].
| Workforce Classification by | Variable |
|---|---|
| Age | Number of jobs of workers age 29 or younger |
| Number of jobs for workers age 30 to 54 | |
| Number of jobs for workers age 55 or older | |
| Income | Number of jobs with earnings $1250/month or less |
| Number of jobs with earnings $1251/month to $3333/month | |
| Number of jobs with earnings greater than $3333/month | |
| Industry-type | Number of jobs in NAICS sector 11 (Agriculture, Forestry, Fishing and Hunting) |
| Number of jobs in NAICS sector 21 (Mining, Quarrying, and Oil and Gas Extraction) | |
| Number of jobs in NAICS sector 22 (Utilities) | |
| Number of jobs in NAICS sector 23 (Construction) | |
| Number of jobs in NAICS sector 31-33 (Manufacturing) | |
| Number of jobs in NAICS sector 42 (Wholesale Trade) | |
| Number of jobs in NAICS sector 44-45 (Retail Trade) | |
| Number of jobs in NAICS sector 48-49 (Transportation and Warehousing) | |
| Number of jobs in NAICS sector 51 (Information) | |
| Number of jobs in NAICS sector 52 (Finance and Insurance) | |
| Number of jobs in NAICS sector 53 (Real Estate and Rental and Leasing) | |
| Number of jobs in NAICS sector 54 (Professional, Scientific, and Technical Services) | |
| Number of jobs in NAICS sector 55 (Management of Companies and Enterprises) | |
| Number of jobs in NAICS sector 56 (Administrative and Support and Waste Management and Remediation Services) | |
| Number of jobs in NAICS sector 61 (Educational Services) | |
| Number of jobs in NAICS sector 62 (Health Care and Social Assistance) | |
| Number of jobs in NAICS sector 71 (Arts, Entertainment, and Recreation) | |
| Number of jobs in NAICS sector 72 (Accommodation and Food Services) | |
| Number of jobs in NAICS sector 81 (Other Services [except Public Administration]) | |
| Number of jobs in NAICS sector 92 (Public Administration) | |
| Race | Number of jobs of workers, Race: White Alone |
| Number of jobs of workers, Race: Black or African American Alone | |
| Number of jobs of workers, Race: American Indian or Alaska Native Alone | |
| Number of jobs of workers, Race: Asian Alone | |
| Number of jobs of workers, Race: Native Hawaiian or Other Pacific Islander Alone | |
| Number of jobs of workers, Race: Two or More Race Groups | |
| Ethnicity | Number of jobs of workers, Ethnicity: Not Hispanic or Latino |
| Number of jobs of workers, Ethnicity: Hispanic or Latino | |
| Educational Attainment | Number of jobs of workers, Educational Attainment: Less than high school |
| Number of jobs of workers, Educational Attainment: High school or equivalent, no college | |
| Number of jobs of workers, Educational Attainment: Some college or Associate degree | |
| Number of jobs of workers, Educational Attainment: Bachelor's degree or advanced degree | |
| Sex | Number of jobs of workers, Sex: Male |
| Number of jobs of workers, Sex: Female |
4. RESULTS AND DISCUSSION
The TOPSIS algorithm presented earlier was applied to determine the key California HSR stations for the three objectives. For the analysis that was carried out with the objective of maximizing revenue potential, the San Diego and San Francisco Transbay Terminal stations should be considered important for focus and development by the policymakers and planners. These two stations have the largest potential for generating revenue from the property tax collected from their surrounding parcels. The two HSR stations of Millbrae SFO and San Jose Diridon and Millbrae SFO are the next two stations that could also yield a high revenue if developed and improved.
With the objective of maximizing accessibility, the HSR stations of Millbrae-SFO, Fullerton, Norwalk, and Anaheim score high in percentage change in potential accessibility and thus, are the key HSR stations that need to be improved or developed. These four stations have a high employment concentration surrounding them.
With the WAM, the stations of Sacramento, San Jose Diridon, San Francisco Transbay Terminal, San Diego, and Redwood City/Palo Alto were found as key stations for development and improvement across age, income, industry, race, ethnicity, educational attainment, and sex classifications, respectively.
Considering all the three objectives together, weighted equally, the three key stations of San Francisco Transbay Terminal, University City and Downtown Merced are recommended for development and improvement to attract economic growth with HSR in California. Therefore, these three stations are found to be optimal considering revenue generation potential, maximizing accessibility, and increasing workforce-centric access measure. The findings have been presented in Table 2.
| Workforce Classification | Key Station for Improvement |
|---|---|
| Age | Sacramento |
| Income | San Jose Diridon |
| Industry | San Francisco Transbay Terminal |
| Race | San Diego |
| Ethnicity | Redwood City/Palo Alto |
| Educational Attainment | Redwood City/Palo Alto |
| Sex | Redwood City/Palo Alto |
CONCLUSION
The HSR is one of the fast modes for transportation mobility. HSR is known to connect regions that are spatially separated, yet with all of these advantages, construction, operation and maintenance of HSR require sustainable funding sources. Funding is, however, a challenge as public agencies, who are usually the primary stakeholders responsible for HSR projects, seek public support in the form of taxes. There is a need to better understand avenues and leverage them to justify the purpose of HSR construction in providing an important mobility option. This research explores three such objectives in the form of revenue generation, accessibility maximization and workforce-centric access measure to support HSR projects. This paper specifically explores the option of developing and improving key HSR stations that are promising in satisfying the three objectives. The key stations would show indications of high economic activity, which can be leveraged to fund or offset costs incurred in HSR construction, operation and maintenance. With the multiobjective optimization methodology undertaken in this research, an established algorithm called the TOPSIS is applied to identify the key stations. In this current research, multiobjective optimization helps identify critical stations for further development and improvement. This is undoubtedly a concern that investment in underserved communities could be less. However, our goal in this paper was mainly to focus on actions that could generate much-needed revenue for the HSR authorities.
The findings of this research suggest that the with the objective of maximizing just the revenue potential, the San Diego and San Francisco Transbay Terminal stations should be considered important for focus and development. When maximizing accessibility for the second objective, the HSR stations of Millbrae-SFO, Fullerton, Norwalk, and Anaheim score high in percentage change in potential accessibility and are the key HSR stations that need to be improved or developed. With a focus on a workforce-centric access measure (WAM), the stations of Sacramento, San Jose Diridon, San Francisco Transbay Terminal, San Diego, and Redwood City/Palo Alto were found as key stations for development and improvement across age, income, industry, race, ethnicity, educational attainment, and sex classifications.
Considering all the three objectives together, and weighing each equally, the stations of San Francisco Transbay Terminal, University City and Downtown Merced are recommended for development and improvement to attract economic growth with HSR in California.
The findings in this research suggest that developing and improving stations with various objectives could serve as economic incentives for businesses to thrive and grow near select California HSR stations. The increase in economic activities surrounding these stations could mean alternative sources of funds that are sustainable through property taxes and businesses, which can be utilized to fund and support HSR projects.
It must be noted that our current research is not focused on addressing the inequality that the CA HSR line might bring, and this is our research limitation but certainly forms the goal of our future research. We also believe there could be other methods of revenue generation, such as bonds, other than taxation [8]. However, taxation is a primary source of funding infrastructure projects when property values near the HSR station increase and thus, appear justifiable in investment near high-yield property appreciations near specific HSR stations from an institutional point-of-view. Thus, the methodology proposed in this paper can serve as a very valuable reference for financing HSR projects for transport connectivity by public and/or private agencies elsewhere in other regions of the United States.
LIST OF ABBREVIATIONS
| WAM | = Workforcecentric Access Measure |
| HSR | = High-Speed Rail |
CONSENT FOR PUBLICATION
Not applicable.
AVAILABILITY OF DATA AND MATERIALS
Not applicable.
FUNDING
This research was partially funded by the SB-1 TRANSPORT.
CONFLICT OF INTEREST
Shailesh Chandra is Editorial Advisory Board of The Open Transportation Journal.
ACKNOWLEDGEMENTS
Declared none.

