All published articles of this journal are available on ScienceDirect.
Method of Effective Implementation of Intelligent Hardware Complexes in the Management of Passenger Transportation Processes within Urban Agglomerations
Abstract
Background:
The road transportation sector faces rising task complexity, driving the development of localized telematic traffic control systems. Integrating cutting-edge technologies is essential, surpassing administrative measures. A methodological approach is imperative for successful implementation.
Objective:
This study aimed to improve the efficiency of the implementation of intelligent information and communication technologies in the passenger transport system of urban agglomerations on the basis of objective assessment and rational choice of hardware complex in the field of vehicle traffic management.
Methods:
For the evaluation and effective implementation of intelligent hardware complexes in passenger transportation, diverse techniques, including mathematics and computer modelling, expert evaluations, theory of algorithms, computational experiment, mathematical statistics, observation, and measurement, were employed.
Results:
The approach of effective implementation of hardware complexes in passenger transportation management is proposed, and the order of calculation of passenger transport motion interval is developed. The calculations of economic and technical feasibility showed an increase of efficiency by 20-40% and a return on investment by 47%.
Conclusion:
The developed methodological approach for the effective implementation of intelligent hardware complexes in passenger transportation process control can serve as methodological support for the modernization of the automation and traffic control system of passenger transport. Further research will be aimed at automating the method by developing application software for the effective implementation of hardware technical control systems based on the described method. Additionally, this research can contribute to a broader study of complex systems, unraveling connections between parameters, information and technical aspects of hardware complexes and transportation and operational metrics in passenger transport processes.
1. INTRODUCTION
One of the important directions in the development of the infrastructure of the federal city of St. Petersburg, a city of one million people with a complex system of transportation services, is to ensure an increase in the efficiency and quality of the transportation system [1-3].
An important element in the performance of transportation work is the driver of the vehicle, as well as the dispatcher who can regulate the movement of vehicles. In order to regulate the movement of vehicles on the line, they need modern systems that allow them to track the path of travel and transmit information to the monitor of the vehicle, which will allow them to promptly respond to any situation that may arise [4]. Under such conditions, dispatch services that regulate passenger transportation from the end stations become irrelevant. Therefore, the introduction of the above-mentioned automated control systems is the most relevant at the moment.
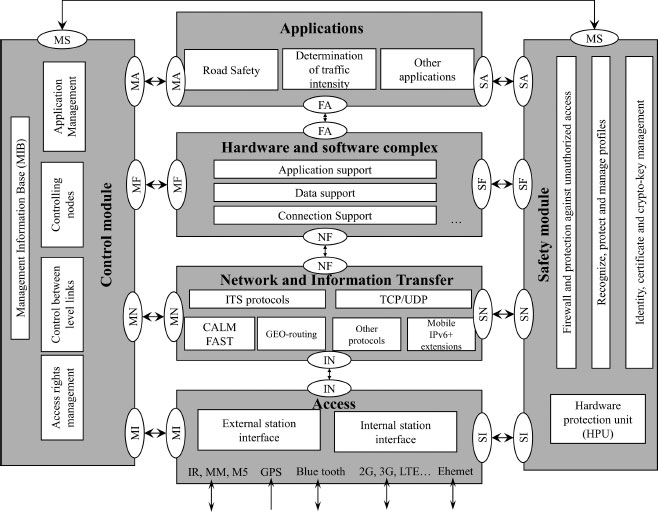
Automated traffic control system (ATCS) is an important part of the construction of urban intelligent transportation system (ITS). The model of ITS construction (Fig. 1) demonstrates functional modules (a module can be a single device or realized in several devices) united in a telecommunication unit, various interfaces used for communication within the system, as well as communication with other ITS objects. When constructing and improving ITS hardware complexes, it is especially important to take into account the optimal choice of its constituent technical means for controlling vehicle motion (TM CVM).
Hardware complexes are understood as a complex of technical and software tools used to automate various processes and tasks of the organization and transport management. There are many methods of TM CVM implementation in the organization of passenger transportation, depending on the specific goals and objectives of the organization. Each of these methods has its advantages and disadvantages, and the choice of methodology depends on the goals, objectives and specifics of the organization of passenger transportation. It is also important to consider the budget, timing and staff qualifications that may affect the TM CVM implementation process [5-9].
The development of ITS and the introduction of TM CVM in the organization of passenger transportation can indeed significantly improve the quality of passenger transportation for several reasons:
Process automation and optimization: TM CVMs enable the automation of various operations and processes related to passenger transportation, such as route planning, schedule management, interval calculation, occupancy control, etc. This reduces errors, optimizes fuel and resource costs, and improves the efficiency and reliability of operations [10, 11].
Improved planning and resource management: TM CVMs allow for more accurate planning of the use of resources, such as vehicles and personnel. They can provide information on bus utilization, optimal routes and intervals, which helps to reduce downtime and minimize unnecessary costs. This enables efficient use of available resources and improves the overall performance of the passenger transportation system [12].
Improved control and monitoring: TM CVMs offer the possibility of more precise control and monitoring of passenger transportation processes. They provide data on timetables, bus movements, congestion, and other important parameters. This allows operators to get real information about what is happening and make quick decisions to improve the quality and efficiency of transportation [13, 14].
Improved service and passenger convenience: TM CVMs can provide passengers with better information about timetables, stops, waiting times and other important parameters. This helps to reduce waiting times and inconvenience for passengers, as well as improve the overall quality of service. In addition, some TM CVMs may offer ticket payment options via mobile apps or contactless cards, which increases passenger convenience. In addition, as a compliment to public transportation services in the given area, while also making public transportation more organized and automated, systems supporting public transport, like bike-sharing systems, are gaining popularity [15, 16].
One of the main reasons for the relevance of TM CVM implementation in the organization of passenger transportation is the increase in the number of passengers and, as a consequence, the increase in transportation volumes [17]. Managing a transportation system without the use of TM CVM can be time-consuming and irrational, especially in conditions of high congestion and complexity of routes.
Monitoring the transportation process and reducing travel time are important tasks in passenger transportation organizations [18]. Various methods and technologies, including TM CVM, are used to solve these problems.
One of the ways to monitor the transportation process is the use of GPS trackers on vehicles [19, 20]. This allows tracking the location of transportation in real-time and managing routes depending on the current situation on the roads.
Another method is the use of a transportation management system (TMS), which allows control and optimization of the transportation process, including control over the movement of transport, traffic schedules, and loading and unloading of passengers [21-24].
Smart traffic light technology and systems that alert passengers to delays or schedule changes are also used to reduce travel time [25, 26]. This improves travel planning and reduces waiting time for transportation.
TM CVM can also be used to monitor the transportation process and reduce travel time. For example, electronic ticketing systems can manage passenger flow, determine the popularity of transport routes and analyze travel data to optimize routes and increase transport speed [27].
However, it should be taken into account that monitoring the transportation process and reducing travel time can only be possible if different technologies and systems are integrated and if there are qualified specialists capable of managing and analyzing the data obtained [28].
The use of TM CVM in the organization of passenger transportation in urban agglomerations, on the one hand, has many advantages, but, at the same time, is also associated with a number of disadvantages and risks. Taking this into account, it is necessary to conduct a thorough analysis and assessment of the advantages and risks, as well as to consider the opportunities and limitations of TM CVM before their implementation in the organization. It is necessary to touch in more detail on the systems of transport tracking or automated transport management systems, as these systems play a key role in the current government contract, as well as affect the quality and safety of passenger transportation. To date, there is no set of key performance evaluation indicators for the selection of TM CVM, therefore, it is difficult to objectively evaluate technical control systems [29-32].
Thus, the aims and objectives of the study are to develop an effective approach for the implementation of TM CVM into the passenger transport organization in urban agglomerations in order to improve the quality of transport services and overall mobility in urban regions.
2. MATERIALS AND METHODOLOGY
The current situation in the field of passenger transportation management is associated with a significant increase in the volume of tasks performed. It promotes the creation of a local telematic automated control system of the transportation process of passenger transport, taking into account the introduction of modern advanced technologies, the formation of which only by organizational and administrative methods without the involvement of scientific potential is impossible. In addition, they are necessary scientific and methodological tools to justify the adoption of equipment and hardware complexes.
The construction of this system requires scientific analysis and search for reserves to increase the efficiency of road transportation on the basis of improving the management system of the transportation process of passenger transport on the basis of system structuring, associated with a different combination of quantitative and qualitative, objective and subjective information describing the problem situation.
In general, a problem situation can be defined as an unacceptable mismatch between the current situation:
 |
(1) |
and the target function of the system:
 |
(2) |
where On - a set of information objects;
Am - set of properties of information objects;
Rq - set of relations “object-object”, “property-property”, “object-property”;
Tp - time;
Z - values of the corresponding components.
In the formation of the decision problem, the mapping Ø is considered: St → Fc.
From the point of view of information characterization, problem situations are subdivided into:
If the specified mapping establishes a mutually unambiguous correspondence between subsets, St and Fc, there is a problem of decision-making under conditions of information certainty. Otherwise, there is information uncertainty, reflected through the unknown availability of information and unreliability of data.
- structured: if all their constituent elements (signs, manifestations, causes, circumstances) and dependencies between them in numerical form are defined;
- loosely structured: if mainly qualitative dependencies between their elements are formulated, information about part of which may be missing;
- unstructured: if neither qualitative nor quantitative dependencies between their elements are defined, as well as the list of the elements themselves.
The deterministic problem of making an optimal design decision on the effective implementation of hardware technical complex in the automation of control processes of the technological process of passenger transportation is formulated as follows:
 |
 |
(3) |
where D is the set of admissible values within which direct, functional and criterion constraints are satisfied, represented as a general system of inequalities and equalities.
The task is considered as a formal representation of the basic requirements for the development of a control system for the technological process of passenger transportation. The problem is not a standard one due to the presence of a vector optimality criterion, which stimulates its reduction to single-criteria problems. Given that the formulation of a scalar solution should be carried out on the basis of a set of output parameters, many of which are contradictory, the improvement of one of them when changing the vector of controlled parameters leads to deterioration of the other, the problem of choosing a reasonable compromise arises.
The simplest and most frequently used method of forming a single target function is linear convolution [33, 34]. The linear convolution preserves many useful properties of the original criteria, such as linearity, convexity, concavity, continuity and differentiability [35]. In its sense, linear convolution is a weighted average of the original criteria, and it is from these positions that its use seems reasonable:
 |
(4) |
where ai - are weighting coefficients that determine the relative importance of individual criteria fi. They also characterize the sensitivity of the target function j(x) to changes in individual private criteria:
 |
(5) |
Additive convolution by expression (2) is most preferable when a decrease in the score for one criterion is compensated by an increase in the score for some other criterion (or several criteria). It is easy to see that even if the score for some criterion is zero, a single score exists.
The multi-criteria arises precisely because of the “heterogeneity” of the available criteria since they cannot be “rolled up” into one formula due to the fact that the values of the criteria involved in the problem, as a rule, belong to different scales and are measured in different units. Therefore, the condition for successful use of linear convolution is the normalization of criteria, i.e., bringing the criteria to a single scale.
This technique consists of applying criteria such as monotonic transformations, which to some extent “equalize” the limits of change of these criteria. The most common transformation of this type is the replacement of the original criterion. fi by a transformed criterion of the form:
 |
(6) |
where Yimax and Yimin are the maximum and minimum values of the function fi on the set X, assuming, of course, that they exist.
However, since we will never go beyond the Pareto set when maximizing a linear convolution with positive coefficients, it makes sense to refine the denominator of the normalized criterion as follows:
 |
(7) |
Where
 - nadir vector, which defines the coordinate boundaries from below the Pareto set, the degree of proximity to it, and realizes a certain distance from the “extreme” Pareto optimal points characterized by the maximum value by some criterion.
The values of the transformed criteria lie within the interval [0, 1], which, in fact, provides the above “equalization”. Moreover, each of these transformations is affine and hence strictly increasing. Therefore, the Pareto set does not change under such a transformation, which means that normalization can be used in conjunction with the Edgeworth-Pareto principle and the subsequent application of linear convolution of the transformed criteria [36].
| Intensity of Importance | Qualitative Assessment | Clarification |
|---|---|---|
| 0 | Incomparable | There is no point in comparing elements |
| 1 | Equally significant | The elements are equal in importance |
| 3 | Slight superiority of one over the other | There is evidence of favoring one element over another |
| 5 | Noticeable superiority | There is evidence that one of the elements is more important |
| 7 | Obvious superiority | There is evidence that one element is more important than the other |
| 9 | Importance is incomparable | There is convincing superiority of one element over another |
| 2,4,6,8 | Intermediate scores between neighboring scores | Used in compromise cases |
To determine the coefficients of linear convolution of criteria, pairwise comparison of criteria “weights” and subsequent application of the method of hierarchy analysis is used [37, 38]. The group of experts compares the criteria in pairs using the information from Table 1. Then, a quadratic matrix of pairwise comparisons W, of dimension n*n, is compiled on the basis of the comparisons made.
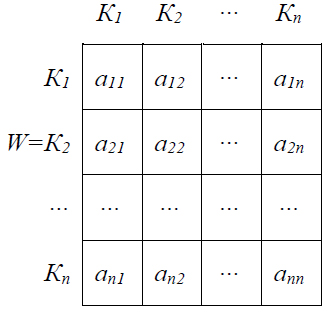 |
The matrix W has an eigenvector ω, which is calculated by the following expression:
 |
(8) |
where
 - sum of each column of the matrix.
The eigenvalue of the matrix W is calculated by the expression:
 |
(9) |
To evaluate the accuracy of the eigenvector determination ω, we can use the average value of λ:
 |
(10) |
hence the accuracy of the obtained solution will be:
 |
(11) |
By introducing a consistency index (CI), one can obtain a more definite estimate of the accuracy of determining the eigenvector ω:
 |
(12) |
The obtained data should be compared with the random consistency (RC) values, which are shown in Table 2 - Random consistency values.
| Matrix Size | 1 | 2 | 3 | 4 | 5 | 6 | 7 | 8 | 9 | 10 |
|---|---|---|---|---|---|---|---|---|---|---|
| Value of RC | 0 | 0 | 0,58 | 0,90 | 1,12 | 1,24 | 1,32 | 1,41 | 1,45 | 1,49 |
The consistency score (CS) is defined as follows:
 |
(13) |
The CS value should be in the range of 10% to 20%. In this case, expert judgments are not contradictory. After that, the criteria are assigned weights in the following order: the criterion with the highest value of the matrix eigenvector ω is assigned a weight equal to one, the other criteria are assigned a weight equal to
 .
.
A matrix of options is formed on the basis of the assigned scores, with the help of which the “ideal object” is defined:
 |
(14) |
and the worst object
 |
(15) |
If the criteria are heterogeneous, in order to compare the values of the criteria, it is necessary to go to normalized units by transforming their values according to the expression:
 |
(16) |
where - Kj is the current value of the criterion of the compared object.
The criterion values in relative units dj are interpreted as the distance of the j-th object according to the criterion Kj from the “ideal object”, which has a distance dj = 0, and the “worst object”, which has a distance dj. Using the generalized convolution, it is possible to identify the “best objects”:
 |
(17) |
Where p is the degree of concentration, which allows us to pass to different metrics. At p = 2 the generalized metric Lp corresponds to the Euclidean distance. The larger is the value of Lp, the closer is the object Yi to the “ideal object” Y+.
In general, the study of TM CVM in passenger transport organizations helps to determine the efficiency of their use, identify problems and shortcomings, and propose solutions for their improvement. The following factors should be considered when researching TM CVM in passenger transport organizations:
- compatibility with other systems and software used in the organization;
- reliability and stability of the TM CVM
- speed and performance of the equipment
- ease of use and customization;
- compliance with legal requirements and regulatory documents;
- cost and cost-effectiveness of TM CVM utilization
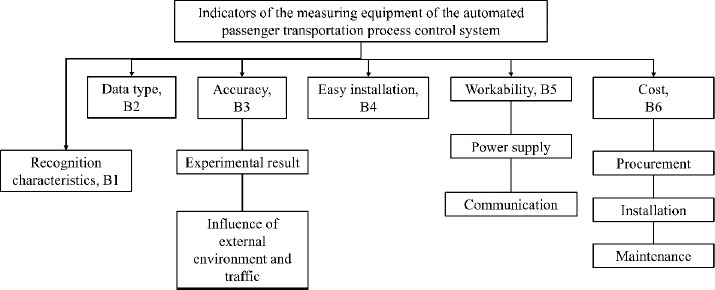
The key elements of the automated passenger transportation process control system are TM CVMs, the main components of which are measuring equipment (ME). The requirements for ME of automatic TM CVM, on the basis of which it is necessary to carry out a rational choice of hardware based on the conditions and specifics of their application on the highway, have been formed. The main indicators of MEs of the automated control system for passenger transport have been established in order to rationally select and evaluate (Fig. 2).
3. RESULTS AND DISCUSSION
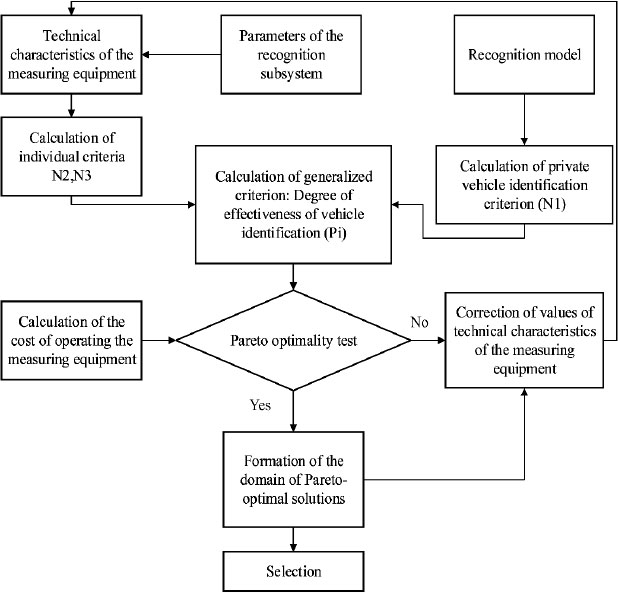
The algorithm of rational choice of MEs of the automated passenger transportation process control system has been developed (Fig. 3), on the basis of the Pareto method for rational choice and estimation of MEs of the automated passenger transportation process control system by private criteria: efficiency of identification, cost of MEs. The generalized criterion Pi - the degree of efficiency of identification for rational instrumentation of MEs of the control system is defined. MEs of the automated passenger transportation process control system are a set of probabilities of the solution of the k-th problem. Identification in the degree of compliance with the obtained probabilistic assessment (Pk) and the required (Pkn):
 |
(18) |
 |
(19) |
 |
(20) |
Thus, the assessment of the effectiveness of the task of recognition of objects of the MEs of the automated passenger transportation process control system will be characterized by the coefficient. Pi = 0...1 and depends on the degree of compliance of the probability of the solution of each recognition task specified in the terms of reference.
The cost of keeping the device operational during the lifetime of the measuring instrument has a limit on the maximum allocation for its creation and modernization. To make a comparative analysis and select the most appropriate system, it is sufficient to understand the costs associated with purchasing the hardware and preparing the location where the device will be installed. The cost is influenced by the characteristics of the location where the device will be installed, the type of data to be acquired, the area of application and the number of lanes.
 |
(21) |
where Cvu is the expense for maintaining the device's operability during the whole service life, rubles;
CME is the cost of one device, rubles;
NME is the number of MEs;
C1 is the turnkey installation cost in rubles;
CM is the annual maintenance cost in rubles per year;
i is the credit rate in %;
n is the service life in a year.
The cost analysis should take into account the costs associated with pavement reconstruction resulting from the use of different sensors.
It is advisable to directly calculate CVU using the method of comparison of analogs. The essence of this method is to estimate the cost of a new piece of equipment by recalculating the cost of its closest analog Can through the coefficients of novelty Kn and efficiency Kef. The general estimate of the cost of the equipment CVUi using the method of comparison of analogs will be as follows:
 |
(22) |
As a result, the search for rational equipment and evaluation of MEs is determined by private indicators is presented as an estimate of the probability of the quality of vehicle control taking into account the weights of private factors:
 |
(23) |
where R(g) is the final score of realizability in points;
Bi is the score of i-th factor of realizability;
ni - weight of i-th factor.
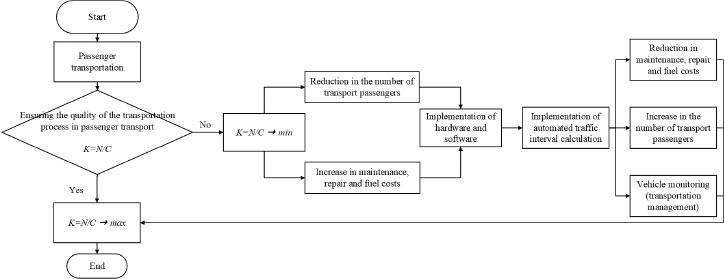
The developed algorithm for the implementation of an automated transportation process control system for passenger transport becomes a key tool for the successful improvement of operational processes and the quality of services provided. The algorithm of implementation of TM CVMs includes a sequence of steps that an organization must go through to successfully integrate and use these tools. The algorithm presents an efficiency factor, which is found as the ratio of the number of passengers transported to the cost of operating materials. If it tends to the maximum, then the implementation of transportation is carried out efficiently; if it tends to the minimum, then it is not efficient.
 |
(24) |
Therefore, in this case, the impact of hardware means on the organization of transportation can be expressed as the difference in efficiency coefficients before and after the implementation of TM CVMs (∆K), according to formula 4.
 |
(25) |
The adoption of TM CVMs in the organization of passenger transportation in urban agglomerations can improve the quality and efficiency of transportation, reduce the cost of transport operation, increase passenger satisfaction and improve the environmental situation in the city.
Thus, based on this hypothesis, it can be assumed that the introduction of an automated passenger transportation process control system can lead to significant improvements in the work of transportation companies and improve the quality of life of citizens. The implementation of an automated passenger transportation process control system is required in stages, starting with the selected solution and then planning its integration with other management systems, such as accounting of payment and transport schedules.
The discussion of the importance of the most significant factors was carried out on the basis of the methodology of expert evaluations, which allowed to establish the criteria that determine the choice of hardware complexes of passenger transport transportation process control. The presence of accounting in the automated system of transportation process control of these factors will significantly increase the quality and percentage of transport work, which will positively affect the development of the city infrastructure [39-43].
The most important factors include:
1. Server capacity requirements – x1.
2. Accessibility for the operator (Intuitive accessibility of the functionality for the operator – x2, Easy loading of input data – x3).
3. Display the main aspects and events (Route congestion – x4, Time increase – x5).
4. Delays in receipt of ITS data – x6.
5. Monitoring and control of traffic interval between vehicles – x7.
6. Data output from the system (On transportation work – x8, Operator work – x9, Driver work – x10.)
7. Application of artificial intelligence – x11.
8. Ability to output data to external sources – x12.
9. Ability to synchronize data between hardware complexes – x13.
The results of the discussion are summarized in Table 3. The smallest value of the sum of the ranks in the obtained result implies the greatest significance.
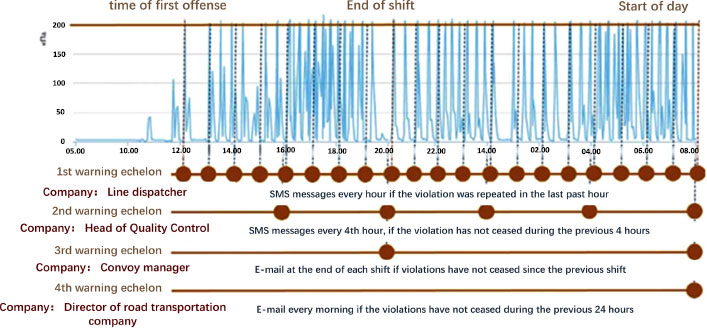
Thus, from Table 3, it is established that four factors: the ability to synchronize data between hardware complexes, intuitive accessibility of the functionality for the operator, display of the main aspects and events, monitoring and control of the traffic interval between vehicles, are the most significant criteria in the selection of hardware complexes for passenger transportation process control. The presence of accounting of parameters of movement of passenger transport in the software of hardware complexes of these factors will significantly increase the quality and percentage of transportation work, which will positively affect the development of infrastructure of the city, a fragment of which is presented in Fig. (4). When implementing the monitoring system of passenger transportation hardware complexes, 4 echelons of notification are defined: for line personnel and management.
As a result of the analysis of the transportation process of passenger transport in St. Petersburg, it was found that vehicles can enter the line with an interval of 1 min, while the planned interval is 15 min, which is unacceptable. To ensure better quality passenger transportation, the introduction of technical means of controlling the movement of vehicles with automated calculation of the interval between vehicles plays an important role. Thus, this methodological approach will increase the number of passengers transported per unit of time, reduce the waiting time at stops, increase the efficiency of transportation, and make it more dense.
Hardware complexes with automated calculation of traffic intervals will make transportation more dense, comfortable and safe, as well as increase the resource and reliability of vehicles. The developed algorithm for the effective implementation of intelligent hardware complexes in the management of the transportation process of passenger transport is presented in Fig. (5).
Implementation of predictive calculation of intervals between vehicles will allow to carry out adjustment automatically, rather than based on the qualification of the responsible specialist in this area. As a result, the algorithm for the predictive calculation of intervals between vehicles with a detailed description has been developed.
Calculation of the interval of departure of the next vehicle from the final point is carried out according to formula 26:
 |
(26) |
where: - vehicle, the last vehicle sent on a trip from the end point; - vehicle for which k=2 - vehicle for which the departure interval is calculated; - vehicle for which k=3...n - vehicle that will be sent on a trip after the next one, etc. for all vehicles on the route; - vehicle for which k= n + 1 - the first vehicle that after arrival from the trip will be sent on another trip (will go on the second round). In case of the absence of these vehicles (all vehicles are sent to the park), the calculation is carried out for values k from 2 to n; i2 is departure interval from the final point of the next vehicle; kd-kmin is the departure time of the k-th vehicle from the destination point, calculated as the sum of the predicted time of arrival at the destination point and the minimum possible parking time (taking into account the driver's labor mode); td1 is the departure time from the end point of the first vehicle; K 0 is occupancy coefficient (the ratio of the number of passengers on the bus to its maximum capacity); Ktd is time-of-day coefficient (e.g. peak and off-peak hours); Ktd is weather coefficient (e.g., rain, snow); KS is season coefficient (e.g. summer, winter).
| Factors | x7 | x13 | x2 | x5 | x4 | x1 | x6 | x8 | x3 | x9 | x10 | x11 | x12 |
|---|---|---|---|---|---|---|---|---|---|---|---|---|---|
| Sum of Ranks | 18 | 23 | 28 | 32 | 42 | 46 | 56 | 64 | 73 | 74 | 75 | 98 | 99 |
Using these parameters and coefficients, it is possible to calculate the departure intervals of buses on the route.
Occupancy coefficient: from 0.5 to 1 depending on the bus capacity of the route, where the value of the factor for low bus capacity is 1 and for high bus capacity is 0.5;
Time-of-day coefficient: from 0.8 to 1.2 depending on peak hours and traffic congestion, where low demand for transportation is 0.8 and high demand is 1.2;
Weather coefficient: from 0.9 to 1.3 depending on the presence of precipitation, strong winds, and ice, where rain, snow is 1.3 and sunshine is 0.9;
Season coefficient: from 1.1 to 1.2 depending on the season and changes in the number of passengers on the route.
The values of the coefficients can be selected and changed based on the analysis of monitoring data and the experience of the passenger transportation organization. These coefficients were calculated using correlation analysis through the Phyton program.
On the “long-distance” (in steady-state mode), the interval can be determined by formula 27:
 |
(27) |
where: i is traffic interval; Tta is standard time for performing a turnaround trip; Tpe is standard parking time at the endpoint; Nvehicle is the number of vehicles operating on the route.
The payback period of the project is calculated as the ratio of total costs to the monthly amount of violations. Return on capital investment will be equal to:
 |
There is an increase in the efficiency ratio after the intelligent hardware complexes implementation, taking into account the automated calculation of traffic interval in passenger transportation organizations. This indicates a more efficient use of resources and increased productivity of the transportation system.
Thus, the implementation of the project to implement a method of calculation of bus interval violations at the bus station is quite effective; the payback period is short, and the return on capital investment is 47%. This confirms the significance and feasibility of the implementation of this project for the economic efficiency of the bus station. By automating and calculating bus interval violations, it is possible to achieve the reduction of these violations and significant cost savings.
Thus, the research results show that the use of the selected TM CVMs and the developed bus interval formula is an effective solution to optimize the process of passenger transportation in urban agglomerations. Based on the results obtained, it is possible to determine the optimal interval of buses and set up the software for automatic calculation of this interval. This will reduce the waiting time of passengers at bus stops and increase the convenience of passenger transportation. Also, the obtained data on passenger occupancy can be used to optimize the operation of bus routes and adjust the corresponding transport infrastructure, for example, to install additional stops or change the route [44].
CONCLUSION
The results of the conducted research on the effective implementation of intelligent hardware complexes in the management of the passenger transportation process have been presented. The results of the study allow us to conclude that there is a significant impact of TM CVMs on increasing the efficiency coefficient of passenger transport. The proposed approach can be used to determine the criteria for the selection of hardware complexes to control the passenger transportation process, rational implementation of TM CVMs on highways, and the efficiency indicators of passenger transport at different levels of ITS design as one of the criteria for transition to a new level in the development of vehicles and technology. Its use has enabled the widespread introduction of continuous monitoring and services for passenger transport [45-52]. The models, methods and algorithms of effective implementation of intellectual hardware complexes in transportation process management of passenger transport are formed. The coefficient of efficiency of passenger transportation is presented, which is found as the ratio of the number of passengers transported to the cost of operating materials. The discussion of the importance of the most significant factors in the selection of hardware complexes for transportation process control was carried out on the basis of expert evaluations, the results of which established that the possibility of data synchronization between hardware complexes, intuitive accessibility of functionality for the operator, display of the main aspects and events, monitoring of traffic interval between vehicles, are the most significant criteria.
Monitoring and control of travel intervals is one of the factors contributing to the increase in vehicle life. By reducing empty mileage and optimal use of vehicle resources, it is possible to achieve more efficient and economical operation of the transportation system.
To a certain extent, it was considered as an example of the application of the proposed methodology for effective implementation of hardware complexes in the management of the transportation process of passenger transport on the basis of the developed dependence and the order of calculation of the interval of movement of passenger transport in the application of hardware complexes. The given methodological approach will allow rational implementation of technical means for controlling passenger transport motion, taking into account the determination of the optimal interval of passenger transport movement. Calculations of economic and technical feasibility have shown an increase of efficiency by 20-40% and return on investment by 47%, which confirms the economic feasibility of the solutions.
The developed methodological approach for the effective implementation of intelligent hardware complexes in passenger transportation process control can serve as methodological support for the modernization of the automation and traffic control system of passenger transport. Further research will be aimed at automating the method by developing application software for the effective implementation of hardware technical control systems based on the described method. Additionally, this research can contribute to a broader study of complex systems, unraveling connections between parameters, information and technical aspects of hardware complexes and transportation, and operational metrics in passenger transport processes.
LIST OF ABBREVIATIONS
| ATCS | = Automated traffic control system |
| ITS | = Intelligent Transportation System |
| TM CVM | = Technical Means For Controlling Vehicle Motion |
| TMS | = Transportation Management System |
CONSENT FOR PUBLICATION
Not applicable.
AVAILABILITY OF DATA AND MATERIALS
The data presented in this study are available on request from the corresponding author [R.S].
FUNDING
None.
CONFLICT OF INTEREST
The authors declare no conflict of interest, financial or otherwise.
ACKNOWLEDGEMENTS
We thank Dr. Ruslan Safiullin for his help with the experimental part of this study and for his contribution to the review and revision of the manuscript.


