All published articles of this journal are available on ScienceDirect.

Ports Go Green: A Cost-energy Analysis Applied to a Case Study on Evaluating the Electrification of Yard Tractors
Authors Info & Affiliations
Abstract
Introduction
Electrification of handling equipment and vehicles used in seaports is becoming increasingly common. The electrification of port equipment is potentially beneficial in terms of local environmental impact and operating costs. However, initial investments are very high.
Objective
The goal of this paper is to provide a tool for decision-makers to assess the technological and financial feasibility of electrifying yard tractors in a container terminal. Considering the technological development of batteries expected in the coming years, the paper investigates when the electrification of yard tractors could be cost-effective.
Methods
The paper proposes a technical and economic-financial analysis to assess the feasibility of a transition of port handling equipment from internal combustion diesel engines to electric vehicles. The proposed methodology is applied to the case study of the PSA-SECH terminal in the port of Genoa (Italy), demonstrating the advantages and limitations of electric tractors in the port context.
Results
The analysis shows that the use of electric powertrains for yard tractors is feasible technologically and from the point of view of energy use. However, at present, the investment is not profitable given the current situation in terms of costs and technology.
Conclusion
Electrification of yard tractors is a potentially beneficial transformation for port handling processes. Nevertheless, the entire energy chain should be considered in order to assess its environmental sustainability. Other alternative powertrains should be investigated.
1. INTRODUCTION
In 2022, the transport sector was responsible for producing 22.96% of global greenhouse gas (GHG) emissions, 2.1% more than the previous year [1]. More than a third of this percentage was due to freight transportation [2]. If no action is taken, this situation will worsen, considering that freight transport demand is expected to triple by 2050 [3]. Emissions derived from logistics site operations, such as maritime ports, contribute to total emissions from freight transport. Moreover, terminal operations generate negative externalities, especially when ports are adjacent to cities: traffic congestion, high noise levels, and poor air quality, with consequent health risks [4, 5]. The most significant source of pollution in ports [6, 7] is handling equipment. This is due to the fact that most of this equipment, such as straddle carriers, reach stackers, yard tractors, and cranes, are powered by diesel Internal Combustion Engines (ICE) and are used intensively throughout the day in 24-hour shifts.
Starting from the European Commission WHITE PAPER [8] and to the European Green Deal [9] and the latest Fit for 55 package [10], recent European policy is directed at reducing the greenhouse effect and pollutant emissions by applying a variety of policies, for instance emissions trading and the introduction of the “polluter pays” concept. Therefore, like other actors in the transport sector, seaports must comply with existing sustainability guidelines and legislations. One area of action for ports concerns emissions from handling equipment. Currently, an extensively applied solution is to convert this equipment into purely battery-electric vehicles (BEVs). This electrification of the fleet can bring two major benefits to the company: the improvement of the corporate image, linked to the use of innovative and sustainable technological solutions, and the reduction of maintenance costs [11]. In this context, one of the open questions for ports concerns the evaluation of the initial investment required for the conversion of port equipment. Is it worth making this switch in light of current technologies? Are the fuel consumption and range of these vehicles compatible with their use in port terminal yards?
This paper tries to answer these questions by developing a methodology to evaluate the energy use and costs related to the choice of electrifying the fleet of port yard tractors and then applying it to the PSA-Sech terminal in Genoa, Italy. The aim of the paper is to provide a decision-making tool for terminal operators to assess the feasibility and limits of the electrification of yard tractors used in container terminals.
The paper deals with yard tractors as they are a major source of emissions and other negative externalities within terminals [7]. To the best of our knowledge, no work can currently be found in the literature that reconciles technical-energy and economic-financial perspectives: this paper aims to bridge this gap and provides an important tool for strategic port planning.
The remainder of the paper is structured as follows. In Section 2, an analysis of the literature regarding the electrification of vehicles, particularly port yard tractors, is provided, both from a technical/energy and from a financial-economic perspective. In Section 3, a new methodology is presented for the technical-economic evaluation of the choice to electrify port yard tractors, while in Section 4, the application of the methodology to the case of terminal PSA-Sech is described. The obtained results are analyzed and discussed in Section 5. Finally, in Section 6, some conclusions are outlined together with suggestions for future research.
2. LITERATURE REVIEW
2.1. Technological Side
The topic of sustainability is of the highest interest due to both the growing public awareness of environmental issues and the enacted regulations aiming to achieve the targets of the European Green Deal [9]. There are many studies related to the solutions to reduce GHG emissions in inland shipping, such as the introduction of rail services for dry ports [12-14], the use of technological solutions to reduce ships’ emissions inside ports [15-18] or terminal equipment’s emissions [6, 7, 19-22].
Many researchers, institutions, and decision-makers consider electrification one of the possible ways to reduce local pollution and GHG emissions. Numerous studies can be found in the literature on the technical evaluations related to the electrification of vehicles, such as cars [23-26], road tractors [27], or buses. From a technological perspective, there are detailed studies in the literature on the dynamics and components of the braking system of electric vehicles [21, 28-31]. Other studies investigated the energy storage systems of electric vehicles [32, 33], the energy management system [34, 35], and the effects of battery capacity on vehicle endurance [36]. Furthermore, different types of charging infrastructure have been studied [37, 38].
Several studies aim to find solutions to mitigate the negative effects generated by yard tractors in ports. A study [7] proposed switching to LNG (Liquefied Natural Gas) tractors. Other studies [21, 39] estimated the emissions from yard tractors. In particular, a study [39] calculated the emissions of the main pollutants (NOX-oxides of nitrogen, PM-Particulate Matter, CO2) attributable to yard tractors while also evaluating the potential effectiveness of yard tractors powered by alternative fuels, such as NG (Natural Gas), LPG (Liquefied Petroleum Gas) and water-emulsified fuels. A study [21] focused on calculating the emissions produced by yard tractors during container lifting operations. A few studies [7, 40, 41] proposed alternative solutions. A researcher [40] showed that in relation to yard tractors, a viable fuel alternative to mitigate greenhouse gas emissions could be hydrogen. To demonstrate the benefits of electric vehicles, a study [41] proposed and tested a plug-in hybrid electric vehicle (PHEV) yard tractor design in four major US ports. A study [42] proposed replacing the terminal's old fuel-powered tractor with a new liquefied natural gas tractor to help reduce CO2 emissions. Some research has considered the electrification of these vehicles to reduce emissions and fuel consumption [40, 43] from a Well-to-Wheel (WTW) perspective [20, 44]. Regarding fuel consumption, a study [43] compared different heavy-duty BEVs, including yard tractors. The comparison of different energy storage systems with a life-cycle approach showed that BEVs may not prevail outright [45]. On this topic, a study [20] compared diesel and electric tractors, also assessing the adoption rate based on estimated throughput growth and investment costs.
One of the alternatives to replace ICE vehicles is battery electric vehicles (BEV), which have more efficient motors but also the flow of batteries. BEVs reduce both noise emissions and local pollution, bringing benefits to breathable air quality. However, global emissions depend on how electricity stored in batteries is produced: it can bederived from renewable sources or nuclear power, but also from fossil fuels [46]. A study by the Argonne National Laboratory [47] compares equivalent diesel consumption for different types of propulsion. This study shows that small electric trucks save around 70% in energy consumption with respect to conventional ones: this is because the efficiency of an electric motor is around 88-92%, while that of an ICE can attain 40%. An ICE-powered vehicle, undisturbed by traffic jams and traffic lights, can attain a total of 33-34%. If one cautiously considers this 30% to BEVs’ 90%, the saving appears to be 60%, but a loss of savings occurs due to upstream electricity production, distribution, and recharge processes.
Regarding maintenance, BEVs are built from a small number of robust components and one weak component: the battery. Moreover, thanks to regenerative braking, the brake pad consumption is lower compared to a conventional, not hybridized powertrain. Furthermore, the use of electric motors solves the problem of clogging the DPF (Diesel Particulate Filter) typical of ICE vehicles used for short distances at low speeds, in which the filter does not reach the right operating temperature, resulting in an increase in harmful emissions; full hybrid and plug-in hybrid solve this issue also, using electric traction where appropriate. On the technical side, the work by Sato S et al. [43] limits its scope to energy consumption.
Although numerous papers devoted to electric vehicles have been published in the literature, little research has been devoted specifically to construction tractors and the evaluation of their cost-effectiveness from a technical and economic point of view. This paper tries to fill this gap.
2.2. Economical Side
A number of critical issues still need to be addressed, mainly related to the cost of initial investment for the purchase of BEVs, the cost of electricity - especially in the case of quick, fast, and ultrafast charging – as well as the installation of charging stations, scheduling issues and specific staff training.
In terms of economic evaluation, no easily applicable and useful methodologies have been found to assess investments for the electrification of handling equipment. The economic aspects related to the reduction of emissions in transportation are also extensively studied in the literature. A study [22] calculated the costs associated with reducing CO2 emissions within the terminal and formulated a strategy to meet regulatory targets while minimizing associated expenses. A study [48] identified cost factors affecting the electrification process of a container terminal implementing a smart grid. A Researcher [49] studied the potential of using battery-powered Automated Guided Vehicles (AGVs) within terminals, presenting economic analyses. A research [50] demonstrated the economic benefits of using electric school buses in the city compared to conventional diesel ones, although highlighting their negative externalities. Several examples of cost-benefit analyses related to the deployment of EVs [51-54], often conditioned by the specific use of the vehicle, can be found in literature.
3. METHODOLOGY
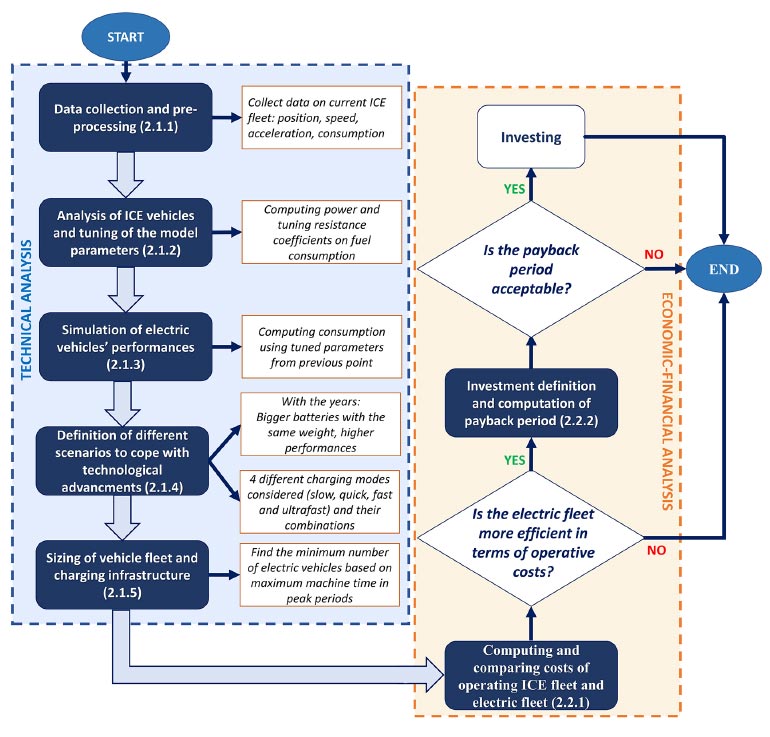
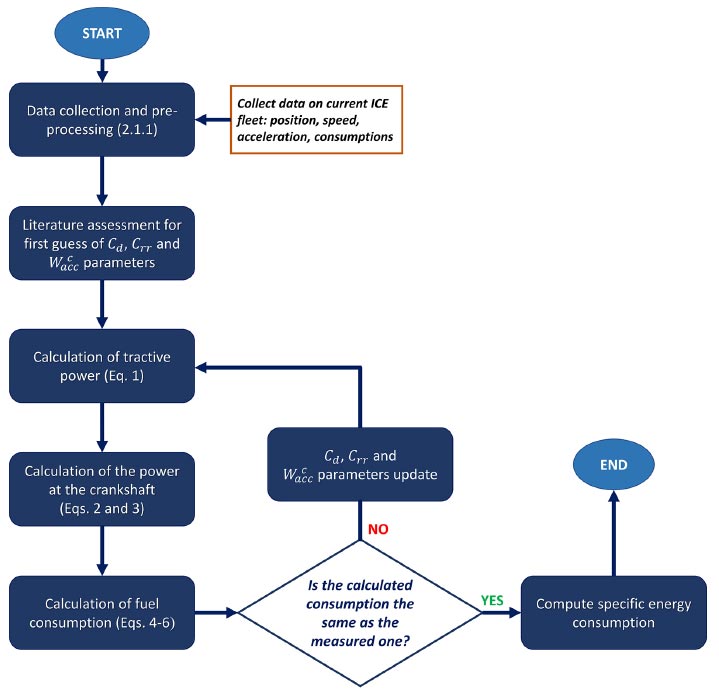
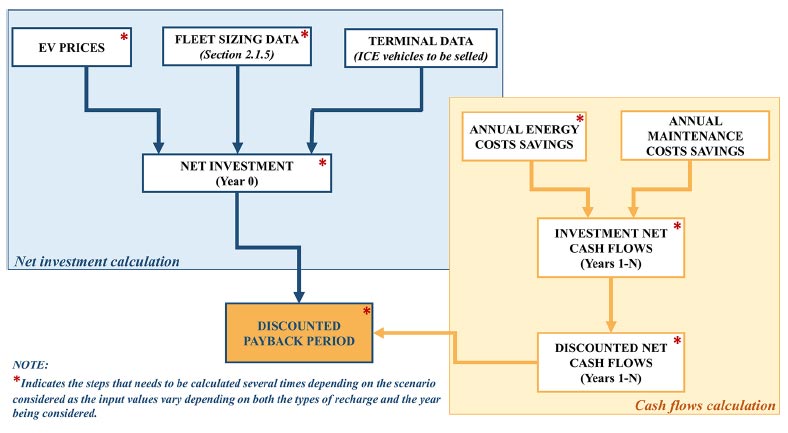
Fig. (1) presents the methodology used related to the evaluation of the investment for the electrification of yard tractors. It consists of two phases: the technological analysis, i.e., the sizing of the fleet to meet the handling demand, and the economic assessment, determining the cost-effectiveness of electrification.
In the following Sections, each phase of the methodology is discussed in more detail.
3.1. Technological Analysis
To size the fleet of BEVs, a heuristic algorithm was developed as follows:
- Data collection and pre-processing
- Analysis of ICE vehicles and tuning of the model
- Estimation of BEV-specific consumption
- Scenario definition (battery capacity, technological improvement)
- Fleet dimensioning.
Each step is explained in detail in the following paragraphs.
3.1.1. Data Collection and Preprocessing
The first step is a data collection campaign. It is necessary to consider the number of shifts during which the vehicle was used. The following data is required: vehicle position, speeds and acceleration, consumption at the end of the shift, shift planning, and vehicles’ logbooks. Moreover, it is necessary to proceed with preprocessing, i.e., data cleaning, anomaly detection, and correction.
3.1.2. ICE Vehicle Analysis
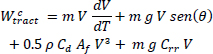
The starting point of analyzing the operation of an ICE tractor is the calculation of traction power. Reference was made to the methodology used [28], which considers the speeds V [m/s] measured at each time instant to calculate the tractive power  [W] is required to overcome the resistance (eq 1).
 |
(1) |
In eq (1) g [m/s2] is gravitational acceleration, ρ [kg/m3] is air density, θ[°] is the slope of the road, Aƒ[m2] is the frontal area of the vehicle and m [kg] is its mass (weighted average per km of the mass of the vehicle and the mass of the trailers empty and loaded). The accessory power [W] is assumed constant. As a first guess, the aerodynamic drag Cd and tire rolling resistance Crr coefficients are assumed in line with the literature.
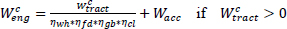
The second step in this iterative process is the calculation of power at the crankshaft:
 |
(2) |
 |
(3) |
The following efficiencies are present in eq (2): ηwh considers the tire, ηƒd the differential, ηgb the gearbox and ηcl the clutch. The power at the crankshaft is positive during the traction phase, while for stationary or decelerating vehicles, the power is  .
.
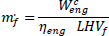
 is converted into consumption [L] through the lower heating value LHVf (eq 4), the engine efficiency ηeng (eq 5) and the fuel density ρf (eq 6) as follows:
 |
(4) |
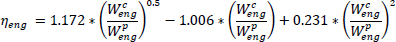 |
(5) |
 |
(6) |
where  [W] is the engine peak power, as per the vehicle datasheet and
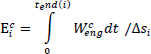
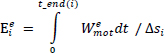
  is the fuel mass flow rate. At this point, the iteration is concluded if the fuel consumption1 values are consistent with those measured on the vehicle and the parameters are considered tuned. Once the convergence is reached, the specific consumption of the ICE vehicle can be calculated in [kWh/km] as in eq (7), where integration is done on each i-th actual shift, and the ∆s refers to the km travelled during the i-th shift.
 |
(7) |
Finally, the average specific consumption overall shifts for a diesel vehicle when Ec [kWh/km] is used.
Fig. (2) shows the iterations for fine-tuning ICE vehicle parameters.
3.1.3. Analytical Simulation of Battery Electric Vehicles
Once Cd, Crr and have been correctly defined, the performances of BEVs are compared with ICE vehicles. The assumptions made are:

-
is constant because the sub-systems to be powered are the same
- Crr is the same
- Cd is the same because the two vehicles have the same shape and surface;
- m is weighed down by the battery (average battery weight is 1400 kg).
Therefore, the traction power can be calculated using the same approach as for ICE vehicles, i.e., using eq (1). For the BEV, it is necessary to define the boundaries of regenerative braking. Based on the literature on electric buses - the most suitable given speed profile - the range of regenerated energy is set at 20-30%. Limit values are sought for speed and acceleration, below which regeneration does not occur, and the energy is dissipated as heat through the mechanical brakes. The following iterations are performed:
- STEP 1: The regenerated power for the braking phase in the given shifts is calculated. No threshold is considered for the first iteration.
- STEP 2: All instants are eliminated when speed and acceleration are below the threshold.
- STEP 2.1: Is the average regenerated power in the expected range?
- STEP 2.1.1: Yes: The values for speed V1b [km/h] and acceleration are set αhb [m/s2]
- STEP 2.1.2: No: increase the threshold and repeat the calculation from step 1.
Error! Reference source not found. Fig. (3) shows the iterations to the final result
Hence, it is possible to calculate the power at the motor shaft [W] for the four phases of motion, i.e., traction (eq 8), idle (eq 9), regenerative braking (eq 10), and mechanical braking (eq 11):
 |
(8) |
 |
(9) |
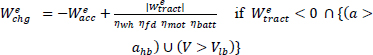 |
(10) |
 |
(11) |
where ηmot and ηbatt are the efficiency of the electric motor and of the energy conversion of the battery, respectively. It is then possible to calculate the specific consumption in [kWh/km] for an electric yard tractor (eq 12) and comparisons can be drawn with diesel vehicles per shift.
 |
(12) |
The average specific consumption overall shifts for an electric vehicle when Ee[kWh/km] is used.
3.1.4. Scenario Definition
Addressing strategic planning, with technologies that have improved significantly over the years, the evaluation of the investment must account for when it is likely to be the most profitable. Therefore, the time horizons suggested are as of today, 5 years from now, 2035 and 2050 (milestones for European decarbonization targets).
For each year, the average correction coefficients are applied as in the literature with the increase in battery storage capacity and the improvement in the performance of heavy-duty vehicles [47]. Therefore, the paper considers 16 different scenarios, as shown in Table 1.
| Scenario |
Specific Energy Consumption
Reduction [%] |
Battery capacity Ebatt [kWh] |
|---|---|---|
| Scenario Present | 0% | 112 – 148 – 174 – 222 |
| Scenario 2027 | -6% | 128 – 169 – 199 – 254 |
| Scenario 2035 | -6% | 150 – 199 – 234 – 298 |
| Scenario 2050 | -13% | 218 – 288 – 338 – 431 |
3.1.5. Sizing of the Fleet Depending on Scenarios
Lastly, a minimum size for the vehicle fleet based on the scenario considered is computed. To this end, the average ∆SOC per hour based on the battery capacity Ebatt [kWh] of each scenario is considered, where the State of Charge (SOC) of the battery is:
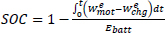 |
(13) |
This makes it possible to estimate how many hours each vehicle can work on average without being recharged. Recharging time is, in fact, the most critical factor in sizing the electric fleet. The most unfavorable working conditions should be considered, i.e., when the machine hours are at their maximum for a period of time, such as when a ship docks in a port and unloads thousands of containers. The high handling demand must be met at all times, regardless of the SOC of the vehicle.
Different charging modes are considered, namely, slow, quick, fast, and ultrafast charging, and a homogeneous combination of them, i.e., availability of two or more modes with equal probability for the vehicle to be recharged with a specific mode. In this way, it is possible to compute different charging times for each battery capacity. For the slow mode, the charging time is proportional to the power used because the current involved is relatively low and does not vary during the process. For quick, fast, and ultra-fast charging, the following applies:
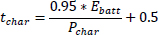 |
(14) |
where Pchar[KW] is the power used by the specific mode.
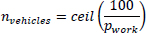
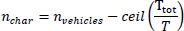
Once these data have been obtained, taking the total machine-time Ttot[hours] for the vehicles during the time frame of a peak period of T[hours] as a reference, the number of times an n vehicle can be used is computed in Eq 15. In this equation Tworks[hours] is the amount of time it takes to discharge the battery. Next, the percentage of a vehicle's working hours pworks[%] out of the total machine time of the peak period is calculated (eq 16.). Then, the minimum number of vehicles required to meet the demand during peak hours nvehicles is easily computed (eq 17). The number of vehicles to be recharged simultaneously nchar with a given charging mode is calculated according to eq (18), which gives the number of charging stations required in the seaport yard.
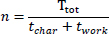 |
(15) |
 |
(16) |
 |
(17) |
 |
(18) |
3.2. Economic-financial Analysis
Once the fleet size has been determined, economic analyses can be conducted. The first aspect to assess is the cost-effectiveness of supplying energy to a fleet of electric vehicles compared to a fleet of conventional vehicles. Next, the financial profitability of the investment can be considered by analyzing the discounted payback period of the investment.
3.2.1. Energy Consumption Cost
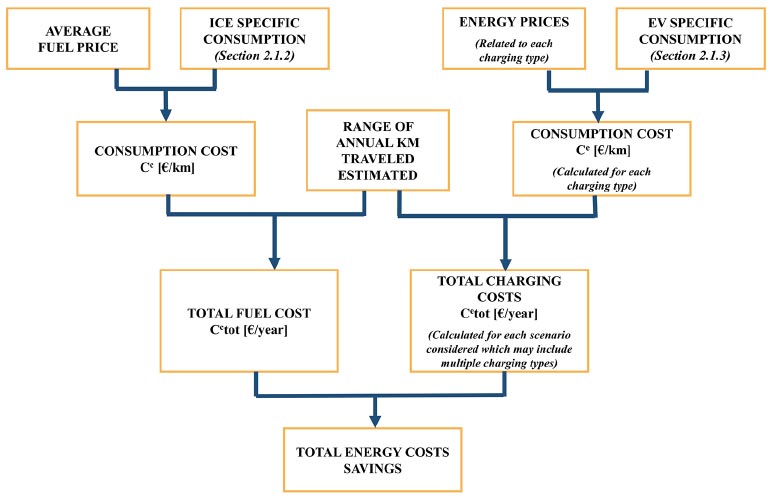
For conventional vehicles, fuel consumption costs Cc are calculated by multiplying the specific fuel consumption Ec (Section 2.1.2) by the average price of fuel pc:
 |
(19) |
In the case of BEVs, to calculate the cost of energy Ce, the specific vehicle consumption Ee (Section 2.1.3) is multiplied by the unit price of electricity pe:
 |
(20) |
pe varies depending on the service provider and the charging mode desired; hence, it is necessary to estimate the average price for each type of charging mode considered. Since the purpose of the paper is to provide a user-friendly tool to be used in the decision-making process, an approximation can be made, including a share related to the infrastructure cost in the energy price. To determine the pe, we consider that:
- For slow charging, the unit price of the electricity supplied can be used since the cost of the charging station is reasonably low
- For quick, fast, and ultrafast charging, reference is made to the average tariffs of public charging stations.
The total savings calculation needs the determination of the total costs for both ICE vehicles and electric vehicles. It is then necessary to establish a range of kilometers travelled (R) by the vehicles during the year, which will vary depending on the terminal operativity. The total costs of ICE vehicles and BEVs are provided in eqs (21) and (22). Finally, the annual savings on energy consumption (Sen) follows in eq (23):
 |
(21) |
 |
(22) |
 |
(23) |
Fig. (4) summarizes the operational procedure for the calculation of Sen.
3.2.2. Payback period of the investment
In this research, the payback period was used to evaluate investments. It measures the time required for the expected cash returns generated by an investment to equal the initial cash payment required to implement the investment. The limitations of the traditional payback period are that it does not consider the company's cost of capital or the inflation rate. Furthermore, it is calculated on the basis of a single representative year without discount. The discounted payback period (DPBP) overcomes this problem [55], providing fairly complete information while remaining user-friendly.
- STEP 1: Calculation of the initial investment. It mainly includes the purchase of BEVs and the net of the sale of replaced conventional vehicles.
- STEP 2: Calculation of the average annual cash flows (CFn) generated by the investment. They consist of (Sen) (eq 23) and maintenance.
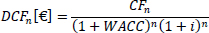
- STEP 3: Calculation of the Discounted Cash Flows (DCFn) for each year n, by discounting the (CFn) using eq (24), which considers both the cost of capital (WACC, which is specific to the company) and the inflation rate affecting cash flows. Here n = 0 is the period in which the investment is made, and n = 1 is the period in which the first cash flows are generated.
 |
(24) |
- STEP 4: Calculation of the DPBP, coinciding with the year in which the difference between the initial cash outflow related to the investment and the Cumulative Discounted Cash Flows becomes a value greater than or equal to zero. If the DPBP is deemed acceptable by the company, then it is possible to proceed with the investment.
Fig. (5) summarizes the operational procedure for calculating the DPBP.
The calculation of cash flows can be much more detailed, but the purpose of the methodology is to remain user-friendly, and so only the most significant cash flows generated are considered.
4. CASE STUDY
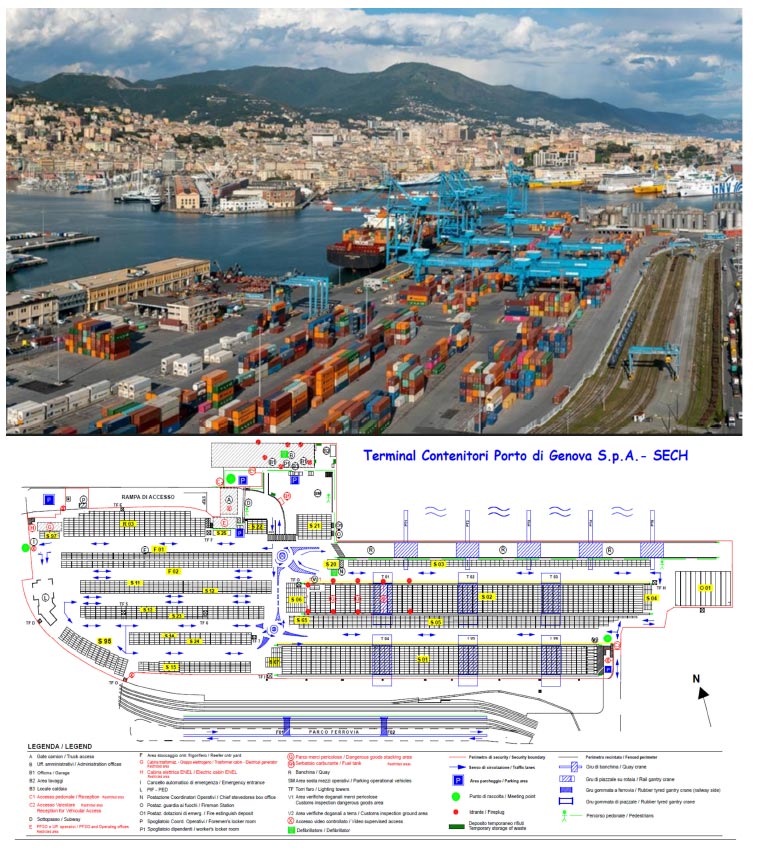
4.1. PSA-SECH in the Italian Port of Genoa
The methodology presented in Section 3 was applied to the yard tractors of the PSA SECH container terminal (Fig. 6), located in the seaport of Genoa (Italy), ranking among the leading Italian import/export terminals [55, 56]. As the terminal invests heavily in sustainability [57], it is an excellent candidate for testing the transition from ICE to electric tractors. Tractors are the most suitable equipment for electrification as they are used only at a local level, on a regular basis, and on similar routes, with scheduled shifts and depots in close proximity. For this case study, the data of the diesel-powered yard tractor models actually used by the terminal were considered: the YT-182, and YT-222 diesel vehicles from Terberg, which provides the YT-202 electric vehicle as an alternative. The characteristics of these EVs are shown in Table 2.
4.2. Technical Analysis
A period of 48 hours from the time of arrival of a ship was considered to size the fleet of yard tractors at PSA-SECH. In this period, the workload is:
- 6 shifts with 3 teams, each with 3/4 tractors for serving ship-to-shore cranes
- 6 teams per week with 3 tractors each for serving trains
- 4 teams per week with 2 tractors each for housekeeping operations (less and less needed thanks to the Terminal Operating System).
Data was collected in six shifts with Nomadic Solution’s ECOGYZER detector. The vehicle’s fuel meter was also used to calibrate the various parameters of the consumption model. The collected data were then cleansed and used to compute energy consumption and to iteratively adjust the model parameters. The main ones of ICE vehicles are shown in Table 3, where reference is also made to the equations needed to compute time-varying parameters.
Once the parameters were finalized, they were used to assess whether BEVs could have fulfilled the same shifts as the ICE vehicles. Deceleration and speed limits for regenerative braking were αhb = -2m/s2 and vub = 19km/h. The main parameters used for EVs are shown in Table 4.
| Battery | ||||
|---|---|---|---|---|
| Type | LMFP Lithium-ion Magnesium Phosphate | |||
| Capacity | 112 kWh | 148 kWh | 174 kWh | 222 kWh |
| Nominal voltage | 614 V | |||
| Charge cycles | 4800 @ 80% DoD – 2800 @ 100% - DoD | |||
| Vehicle | ||||
| Unladen mass | 10 000 kg | |||
| Maximum speed | 35 km/h | |||
| Motor | ||||
| Power | 138 kW @ 2000 – 2500 rpm | |||
| Torque | 750 Nm @ 0 – 1800 rpm | |||
| Parameter | Value | Unit of measure |
|---|---|---|
| m | 27800 | kg |
| V | From ECOGYSER | m/s |
| g* | 9.81 | m/s2 |
| ρ* | 1.225 | kg/m3 |
| Cd* | 0.8 | - |
| Af | 6.5 | m2 |
| Crr | 0.007 | - |
| ηwh* | 0.99 | - |
| ηfd* | 0.98 | - |
| ηgb* | 0.92 | - |
| ηcl* | 0.86 | - |
| ηeng | Eq (5) | - |
|
Eq (1) | W |
| Wacc | 5000 | W |
|
Eqs (2) (3) | W |
|
150000 or 170000 | W |
 |
Eq (4) | kg/s |
| LHVf* | 43500000 | J/kg |
| ρf | 0.835 | kg/l |
| Lf | Eq (6) | l |
| Parameter | Value | Unit of measure |
|---|---|---|
| m | 29200 | kg |
| V | From ECOGYZER | m/s |
| g* | 9.81 | m/s2 |
| ρ* | 1.225 | kg/m3 |
| Cd* | 0.8 | - |
| Af | 6.5 | m2 |
| Crr | 0.007 | - |
| ηwh* | 0.99 | - |
| ηfd* | 0.98 | - |
| ηmot* | 0.88 | - |
| ηbatt* | 0.98 | - |
| (αhb) | -2 | m/s2 |
| (Vlb) | 19 | km/h |
 |
Eq (1) | W |
 |
5000 | W |
 |
Eqs (7) (8) | W |
 |
Eqs (9) (10) | W |
| SOC | Eq (11) | - |
| Ebatt | Error! Reference source not found. | kWh |
| Shift | ICE vehicle-specific consumption (kWh/km) | Electric vehicle-specific consumption (kWh/km) |
|---|---|---|
| 1 | 3.12 | 2.79 |
| 2 | 3.58 | 2.44 |
| 3 | 3.10 | 2.11 |
| 4 | 3.08 | 2.26 |
| 5 | 2.73 | 2.38 |
| 6 | 2.73 | 2.55 |
For each shift, specific consumption values were calculated for the two types of vehicles, as shown in Table 5.
To seize the fleet, the total machine time for the 48-hour period is Ttot = 476,6 h, i.e., 10 vehicles run simultaneously every hour in the yard. The hypothesis here is to equally divide the workload throughout 48 hours. The working hours for each vehicle are shown in Table 6.
Slow charging at 7.4 kW, quick charging at 20 kW, fast charging at 100 kW, superfast charging at 350 kW, and combinations thereof were chosen to calculate the charging times.
Table 7 summarizes the charging modes defined for this case study.
The results of eq (15) for the analyzed cases are shown in Fig. (7).
| Scenario | Present | 2027 | 2035 | 2050 | ||||||||||||||||
|---|---|---|---|---|---|---|---|---|---|---|---|---|---|---|---|---|---|---|---|---|
| Battery Capacity (kWh) | 112 | 148 | 174 | 222 | 128 | 169 | 199 | 254 | 150 | 199 | 234 | 298 | 218 | 288 | 338 | 431 | ||||
| kWh/h discharged | 14.43 | 13.56 | 13.12 | 12.55 | ||||||||||||||||
| Tot working hours (h) | 7.8 | 10.3 | 12.1 | 15.4 | 9.4 | 12.5 | 14.7 | 18.7 | 11.4 | 15.2 | 17.8 | 22.7 | 17.4 | 22.9 | 26.9 | 34.3 | ||||
| Charging modes | ID | Scenario | Charging modes included |
|---|---|---|---|
| Slow | 1 | Mode 1 | 1 |
| Quick | 2 | Mode 2 | 2 |
| Fast | 3 | Mode 3 | 3 |
| Ultra-fast | 4 | Mode 4 | 4 |
| Mode 5 | 1+2 | ||
| Mode 6 | 1+3 | ||
| Mode 7 | 1+4 | ||
| Mode 8 | 1+2+3 | ||
| Mode 9 | 1+2+4 | ||
| Mode 10 | 1+3+4 | ||
| Mode 11 | 2+3 | ||
| Mode 12 | 2+4 | ||
| Mode 13 | 2+3+4 | ||
| Mode 14 | 3+4 | ||
| Mode 15 | 1+2+3+4 | ||
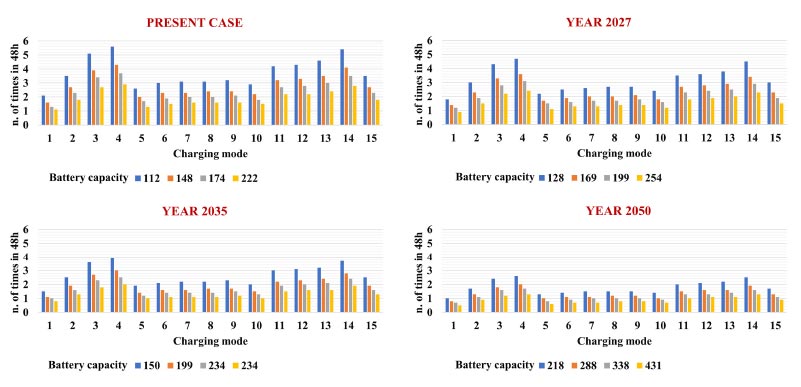
The faster the charging process, the lower the number of vehicles needed. The sensitivity to battery capacity, instead, is not so relevant. Mixing charging modes can improve the pwork with respect to slower modes, but the most time-efficient is Mode 4, however, it is the most expensive. It allows for just one vehicle more than the ones used in the yard at the same time. Instead, Mode 1 requires tripling the fleet to satisfy the demand.
4.3. Economic-financial Analysis
Given that the sensitivity of battery capacity was small, for each year considered in the analysis, only the data relating to the third battery capacity of the four evaluated were considered in the economic-financial analysis (Fig. 8). This allows completing two consecutive shifts on a single charge even in the worst-case scenario.
4.3.1. Charging Cost Calculation and Analysis
Initially, the charging costs were computed and compared with the costs of refueling ICE vehicles to determine the potential savings (Section 3.2.1).
In Italy, the purchase price of diesel must be deducted from excise taxes, which by law are not applied to terminals if the fuel is used for self-traction purposes. For the calculation of electric charging costs, reference is made to Section 3.2.1. Energy prices are referred to from September 2022 and kept constant over time (Table 8).
| Charging/refuelling | Price |
|---|---|
| Ordinary (or slow) charging | 0.3 [€/kWh] |
| Quick charging | 0.54 [€/kWh] |
| Fast charging | 0.69 [€/kWh] |
| Ultra-fast charging | 0.8 [€/kWh] |
| Diesel | 1425.72 [€/1000 l] |
To calculate the total costs related to consumption, it was estimated that each vehicle travels during its life in a range of km (30,000-530,000 km).
Since the value of fuel consumption cost for ICE vehicles does not change over the years, Ctot (eq 21) is a constant value in all scenarios considered. In the case of BEVs, the specific consumption varies depending on the year considered (Section 3.1.3 and Table 1). Therefore, the total cost related to consumption (eq 22) potentially differs depending on the year but also on the scenario that includes different types of charging with different prices (Tables 7 and 8).
4.3.2. Investment Payback Period Analysis
In order to calculate the DPBP, the amount of the initial investment (year 0) and the annual cash flows resulting from the investment (years 1-N) are calculated (Section 3.2).
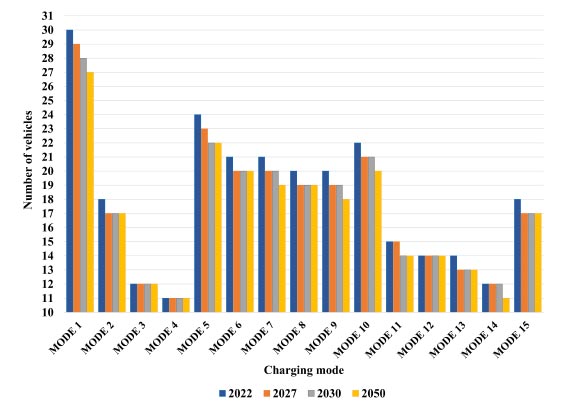
- Net investment.
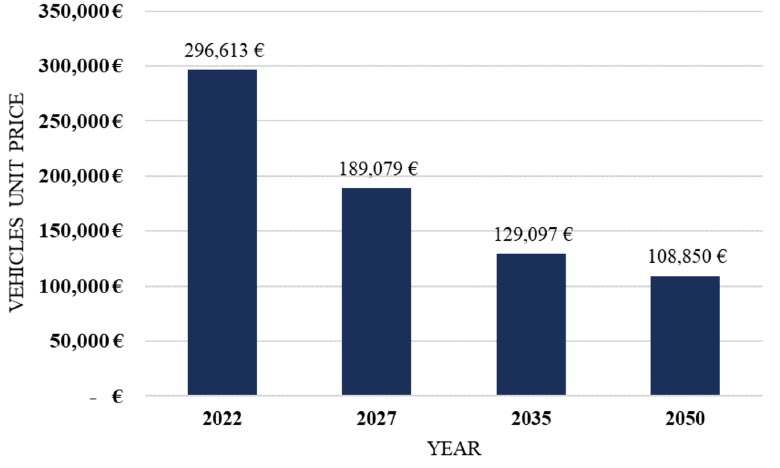
Currently, the terminal owns 23 ICE vehicles and intends to replace them completely with BEVs. The terminal could sell all current vehicles at a unit price of 20,000 € for a total of 460,000€. The purchase price of the new vehicles varies, as shown in Fig. (9). The values proposed by a study [47] considered both fast and slow development of the technology, and here, the average values between the two were considered. The resulting prices were in line with those proposed by PSA-Sech suppliers for the current year.
Fig. (10) shows that the net investment depends on the scenario.
Table 7, in which a variable number of BEVs are purchased Fig. (10).
(1) The annual cash flows (CFn) - Section 4.3.1
The annual maintenance costs of ICE vehicles for the terminal are, on average, €3,000 per vehicle. For BEVs, this cost is estimated by the maintenance personnel at PSA-SECH at €1,200 per vehicle. Again, the total annual maintenance cost varies depending on the number of vehicles purchased under the scenario considered Fig. (8). Once the total maintenance costs for ICE and BEV vehicles have been calculated, the total annual savings can be determined.
(1) Discounted cash flows (DCFn) - Section 3.2.2
Assuming constant cash flows throughout the considered time horizon, DCFNS are calculated. The values of WACC = 5% and i = 0.5% are the ones used by the terminal.
(1) Discounted Payback Period (DPBP)
It is now possible to determine the DPBP for the 60 scenarios considered.
4.3.3. Results
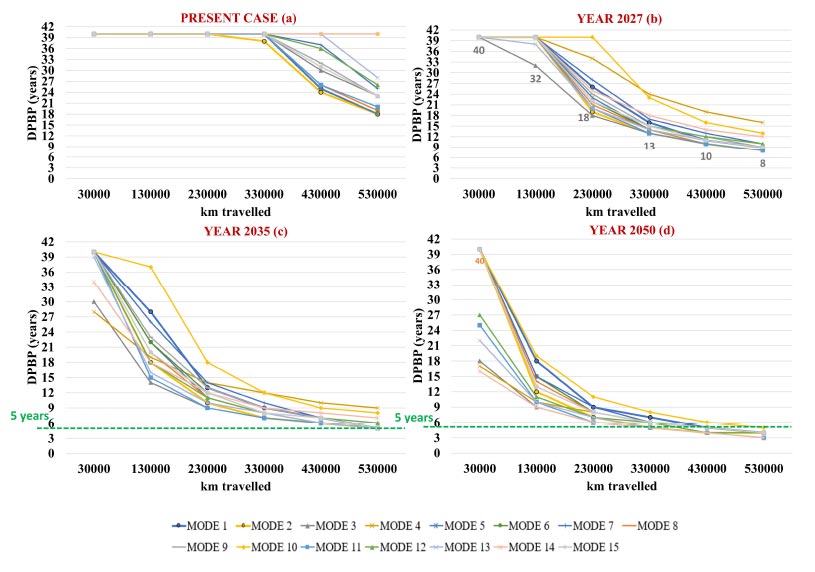
This section reports the results of the economic-financial analyses. For each year considered (Present-2027-2035-2050), the graphs present the trends of the 15 scenarios analyzed (from Mode 1 to Mode 15). Here, the values of DPBP above 40 years were neglected. In particular, the terminal considers a 5-year DPBP value as an upper bound for the economic feasibility of the investment based on internal considerations, including tax benefits. This bound is marked in the graph with a green dashed line. Considering environmental factors, DPBPs lower than 15 years old were also deemed acceptable to draw more general considerations. This value is due to the lifetime of BEVs, which is assumed to be comparable to that of conventional vehicles. The EU and institutions are heavily pushing the topic of reducing emissions in the transport sector, and the adoption of local zero-emission vehicles will prove increasingly attractive and cost-effective because of supporting regulations and incentives.
For the present scenario Fig. (11a), the investment is never acceptable in terms of DPBP. A gradual decrease in the purchase price of EVs is expected in the future, resulting in a more favorable payback period. Moreover, the improvement in technology is expected to allow the purchase of fewer vehicles. For 2027 (Error! Reference source not found 11b), the DPBP of the investment decreases more rapidly than in the present. However, when considering terminal-specific indications, no economically acceptable scenarios are reported. Instead, considering the environmental considerations mentioned above, the investment might become acceptable for distances travelled greater than 330,000 km. Conditions are expected to improve further by 2035 (Error! Reference source not found 11c). Mode 3 appears to be one of the most convenient in terms of payback time for the terminal when the distances traveled reach 530,000 km. In 2035, many scenarios allow for DPBP values of less than 15 years and are, thus, potentially feasible if the EU decides to promote the adoption of BEVs in freight transport with incentives or other tools. For the year 2050 (Error! Reference source not found 11d), all scenarios are acceptable for the terminal when the distances traveled reach 430,000 km. In addition, acceptable scenarios are also shown with distances traveled equal to 330,000 km, which is the case for Modes 2, 3, 11, 13, and 14. In particular, Mode 3 and Mode 14 (12 and 11 BEVs respectively) provide very short payback times, ranging from 16 years at a low workload to a minimum of only 3 years.
Unit price of BEV in the years considered in the investment.
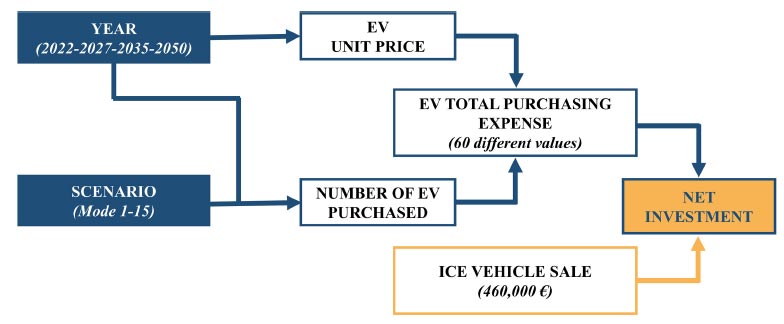
Operational procedures for calculating the net investment.
5. RESULT AND DISCUSSION
5.1. Discussion of the Results
From a technical point of view, the use of electric tractors for handling containers in ports is recommendable. The operation of the tractors benefits greatly from regenerative braking, besides the higher efficiency of electric motors. In fact, the shifts performed consist of travelling at moderate speeds, with a predominant role of a jerk in driving dynamics. Normally, ICEs operate at maximum efficiency in a narrow range of loads and speeds, therefore, the engines of these tractors do not usually operate in their optimal range. The electric motor, on the other hand, responds well to transients and electrodynamic braking adds the advantage of reduced brake pad consumption with consequent particulate matter. The real critical shortcoming of the BEVs remains the battery, whose energy density is far below that of oil-derived fuels and whose recharging time is a reason for overestimating the minimum fleet compared to that required for diesel vehicles. The minimum number of vehicles is achieved through the use of ultra-fast charging. In this case, as less than one hour is required for recharging, only one additional vehicle has to be purchased in addition to those scheduled simultaneously at the terminal. It will be necessary to plan their use in such a way that the charging of these vehicles is distributed over time and that they do not discharge all at the same time. For slow charging mode, three times the number of vehicles is needed; hence, the capital investment becomes heavier. Moreover, the vehicle depot area would be larger than the one needed for ICE vehicles. Intermediate solutions or combinations thereof may represent a trade-off between the minimum number of vehicles and the operational costs of charging.
In the case study examined, the PSA Sech terminal considers DPBP values less than or equal to 5 years as acceptable due to internal considerations, also related to tax benefits. To date, the purchase of BEVs is not economically viable. The investment could become feasible in 2035 only if a sufficient workload can be guaranteed to exploit the benefits associated with the savings on recharging costs. However, environmental subsidies from the EU could make the adoption of BEVs more advantageous. In particular, they could become part of the equation for the purchase of BEVs in seaports, lowering the amount of the initial investment. Furthermore, it is plausible that in the near future, the 'polluter pay' policy mentioned in the White Paper of Transport [8] could come into force. In this case, the adoption of electric yard tractors that produce zero local emissions would result in annual savings and hence positive annual cash flow, which in turn would decrease the calculated DPBPs, making the investment feasible in more cases than those highlighted in Section 4. For the aforementioned reasons, DPBPs less than or equal to 15 years (estimated service life of an electric tractor comparable with that of a conventional yard tractor in the PSA SECH terminal) were also analyzed in Section 4 to show, in general terms, which scenarios are most economically viable. Alternative solutions to EVs include:
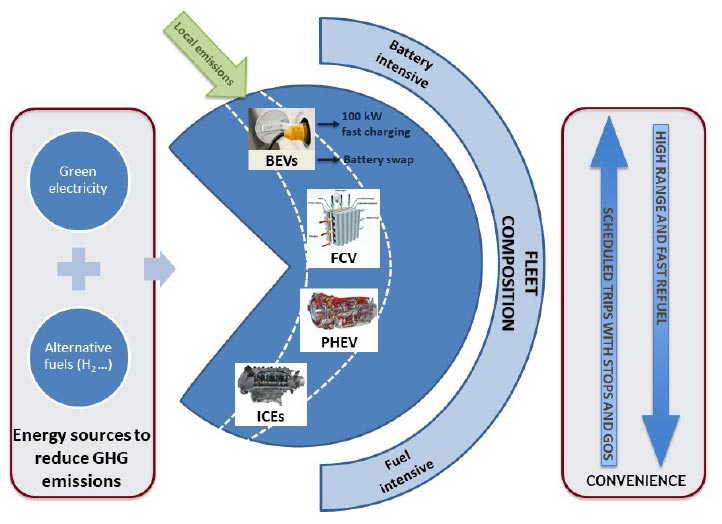
• Vehicles equipped with hybrid powertrains, using alternative fuels to exploit the refueling rapidity of the ICE, work at maximum efficiency as a generator for an electric motor. This reduces the size of the batteries and, consequently, the price of the vehicle, keeping the size of the fleet the same as today, at the expense of a share of GHG and local pollution emissions (in most cases compensated during the production of the fuel itself). A further option is using hydrogen as a fuel for ICE, which would approximately be zero local emissions but is currently not cost-effective unless it is produced locally from renewables
• Battery swap between vehicles, where battery packs are recharged while the vehicle is running and changed as needed. There would also be the possibility of Vehicle-To-Grid (V2G) connections to mitigate the power peak required at the distributor. Numerous works (e.g., [58] showed that the possibility of V2G connections increases battery ageing, and its cost-effectiveness has also been investigated [59]
• Fuel-cell vehicles are locally free of polluting emissions and have reduced recharging time compared to batteries, although higher than diesel vehicles. This solution also has its limitations, mainly arising from the cost of hydrogen and the weight of the tank.
The above information has been described as illustrated in Fig. (12), which provides an overview of the different alternatives proposed.
5.2. Uncertainties
From a technical point of view, it is not sufficient to consider only the energy consumption and the cost of the vehicles; the charging infrastructure must also be taken into account. The installation of slow charging stations does not require any adaptation to the electrical system, whereas the situation is different for fast or ultra-fast charging stations. Therefore, before choosing higher powers, it is necessary to ascertain the condition of the terminal's electrical system, the presence of a medium-voltage substation in the vicinity, and, in general, to provide a comprehensive feasibility study considering the maximum level of power that can be absorbed. Based on these technical considerations, it is possible to choose the charging mode - in Italy according to the CEI 0-16 standard - and to assess the actual cost of the installation.
From the economic analysis, it is clear that a large number of factors must be considered for an eventual investment. Increasing the distance travelled by vehicles allows for an increasing economic advantage, mainly related to savings on consumption. Moreover, in this case, the costs of purchasing and installing the charging infrastructure are part of the cost of charging itself. If the economic analysis were to include the fixed costs related to this infrastructure, the DPBP could change substantially and have a greater impact on investment decisions, especially when modes other than slow charging are envisaged.
Even the forecast for the cost of electricity between now and 2050 is rather complex. Indeed, one would have to consider what the energy mix and inflation might be. Therefore, the considerations made in this paper were performed by keeping energy costs fixed over time.
In the future, economic benefits are expected to increase due to several factors, mainly the decrease in the purchase price of BEVs. To date, the high purchase cost of an electric vehicle is linked to the high price of batteries, which accounts for about 30% of the final vehicle price [47]. Furthermore, battery packs for heavy vehicles are priced higher than those for passenger cars (310 €/kWh versus 135 €/kWh) because they have to meet higher standards. The fall in prices, combined with the increase in battery capacity, will make the choice of BEVs more advantageous, with all the economic and environmental benefits that this entails. In fact, the increase in battery performance allows fewer vehicles to be purchased.
CONCLUSION
Electrification of handling equipment and vehicles used in seaports is becoming increasingly common. This brings benefits in local environmental terms because ports are often located within densely populated urban areas. Diesel yard tractors are widely used, causing high local emissions. The management of terminal operations makes vehicle electrification theoretically feasible, as vehicles travel short distances and similar routes at low speeds. However, the electrification of yard tractors may not be practically cost-effective. The present paper provides a methodology for evaluating the electrification of port handling equipment that can be applied and scaled in any terminal, combining technological and economic financial evaluations. The validity of the methodology was tested through the case study of PSA SECH (Genoa, Italy). Useful insights emerging from the results obtained include:
- Currently, it is not economically feasible to invest in the electrification of yard tractors with a return on investment in a relatively short time
- Future regulations and subsidies could make the switch to BEVs more cost-effective
- Future scenarios foresee a significant improvement in electrical technology and a decrease in the purchase prices of BEVs, possibly favoring their adoption from the economic viewpoint
- Terminals with higher workloads have more economic advantages with BEVs
- With certain combinations of battery capacity and charging modes, it is possible to maintain the size of the fleet at a minimum level
- Investment in the installation of recharging stations should also be considered: this is highly dependent on the initial conditions of a terminal's electrical system. Limitations may apply to the power that can be absorbed at certain times of the day, depending on the contract with the energy distributor; this could prevent or inhibit the use of fast or ultra-fast charging freely during the day;
- If sustainability is investigated from a broader perspective, converting the fleet to BEV may not be the best solution. There are alternatives that can reduce emissions both locally and globally (green hydrogen as fuel or other innovative fuels for hybrid powertrains) that only rely on the use of small batteries. In fact, the production of the batteries themselves and the extraction of the necessary raw materials nowadays result in low overall sustainability for these components.
The proposed tool is a starting point to fill the gap in the literature regarding the technical-energetic and economic financial feasibility of electrifying yard tractors. It provides a guide for decision-makers to discern the viability of the ongoing trend toward sustainable alternatives in port handling equipment, such as the use of electric vehicles. In the future, the methodology could be extended to other vehicle types, e.g., vehicles equipped with hybrid powertrains or fuel cells. In these cases, in addition to economic considerations, sustainability could be evaluated over the entire life cycle of the seaport yard tractors.

