All published articles of this journal are available on ScienceDirect.

A Clustering Analysis of Lebanese Adaptive Driving Behaviors in Response to Road Complexity
Abstract
Aims
This study aims to investigate adaptive driving behaviors in response to road complexity in Lebanon, emphasizing how multifaceted factors influence these adaptations.
Background
Lebanon faces major road safety challenges due to its deteriorating infrastructure and diverse socio-economic conditions. Addressing these issues, the research examines the interaction between infrastructure, vehicle conditions, and road user adaptation, with the objective of informing more effective safety strategies.
Objective
This study aims to explore adaptive driving behaviors among Lebanese drivers across different environmental complexities and the influence of demographic and socio-economic factors on these behaviors.
Methods
Through a comprehensive survey among a representative sample, drivers were segmented into three clusters using the K-Prototypes algorithm to assess self-reported driving speeds, the impact of road elements on behavior, and the role of various factors on driving patterns.
Results
The Clustering analysis identified three distinct groups, each exhibiting unique adaptive driving behaviors: Cluster 1 consists of mature, conservative drivers; Cluster 2 includes predominantly young, cautious female drivers; and Cluster 3 comprises younger male drivers with riskier behaviors. These findings illustrate significant behavioral variations and highlight the influence of demographic profiles on driving behavior.
Conclusion
The research underscores the necessity of a nuanced road safety strategy that acknowledges the diverse adaptive behaviors of Lebanese drivers. It recommends specific policy adjustments, such as differentiated speed limits and targeted educational programs, to cater to the distinct needs of each driver cluster. Further research is suggested to continuously refine and customize road safety measures, accommodating the complex driving environment in Lebanon.
1. INTRODUCTION
1.1. Context and Background
Road safety in Lebanon embodies a complex array of challenges and developments, shaped by decades of political and social turbulence. Recurrent crises, from the civil war to the recent economic crisis, have left deep imprints on the infrastructure and driving behavior, resulting in an almost episodic management of road safety [1]. Alarming statistics illustrate this irregular situation. According to a 2021 estimate by the WHO, Lebanon experienced approximately 544 annual fatalities on its roads, a heavy toll for a population of less than 5.6 million [2-4]. Given these challenges, the complexity of the traffic safety environment in Lebanon appears to be multifaceted. It encompasses not only deteriorating infrastructure and lax enforcement of traffic laws but also poor driver awareness and training [5-7]. The situation is further aggravated by the rapid increase in the number of vehicles, which exceeds the capacity of existing infrastructure.
This complexity is exacerbated by a challenging financial situation, negatively influencing investment in road maintenance, and limiting the implementation of effective accident prevention strategies [8]. Considering the complexity outlined, it is imperative to explore how various factors affect Lebanese drivers' behavior and adaptability to a changing road environment, emphasizing the necessity for in-depth studies to decipher these driver-specific adaptation mechanisms. This is crucial for guiding strategic interventions aimed at enhancing road safety in Lebanon, taking into account local cultural and behavioral nuances.
1.2. Understanding the Dynamics of Driver Behavior
Three key components must be identified in order to understand driver behavior according to the theory of planned behavior [9, 10] including attitude toward behavior, subjective norm, and perceived behavioral control. This theory proposes that an individual's behavioral intention, the immediate determinant of behavior, is influenced by these three factors. For instance, each driver may develop a planned driving behavior, strongly influenced by his or her personality and personal characteristics, particularly under stable and predictable traffic conditions [11]. The theory underlines the importance of planning and intentionality in driving decisions, which is crucial for understanding and categorizing driver behavior [12]. However, taking cognitive and attentional capacities into account, as Wickens' model emphasizes [13], is essential to perfecting our understanding of driver behavior beyond intentions and planning alone. Enriching this perspective, Wickens' model explains the impact of perception, memory, and information processing capacity on real-time behavior, underlining the need for active information management in a constantly changing road environment [14]. Crucially, each individual has a threshold of cognitive capacity below which he or she can maintain safe behavior and manage environmental constraints. The relevance of this notion intensifies with the growing complexity of the road environment, where exceeding the threshold of cognitive ability increases the risk of accidents [15]. This situation highlights the importance of understanding and adapting these capacities. Complementing the models previously discussed, Wilde's risk homeostasis theory [16] provides an additional perspective on driving. This approach suggests that drivers actively regulate risk to a level they consider appropriate rather than seeking to systematically reduce it [17]. In this dynamic, they adapt their behavior in response to various road conditions to maintain a risk balance aligned with their comfort zone [18]. This theory is particularly enlightening in complex or unforeseen situations that make intensive demands on cognitive and attentional resources, sometimes exceeding the driver's capabilities. It also emphasizes how drivers can modify their plans and remain flexible when faced with unforeseen circumstances, emphasizing how they respond and reassess their choices [19]. These theories provide an understanding of the complex dynamics of driving behavior by combining cognitive capacity, real-time adaptation, and planning in constantly changing road environments.
1.3. The Complexity of Road Driving Environment
The impact of the environmental context on driver behavior is undeniable. Different road environments have different levels of complexity, which places different demands on drivers' capacity and affects how they perceive and interact with the road. Understanding this complexity is crucial to comprehending how it shapes driving behavior, underlining the importance of the interaction between the driver and the road environment. Fastenmeier [20] conducted a groundbreaking study in this area that highlighted two essential dimensions— information processing and vehicle handling—that influence the complexity of the road environment. These needs change depending on the environment. In his study, he shows that dense urban environments are characterized by a double requirement: a high level of information processing and sophisticated vehicle handling. These environments are characterized by a multitude of road signs, busy intersections, a variety of road users, and an abundance of visual and auditory stimuli. This density of stimuli demands drivers' sustained attention and the ability to assimilate a variety of information quickly. Simultaneously, handling the vehicle in these situations necessitates frequent and accurate maneuvers, like sudden stops, sharp turns, and speed adjustments. These requirements, both in terms of information processing and vehicle handling, make urban areas particularly complex driving environments. Freeway driving, on the other hand, is considered an example of a simple environment that encourages smoother driving and less active driver intervention. Further research highlights various factors contributing to the complexity of the road environment, such as road user diversity, traffic density, urbanization, and infrastructure design. The diversity of road users adds a significant amount of unpredictability, increasing the complexity of navigation and requiring drivers to be extra vigilant and able to anticipate unexpected behavior. Researchers such as Boelhouwer et al. [21] and Pikaar et al. [22] highlight how this diversity increases perceived complexity, illustrating the importance of constant adaptation and flexibility in managing road complexity. Furthermore, traffic density has been shown to directly increase drivers' cognitive burden in studies by Brookhuis et al. [23] and De Waard [24]. Driving in dense traffic conditions requires greater cognitive effort, which can increase the risk of errors and, consequently, collisions. The experience of Radlmayr et al. [25] demonstrates that driving quality is negatively impacted by traffic density, especially on freeways. The influence of urbanization on users' perception and management of driving is also crucial. In comparison to rural areas, where driving is perceived as less demanding in terms of information processing, densely populated urban environments are considered more complex due to the increased mental load they impose. Complex urban surroundings, with their multitude of visual objects, including buildings, billboards, and other infrastructure, can divert drivers' attention and make driving more challenging, as demonstrated by Horberry et al. [26]. Finally, the design of road infrastructure, according to Pikaar et al. [22], is a determining factor in the complexity of the road environment. The difference between a clearly delineated one-way road and a two-way road with no physical separation is notable, with the latter imposing greater complexity and mental load. Physical separation between lanes can significantly reduce this complexity and increase safety. In response to these complexities, drivers adopt a variety of strategies to maintain safe driving, such as increasing concentration and adjusting speed. Road managers, for their part, can intervene by improving signage and designing infrastructures that reduce conflicting interactions between different road users. The Lebanese context underlines the importance of these actions in light of the country's poor infrastructure and diversity of driving behaviors. Recognizing and effectively addressing this complexity is crucial to improving road safety, illustrating the multidimensional impact of the road environment on driving performance [27].
1.4. The Proposed Model
This research aims to understand how complexity affects individuals' behavioral adaptation. According to various previous studies [28-30], complexity is conceptualized as a multidimensional notion. It is characterized by the uncertainty generated by the interaction and combination of multiple elements or components related to an activity, such as driving. This complexity manifests itself in a diversity of connections, simultaneous interactions, or causal relationships between entities and individuals, as well as between different behaviors, making their final effects unpredictable and difficult to interpret. Fig. (1) illustrates our proposed theoretical model, highlighting two key dimensions of complexity including, (A) Environmental Complexity (Objective): This dimension refers to the physical and tangible characteristics of the environment, including but not limited to environmental hazards and infrastructure. It encapsulates the external aspects of the environment likely to influence an individual's behavior. (B) Individual Complexity (Subjective Perception): This dimension reflects the way in which an individual interprets the characteristics of environmental complexity. It raises the question of how different people's subjective perceptions vary when they are exposed to similar environmental elements, such as road configuration. This perceptual heterogeneity highlights the crucial role of each individual's driving abilities and attentional, cognitive, technical, and physiological resources in interpreting environmental complexity, underlining the existence of salient dimensions from one individual to another. The model relies on a “comparator” mechanism, which analyzes and synthesizes information from the two complexity dimensions to generate an adaptive behavior to the initial situation. This process leads to a reevaluation and modification of the perception of environmental complexity, thus facilitating behavioral adaptation. This dynamic feedback loop enables continuous updating and transformation of the individual's perception of objective complexity.
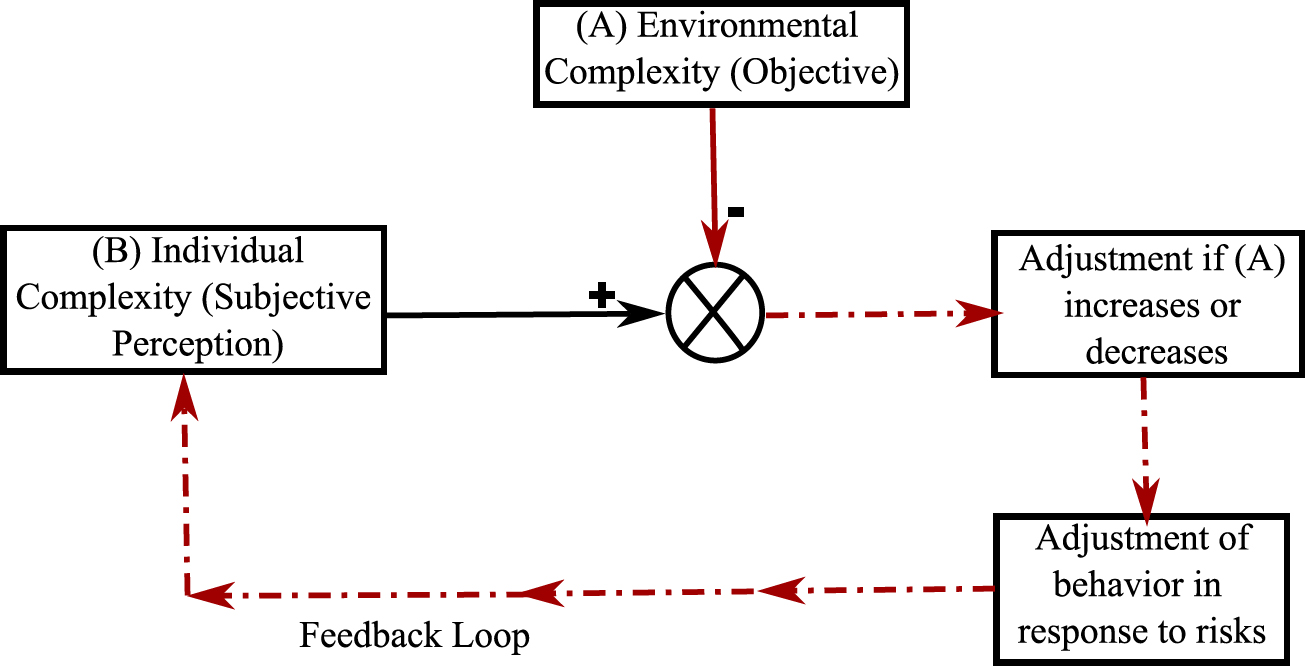
Proposed theoretical model of behavioral response to complexity.
The model can be represented by the equation below:
 |
(1) |
where ΔOC represents any variation in objective complexity, generating a corresponding change in individual behavior ΔBi, via an individual transformation function fi. This process shows how different people can interpret the same element of objective complexity in different ways, leading to a diversity of adaptive behaviors. The fi function reflects the comparator's role in adjusting each individual's perceived level of complexity.
To put our model into practice, we developed a detailed survey, including a variety of images of road configurations in Lebanon, representing different levels of objective environmental complexity. The dimension of individual complexity is addressed through questions on self-reported speed behavior and socio-cultural aspects in order to assess drivers' subjective perceptions. This approach seeks to quantify their behavioral adaptation.
2. MATERIALS AND METHODS
2.1. Demographics
Our study sample consists of 461 students and staff members of the Saint Joseph University of Beirut (USJ), with a distribution of 235 females (51%) and 226 males (49%), all holders of a Lebanese driving license. Ages varied from 18 to 80, with an average of 33.4 and a median of 30, while the most frequent age was 18, indicating a high presence of youth. Of the participants, 59% are single. Financially, 46% are experiencing difficulties, 44.7% have moderate financial security, and 9.3% enjoy good financial security. Geographically, 61.4% of participants are from Mount-Lebanon and 26% from Beirut, with a Christian majority of 63.3%, probably reflecting the University's religious composition.
2.2. Survey Design
In line with the objectives set forth in the study, the survey was designed to analyze the complex interplay between road configuration, driving behavior, and demographic and socio-cultural factors. It was structured into three main sections, each designed to examine different aspects of driving behavior.
2.2.1. Section 1 – Exploring Road Complexity and Self-reported Driving Behavior
The primary purpose of this section was to examine the correlation between road complexity and self-reported driving speeds. To this end, ten images representing various Lebanese roads were previously selected and analyzed according to the criteria established in previous studies [31-35]. These images were then presented to experts to validate a complexity scale ranging from 1 (least complex) to 5 (most complex). Following this process, five images, each illustrating a distinct level of complexity and having reached a consensus among the experts, were selected for the survey. It should be noted that participants were not informed of the objectively determined levels of complexity. They were simply asked to observe the images and estimate the speed (in km/h) at which they would consider driving in the scenarios depicted. The images were presented to the participants as follows:
2.2.1.1. Image A – Level 4 Complexity
This image illustrates the challenge of navigating a bustling urban intersection without road signs, reflecting the complexity of movement among vehicles and pedestrians.
2.2.1.2. Image B – Level 5 Complexity
This image illustrates the disorder and demands of rural road navigation, where a complex scene featuring children on the road, parked vehicles, buildings close to the roadside, an absence of sidewalks, and a lack of signage requires heightened attention and skill.
2.2.1.3. Image C – Level 1 Complexity
This image illustrates the tranquility of an open, two-lane highway with minimal distractions, offering a straightforward driving experience.
2.2.1.4. Image D – Level 3 Complexity
This image depicts the moderate challenges of navigating residential roads in an urban environment characterized by a divided road, unmarked lanes, and pedestrians.
2.2.1.5. Image E – Level 2 Complexity
This image presents a mountain road located outside built-up areas. Despite its simplicity and lack of markings or sidewalks, it still requires caution due to warning signs and the presence of natural surroundings.
This resulted in the creation of five numerical variables (A-S, B-S, C-S, D-S, E-S) for Self-Reported Driving Speed, each corresponding to one of the five images. Table 1 will display these images along with their respective degrees of complexity.
Table 1.
| Scenario | Level of Complexity |
|---|---|
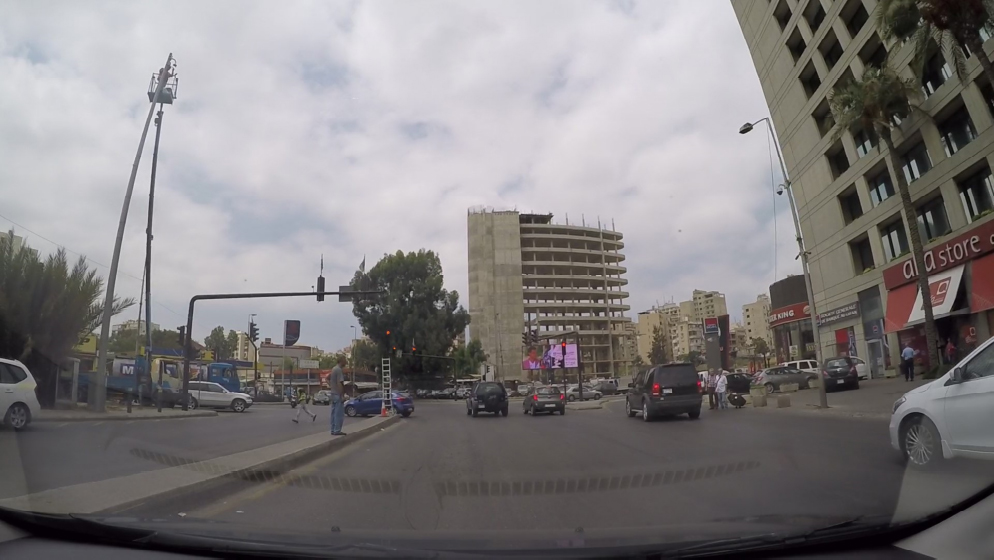 Image A Image A |
Level 4 – Quite Complex |
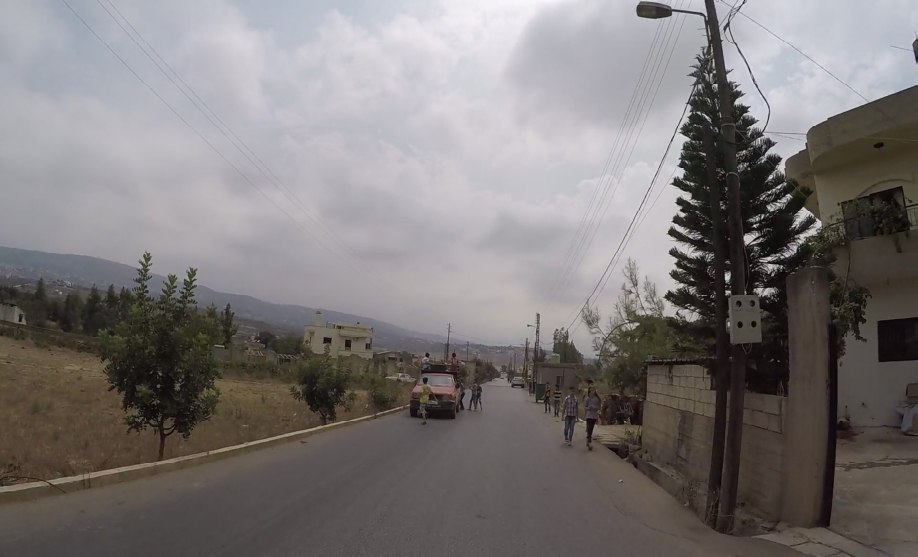 Image B Image B |
Level 5 – Highly Complex |
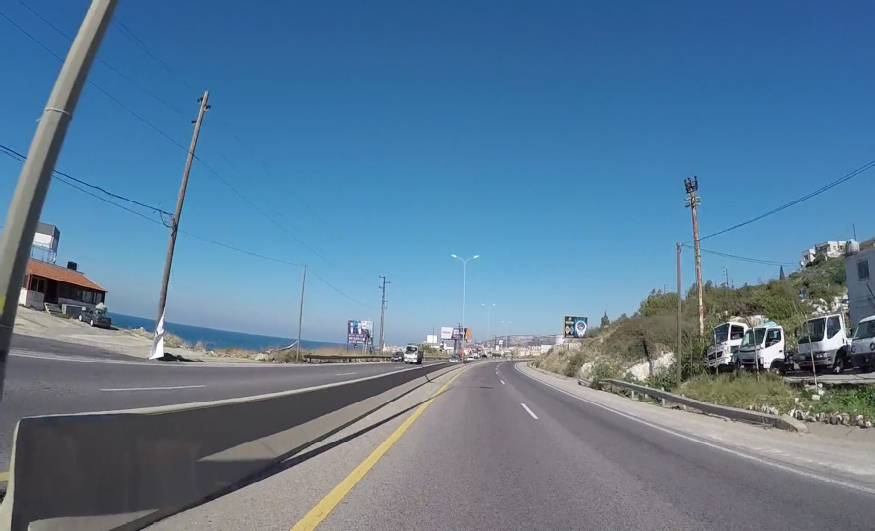 Image C Image C |
Level 1 – Very Simple |
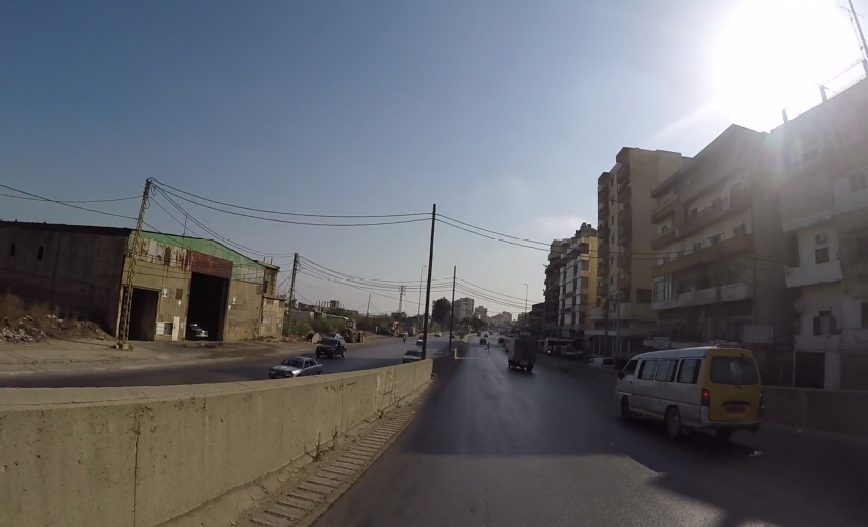 Image D Image D |
Level 3 – Moderate Complexity |
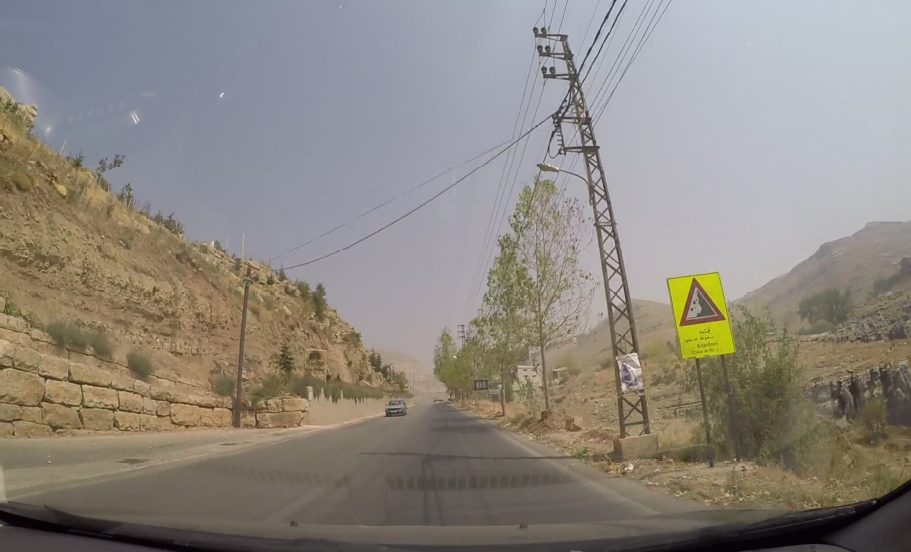 Image E Image E |
Level 2 – Moderately Simple |
2.2.2. Section 2 – Effect of Single Elements on Driving Behavior
This section aims to analyze the effect of specific road elements on variations in driving behavior and to comprehend how individuals perceive these variations. Four sets of driving situations were utilized, each containing two images that differed in complexity due to a single element. Participants were not informed about which image in each set was more complex. Instead, they were shown the images and asked to estimate the speed (in km/h) at which they would consider driving in the scenarios depicted. The sets were presented as follows:
o Set I8 – Comparison between low and high traffic density.
o Set I9 – Contrast between a straight road and the one with a sharp bend.
o Set I10 – Comparison of high and low levels of urbanization.
o Set I11 – Contrast between roads with and without a dividing median.
This resulted in the creation of eight numerical variables, representing two distinct Self-Reported Driving Speeds for each of the four batches (I8-A-S, I8-B-S; I9-A-S, I9-B-S; I10-A-S, I10-B-S; I11-A-S, I11-B-S). Table 2 displays these sets along with the respective complexity of each image within the set.
2.2.3. Section 3 – Influence of Multifaceted Influences on Driving Patterns
This section aims to assess the effect of multifaceted influences, including demographics, driving experience, vehicle characteristics, and psychological factors, on driving behavior and to understand how these influences shape driving patterns.
Several categories were utilized, each containing variables that offer insights into different aspects of the driver's background and behavior. Participants were evaluated through specific questions related to these categories, providing both categorical and numerical data to form a comprehensive picture of the influences on driving behavior. Some composite variables were introduced in order to enhance the analytical framework of this study. Table 3 displays a comprehensive list of all these variables.
By utilizing the insights from all three sections, the research seeks to investigate discrepancies in a driver's behavior across different levels of overall road complexity, variations in response to specific road elements, and the broader influences shaping driving patterns.
2.3. Clustering Analysis Approach
The process of clustering is a pivotal step in data analysis, particularly in the realm of unsupervised learning. It involves the partitioning of a dataset into subsets, so that data points in the same subset are more similar to each other than to those in other subsets. The objective is to segregate groups with similar traits and assign them into clusters.
| Set I8 |
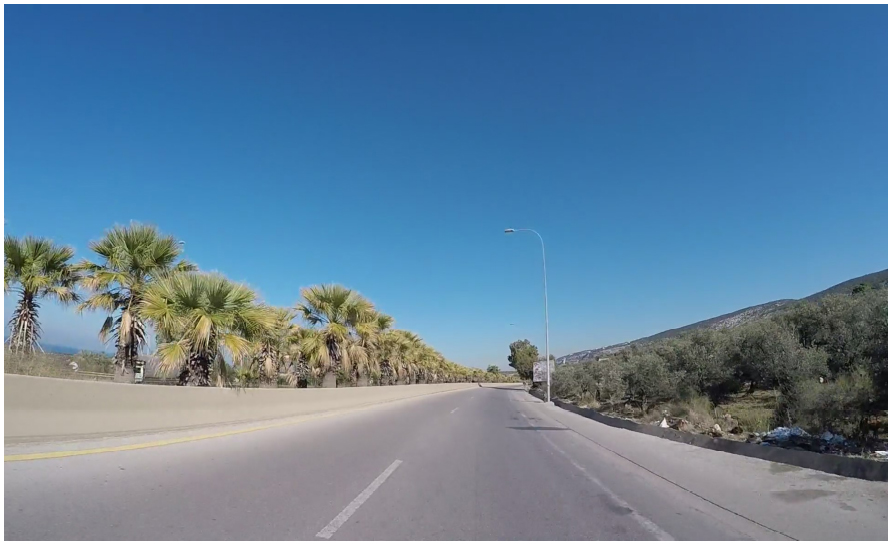 Image I8-A Simple Image I8-A Simple |
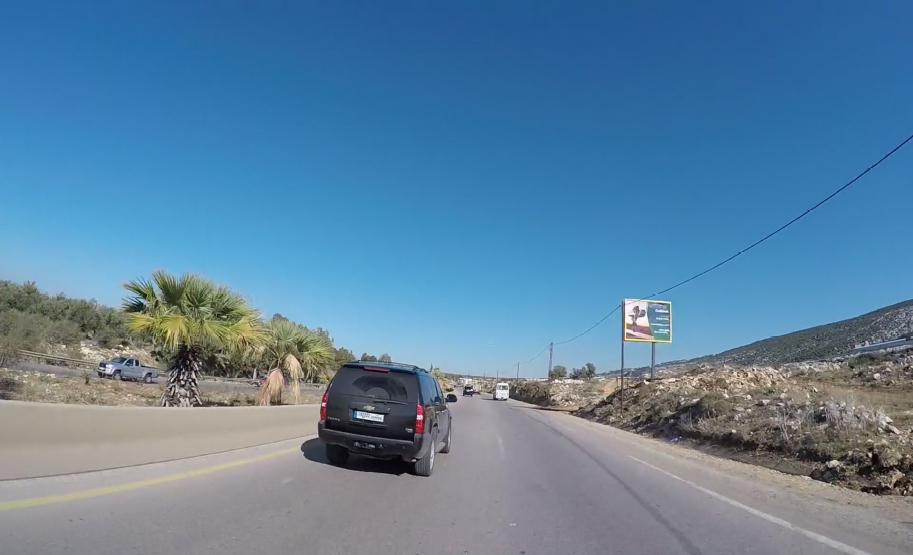 Image I8-B Complex Image I8-B Complex |
| Set I9 |
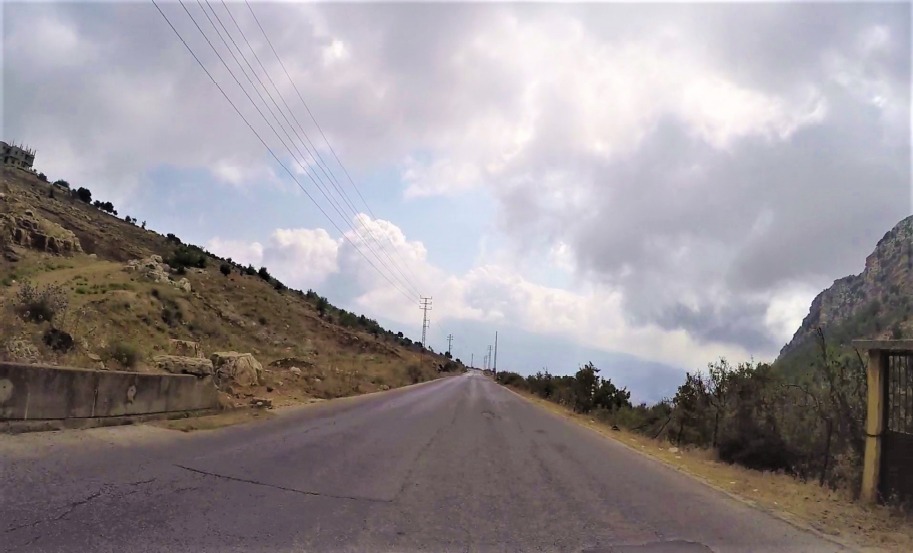 Image I9-A Simple Image I9-A Simple |
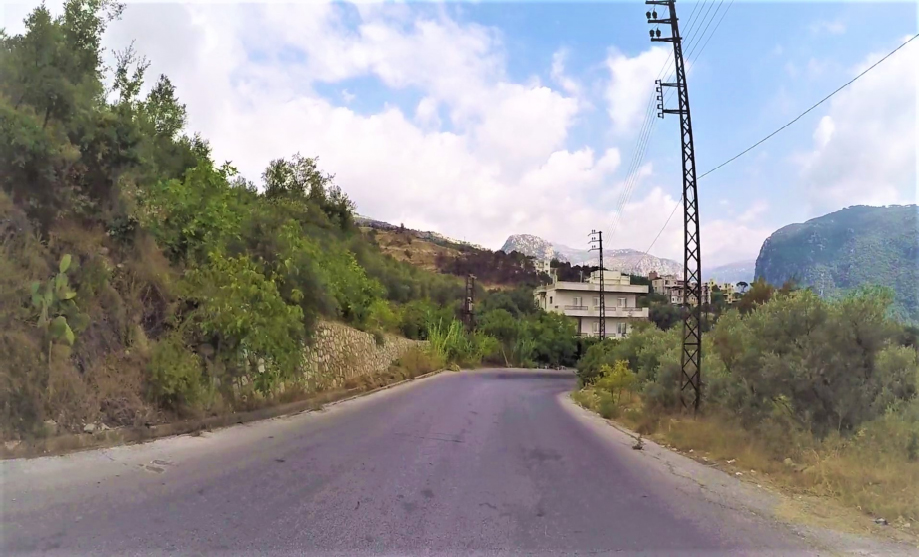 Image I9-B Complex Image I9-B Complex |
| Set I10 |
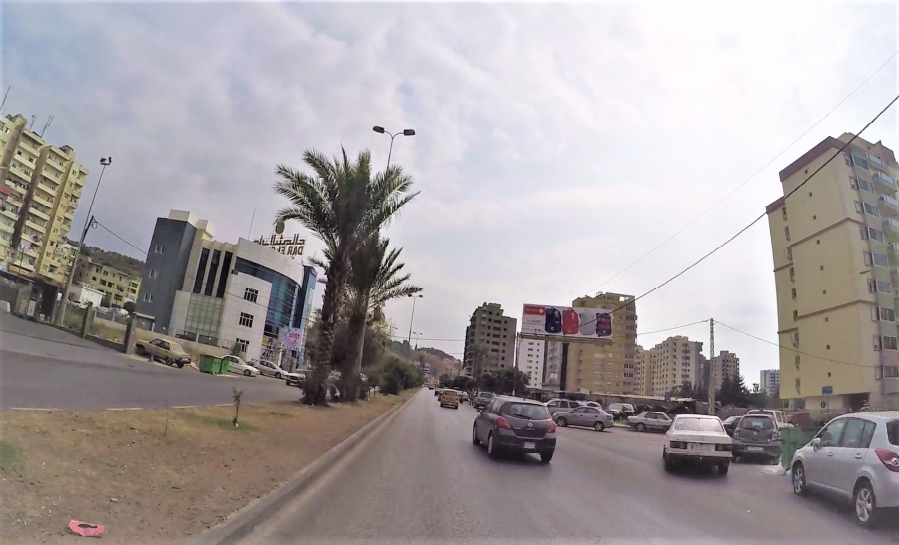 Image I10-A Complex Image I10-A Complex |
 Image I10-B Simple Image I10-B Simple |
| Set I11 |
 Image I11-A Simple Image I11-A Simple |
 Image I11-B Complex Image I11-B Complex |
| Demographic and Economic | Sex | Female |
| Male | ||
| Age-Marital Profile | Youth Single (18-21) | |
| Young Adult Single (22-30) | ||
| Young to Mid-Aged Married (22-43) | ||
| Mid-Aged to Mature Single (31-80) | ||
| Mature Married (44-80) | ||
| Widowed/Divorced/Others (18-80) | ||
| Household Financial Status*1 | Living in Other Arrangements (Financial Difficulty) | |
| Living in Other Arrangements (Moderate Finances) | ||
| Living with Parents (Financial Difficulty) | ||
| Living with Parents (Moderate Finances) | ||
| Solid Financial Status | ||
| Qualification & Occupation | Employee (Bachelor's or Less) | |
| Employee (Graduate Degree) | ||
| Student | ||
| Self-employed | ||
| Religion by Region | Christian (Mount Lebanon) | |
| Muslim | ||
| Christian (Beirut/Bekaa/North/South) | ||
| Other Religion | ||
| Driving Experience and Vehicle Characteristics | Driving & Accident Profile*2 | High frequency High distance (No Accidents) |
| High frequency High distance (With Accidents) | ||
| High frequency Low distance (No Accidents) | ||
| High frequency Low distance (With Accidents) | ||
| Low frequency Low distance | ||
| Vehicle Profile*3 | Compact Cars (2009 & Earlier) | |
| Family/Performance Cars | ||
| Other's Compact Cars (2010 & Newer) | ||
| Owned Compact Cars (2010 & Newer) | ||
| SUVs & Crossovers (2009 & Earlier) | ||
| SUVs & Crossovers (2010 & Newer) | ||
| Utility vehicles | ||
| Psychological | Sensation Seeking Score*4 | S.S Score /30 |
*2 This composite integrates Driving Frequency & Annual Distance Driven with Material Accident history in the last three years.
*3 This composite brings vehicle type, vehicle production year category, and vehicle ownership into a single analytical framework. 'Other's Compact Cars (2010 & Newer)' and 'Owned Compact Cars (2010 & Newer)' distinguish between drivers of compact cars manufactured in 2010 or later based on ownership.
*4 Utilizing Zuckerman's scale [36, 37], this score measures the individual's tendency to seek novel and intense experiences and is scored out of 30.
2.3.1. Determination of Optimal Cluster Number
The identification of an optimal number of clusters, denoted as k, is a pivotal aspect of clustering analysis, serving as the foundation upon which the interpretability of the results is built. In this section, we delve into the methodologies employed to ascertain the most suitable number of clusters for our dataset. Specifically, two robust techniques are utilized including the Elbow Method and the Tau Validation Method. The Elbow Method is a widely used graphical technique for determining the optimal number of clusters (k) [36]. It relies on the calculation of the within-cluster sum of squares (WSS), mathematically represented as follows [37]:
 |
(2) |
where, nj corresponds to the number of data points in the jth cluster;  represents the ith data point in the jth cluster; cj is the centroid of the jth cluster; and
  represents the squared Euclidean distance between a data point and the centroid cj of its cluster. This measures the dispersion of the points within each cluster. Applying the Elbow Method to our dataset, we calculated the Within-cluster Sum of Squares (WSS) for varying numbers of clusters. The analysis showed that the optimal number of clusters is k = 3, as demonstrated by the point where further increases in k led to minimal reduction in WSS. This indicates that the three clusters optimally balance within-cluster variance minimization and data segmentation, guiding our decision to segment our dataset into three distinct clusters.
The Tau validation method employs the Tau index, a mathematical metric, to determine the optimal number of clusters in a dataset [38]. This index evaluates the compactness and separation of clusters based on intra-cluster and intercluster distances. The Tau index is mathematically defined as follows [39]:
 |
(3) |
where s(+) and s(-) denote concordant and discordant comparisons, respectively, with concordant reflecting pairs of points within or between clusters and discordant showing mismatches. Nt is the total number of distances, and t is the number of comparisons of two pairs when both pairs are either within cluster or in different clusters. The optimal cluster count, k, maximizes the Tau index, indicating the most effective data partition into distinct, compact clusters. When applied to our dataset, the tau validation method revealed that three clusters (k=3) optimally balance compactness and separation, making it the preferred clustering solution. Determining the optimal cluster number, k=3, balances model complexity and interpretability, avoiding underfitting or overfitting. This choice, validated by both the elbow and tau methods, ensures a model that captures the data's underlying structure efficiently, making k=3 the optimal choice for this study.
2.3.2. K-Prototypes Clustering
Clustering methods are essential for dividing data into meaningful groups. The choice of the method depends on the data's nature and the analysis's goals. K-Prototype clustering, as introduced by [40], stands out for datasets that include both numerical and categorical variables, offering a versatile solution for mixed data types. It combines the strengths of K-Means for numerical data and K-Modes for categorical data into a single algorithm. K-Prototype distinguishes itself by utilizing the Gower distance metric to measure the dissimilarities between mixed data points effectively. This distance is represented by the following equation [41]:
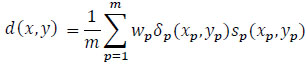 |
(4) |
where d(x, y) represents the Gower distance between points x and y, quantifying dissimilarity across m variables; wp is the pth variable's weight, often 1 for equal treatment but adjustable for variable importance; δp(xp, yp) is 1 unless xp or yp is missing; sp(xp, yp) scales dissimilarity, using absolute difference for numerical and 0 or 1 for categorical variables. The summation of all variables, normalized by 1/m, calculates the mean dissimilarity.
3. RESULTS
3.1. Visualizing Clusters Partitioned Through Factor Analysis
The dataset under study consists of 461 observations, each described by 21 variables including 14 numerical and 7 categorical. The clustering algorithm employed has effectively partitioned these observations into three distinct clusters: Cluster 1 contains 197 data points, Cluster 2 is composed of 118, and Cluster 3 has 146. This section aims to investigate these clusters further, starting with a visual representation through Factor Analysis of Mixed Data (FAMD) [42, 43], a technique well-suited for our high-dimensional, mixed dataset. FAMD computes principal components for numerical variables and principal coordinates for categorical ones, synthesizing them into a reduced-dimensional space that captures significant data variance. Fig. (2) presents the FAMD plot, focusing on Dimension 1 (Dim1) and Dimension 2 (Dim2), which summarize the original variables into new informative variables. Dim1 explains 16.9% of the data's total variance, and Dim2 adds another 7.1%, together highlighting key patterns and relationships. The plot shows the clusters vertically aligned: Cluster 1 appears on the right in blue, Cluster 2 in the middle in yellow, and Cluster 3 on the left in orange, demonstrating the clustering algorithm's effectiveness in partitioning the data and ensuring clear separation for analysis.
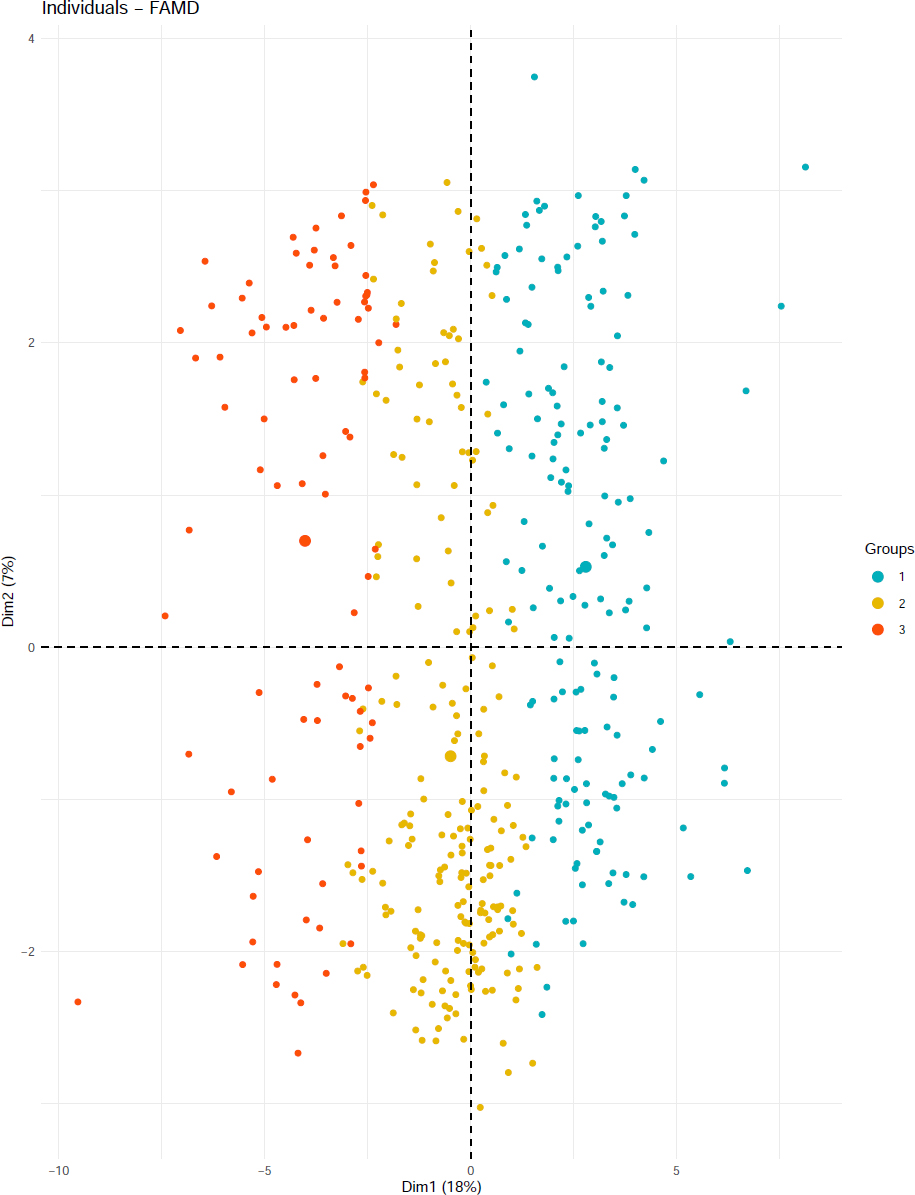
FAMD visualization of cluster distribution.
3.2. Comparing Clusters: Speed and Sensation in Relative Perspective
Employing the Z-score standardization method, we normalized the median values of numerical variables, including self-reported speed across all scenarios and sensation-seeking scores, to a common scale. This normalization facilitated equitable comparisons and enhanced the interpretability of clustering outcomes. Fig. (3) provides a visual representation of these scaled median values for each variable within Clusters 1, 2, and 3, illustrating the distinct driving behaviors and sensation-seeking tendencies across the clusters. Cluster 1's scaled median values are predominantly below the zero line, indicating a tendency towards more cautious driving behaviors relative to the overall sample mean. This pattern suggests that drivers in Cluster 1 adopt a moderate approach, positioning them as relatively cautious without veering into extreme conservatism. Cluster 2 is visually distinct, with its scaled median values significantly lower than those of the other clusters and deeply entrenched in the negative zone. This depiction underscores their highly cautious driving approach, identifying them as the most conservative group within the study. The pronounced deviation of their values highlights a marked preference for safety and a lower propensity for risk. Conversely, Cluster 3 is characterized by positively scaled median values across most variables, setting them apart as more inclined towards higher speeds and a greater tendency for sensation seeking. This positioning above the baseline signifies a bolder approach to driving, with a preference for speed and an elevated level of risk-taking compared to their counterparts.
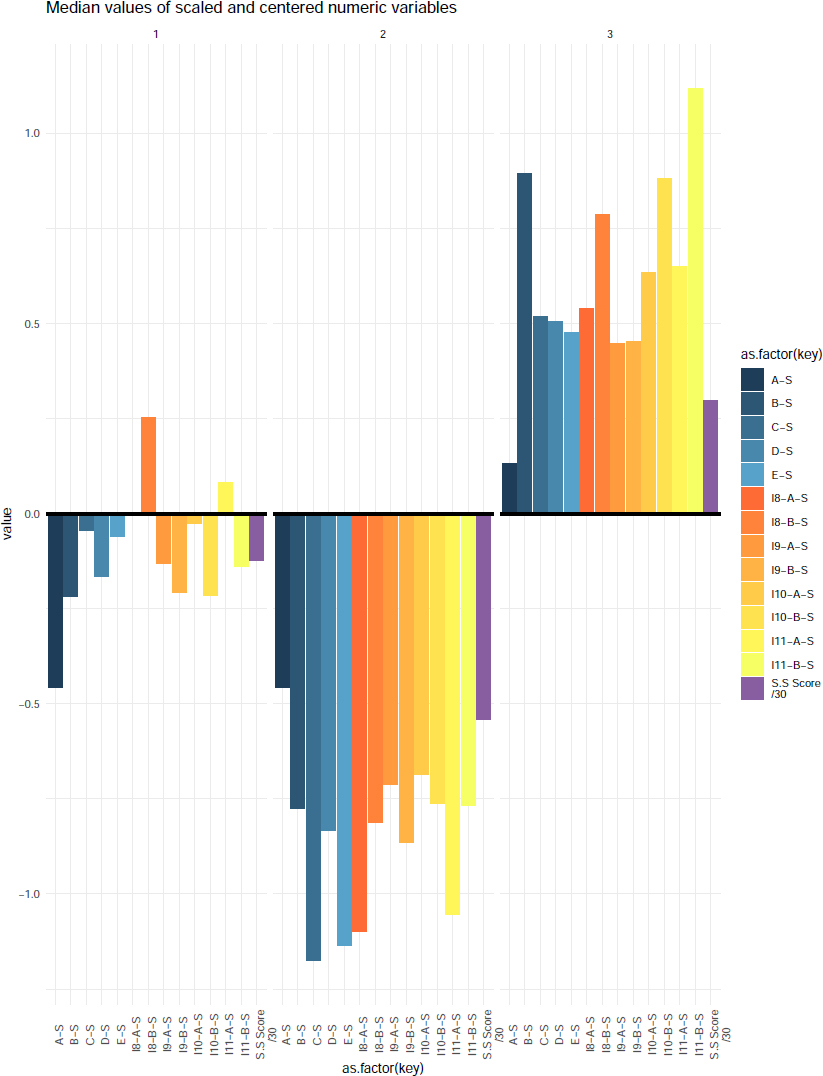
Graphical representation of scaled and centered median values across clusters.
3.3. Assessing Driver Adaptation to Road Complexity and Compliance with Speed Limits
This study employs the official speed limit as an objective benchmark for evaluating adaptive driving behaviors. By comparing self-reported speeds to the official speed limits across different levels of complexity, this study aims to discern patterns of adaptation, such as whether drivers maintain speeds within safe bounds or exceed them. This analysis seeks to determine not only how drivers adjust their speeds in response to complexity but also whether these adjustments align with the expectations set by the official speed limit, thus offering insights into their risk management strategies. Through this lens, this study explores the nuanced behaviors within each cluster, focusing on the dual aspects of adaptation to complexity and compliance with speed regulation. The speed limits for each are derived from Lebanon's official standards, grounding our analysis in a relevant context [44].
3.3.1. Cluster 1's Behavior: Conservative and Strategic Speed Adaptation
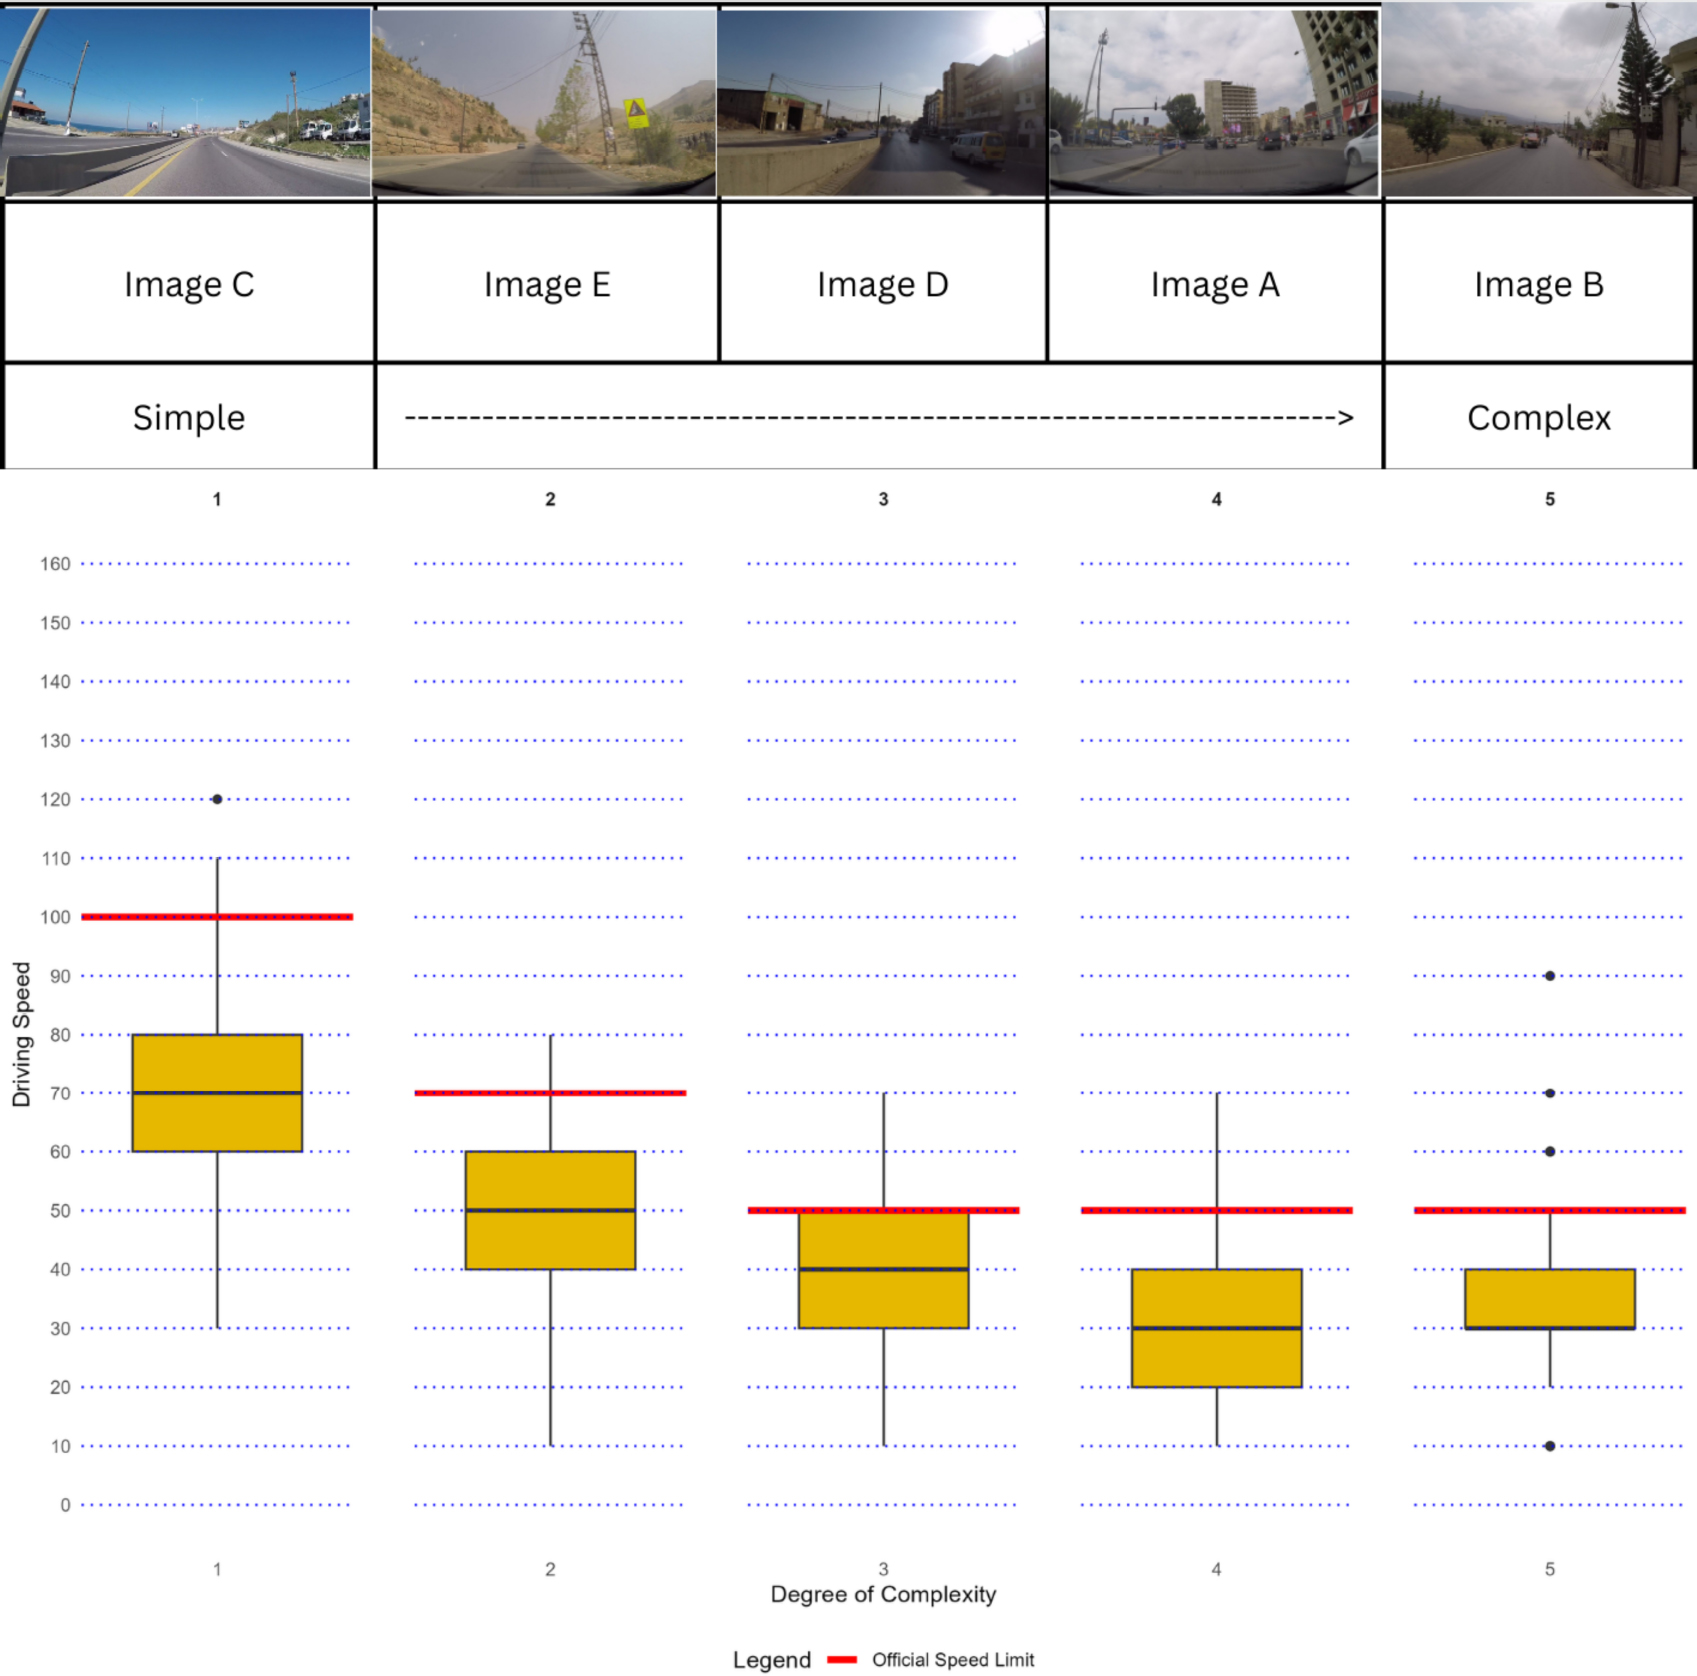
In Cluster 1, drivers demonstrate a conservative approach to speed across various levels of road complexity, as illustrated in Fig. (4). This cautious behavior is evident through their speed choices in scenarios ranging from to most complex. When encountering the simplest scenario (Image C), the median speed remains at a cautious 90 km/h, well below the 100 km/h limit, indicating a measured response to the environment. With a slight increase in complexity (Image E), the median speed aligns perfectly with the 70 km/h speed limit, showcasing a direct adaptation to the perceived challenges. As complexity further escalates (Image D), drivers adjust their speeds to precisely meet the 50 km/h limit, demonstrating a careful approach to navigating denser urban settings. In scenarios of higher complexity (Image A), the median speed significantly drops below the 50 km/h limit, signaling a uniform and cautious strategy to ensure safety in challenging conditions. When faced with the utmost complexity (Image B), although speeds slightly increase from the previous level, the median remains below the limit, demonstrating continued prudence. Overall, Cluster 1's driving behaviors reflect a nuanced adaptation to environmental complexity, maintaining speeds that are either aligned with or below speed limits to prioritize safety. This consistent adaptation across varying complexities underscore a collective commitment to cautious driving and risk management.
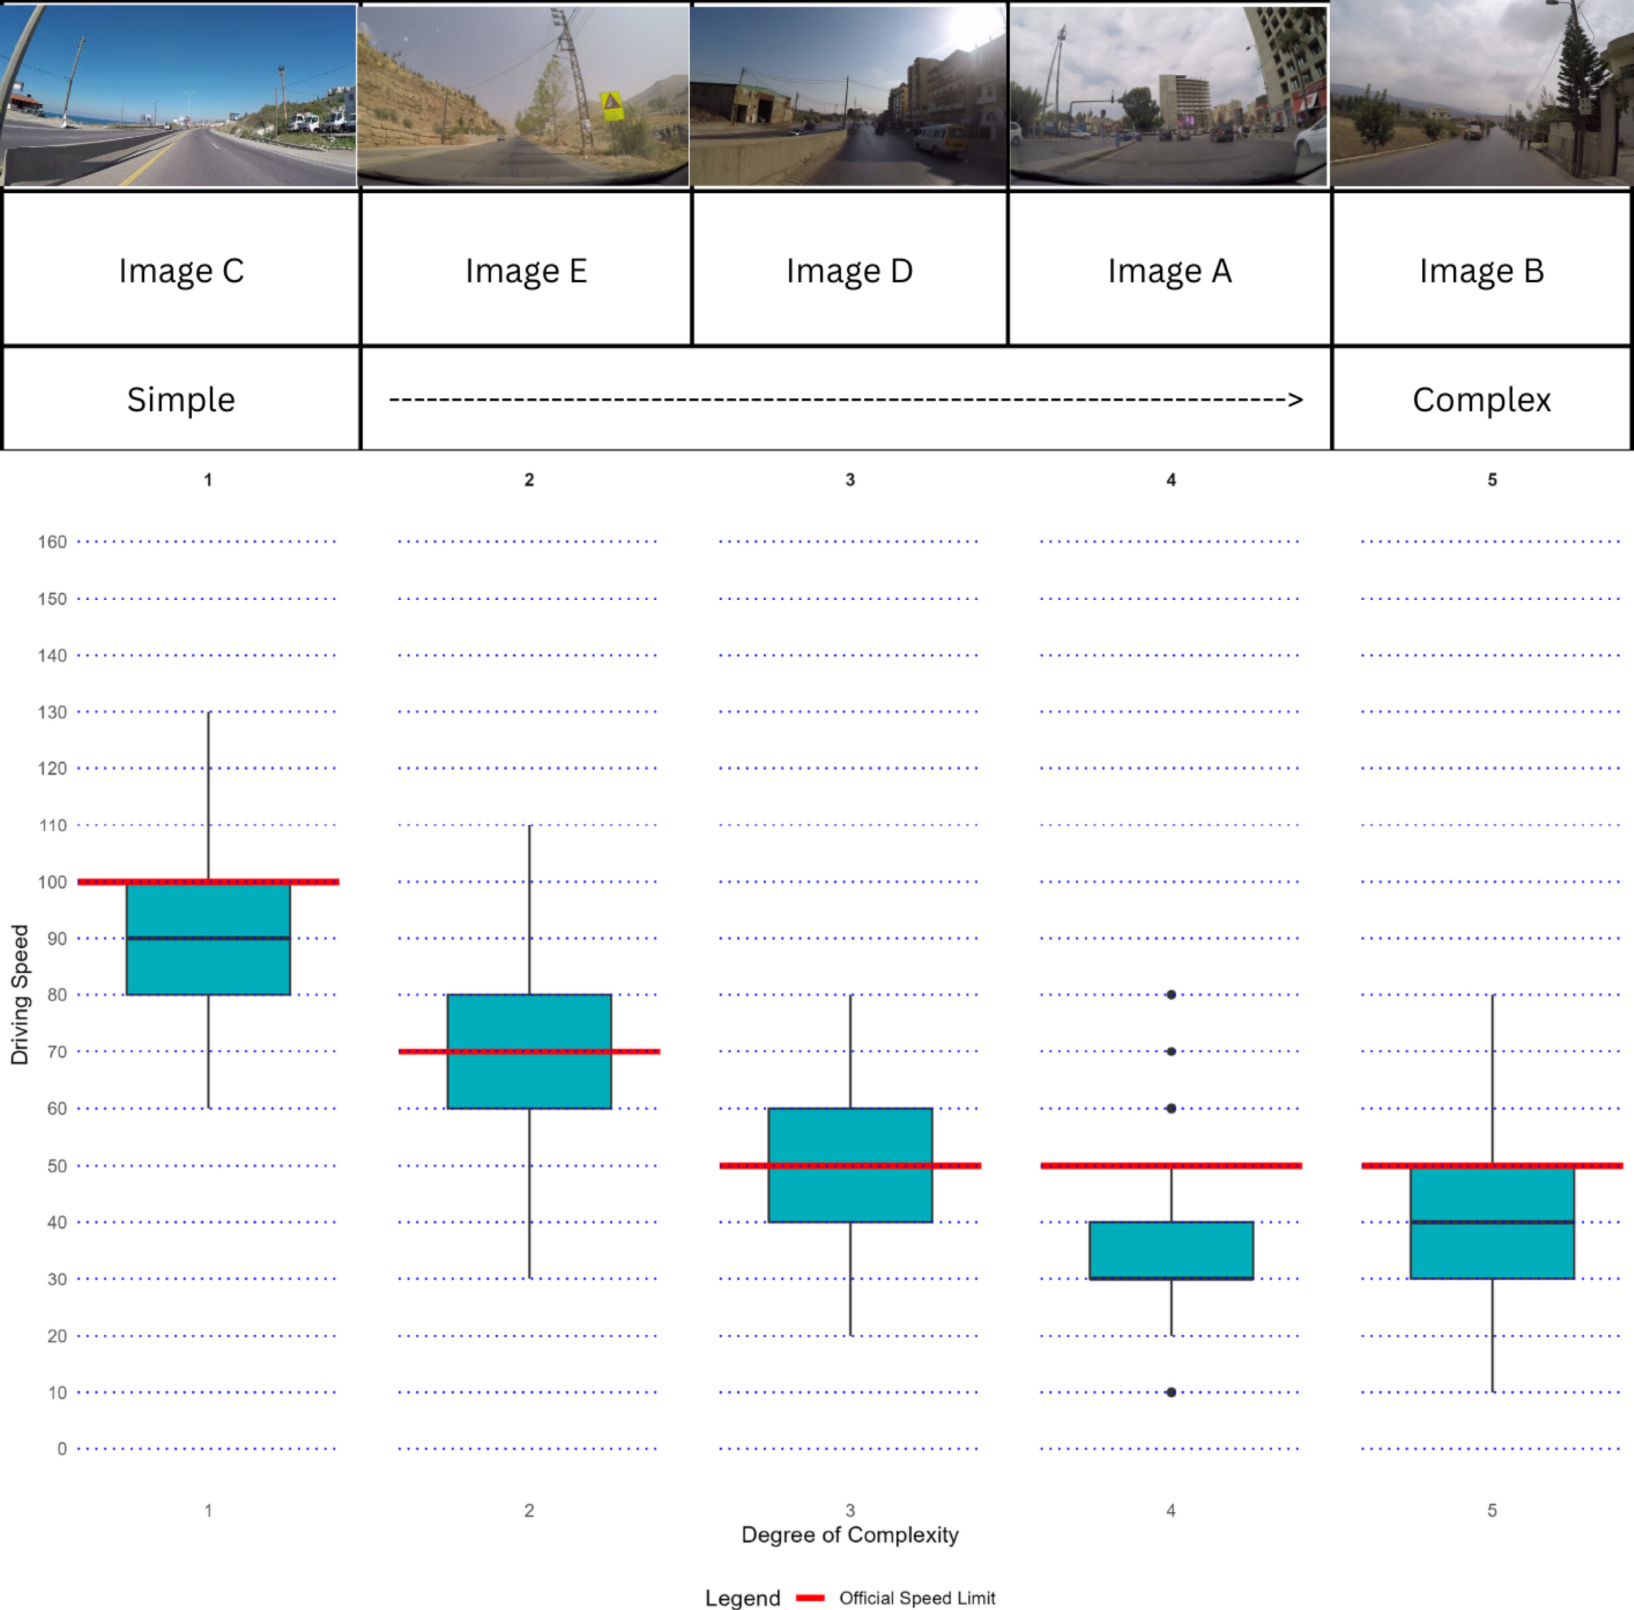
Speed distribution of cluster 1 drivers by road complexity.
3.3.2. Cluster 2's Behavior: Prudent and Safety-Oriented Speed Adaptation
Cluster 2 drivers exhibit an exceptionally cautious approach, consistently maintaining speeds well below the official limits in diverse road conditions, as depicted in Fig. (5). This pattern underscores a strong commitment to safety, which is evident in their adaptation to each scenario. In the least complex scenario (Image C), these drivers set a median speed of 70 km/h against a 100 km/h limit, showcasing caution even in straightforward conditions. Facing slight complexity increases (Image E), they adjust their median speed to 50 km/h, substantially below the 70 km/h limit, reflecting a thoughtful consideration of potential road hazards and a clear preference for safety over speed. With rising complexity (Image D), the median speed is further reduced to 40 km/h, below the 50 km/h limit, indicating careful navigation through urban settings. In scenarios of greater complexity (Image A), they maintain a median speed of 30 km/h, significantly under the 50 km/h limit, a signaling strategy of heightened caution. Even in the most complex situation (Image B), the median speed is maintained at 30 km/h, reflecting a uniform approach to risk management despite the escalating complexity. Overall, Cluster 2 drivers stand out for their prudent speeds and adaptive response to environmental challenges, emphasizing safety over speed across all levels of complexity. Their approach, significantly more conservative than Cluster 1, prioritizes effective risk management, showcasing commendable prudence and a well-adjusted response to varying road complexities.
Speed distribution of cluster 2 drivers by road complexity.
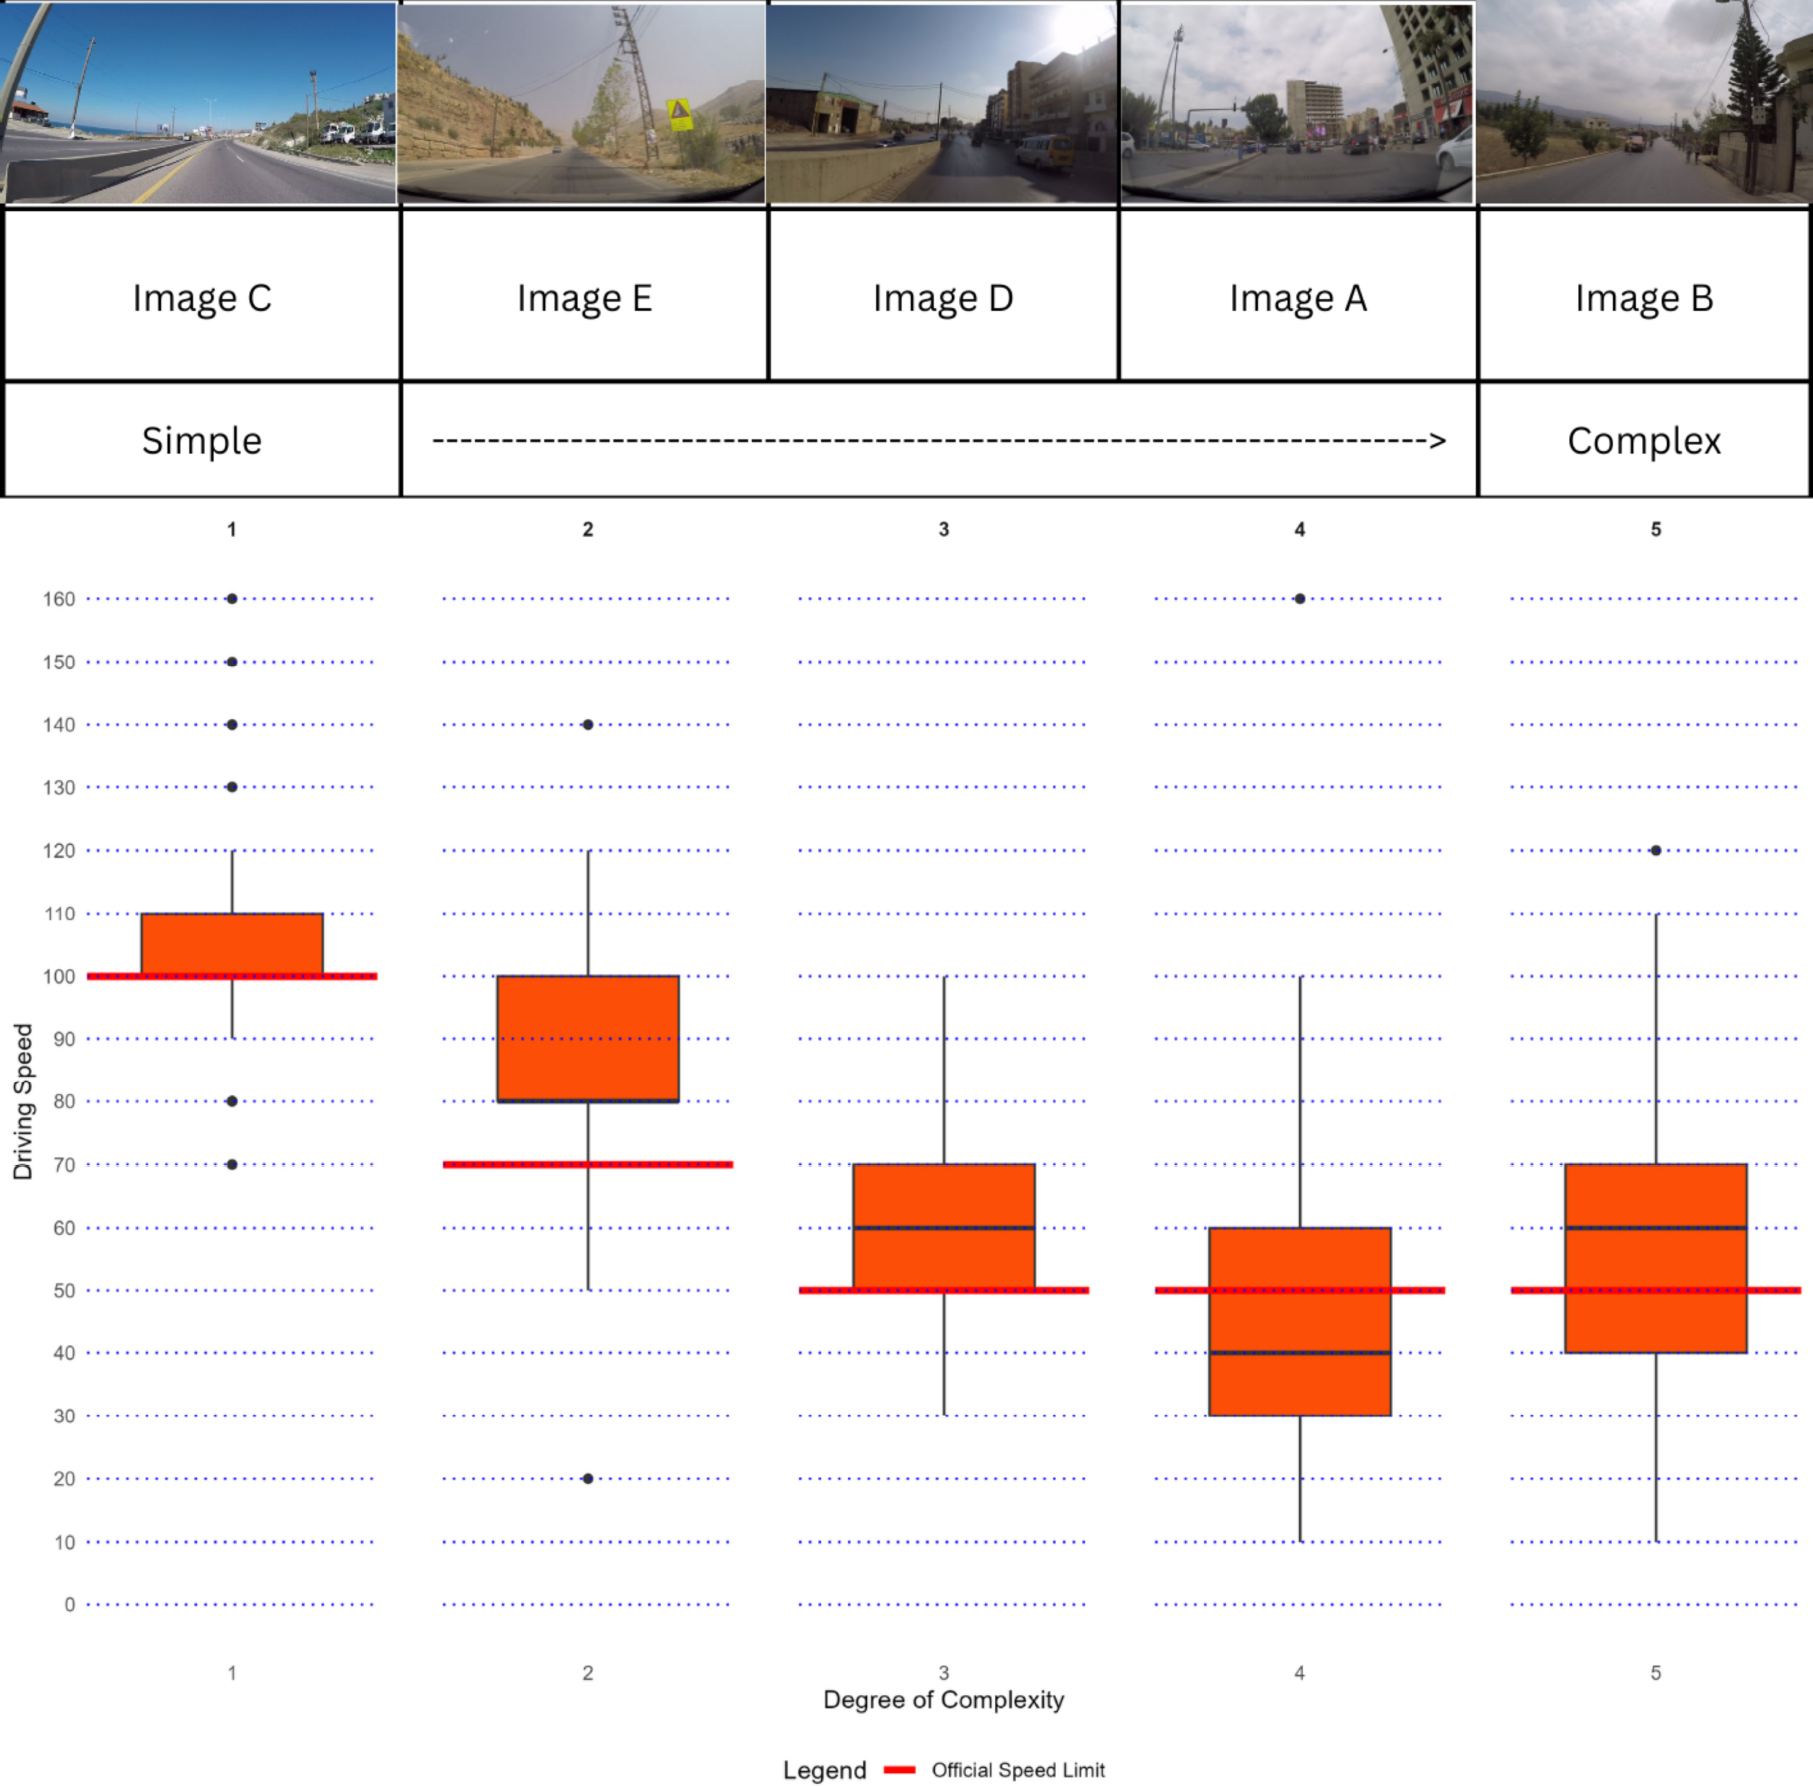
3.3.3. Cluster 3's Behavior: Risk-Taking and Insufficient Speed Adaptation
Cluster 3 drivers tend risk-taking, frequently surpassing speed limits in various road conditions, as shown in Fig. (6). In the least complex scenario (Image C), they precisely meet the 100 km/h speed limit, showing a willingness to utilize the maximum permitted speed. As road complexity increases (Image E), the median speeds slightly reduce to 80 km/h but remain above the 70 km/h limit, continuing a trend of risk-taking. This pattern of exceeding speed limits persists in more complex urban areas (Image D), with a median speed of 60 km/h, surpassing the 50 km/h limit and highlighting an indifference for safer driving practices. In more challenging conditions (Image A), while the median speed drops to 40 km/h, it still remains below but close to the 50 km/h limit, suggesting a minor adjustment towards caution yet not fully aligning with safety expectations. Surprisingly, in the most complex scenario (Image B), the median speed increases to 60 km/h, surpassing the speeds in Image A and breaching the 50 km/h limit, presenting a counterintuitive response to increased complexity. Overall, Cluster 3 drivers often engage in dangerous driving, especially when road conditions are less complex. While there is evidence of speed adjustment in response to complexity, the adaptations are often insufficient, failing to conform to safety standards expected in more challenging environments. This indicates a group of drivers who, despite recognizing greater complexity, do not consistently adjust their speeds to ensure safety.
Speed distribution of cluster 3 drivers by road complexity.
Speed distributions by cluster for varied road characteristics.
3.4. An Analysis of Specific Driving Environment Characteristics
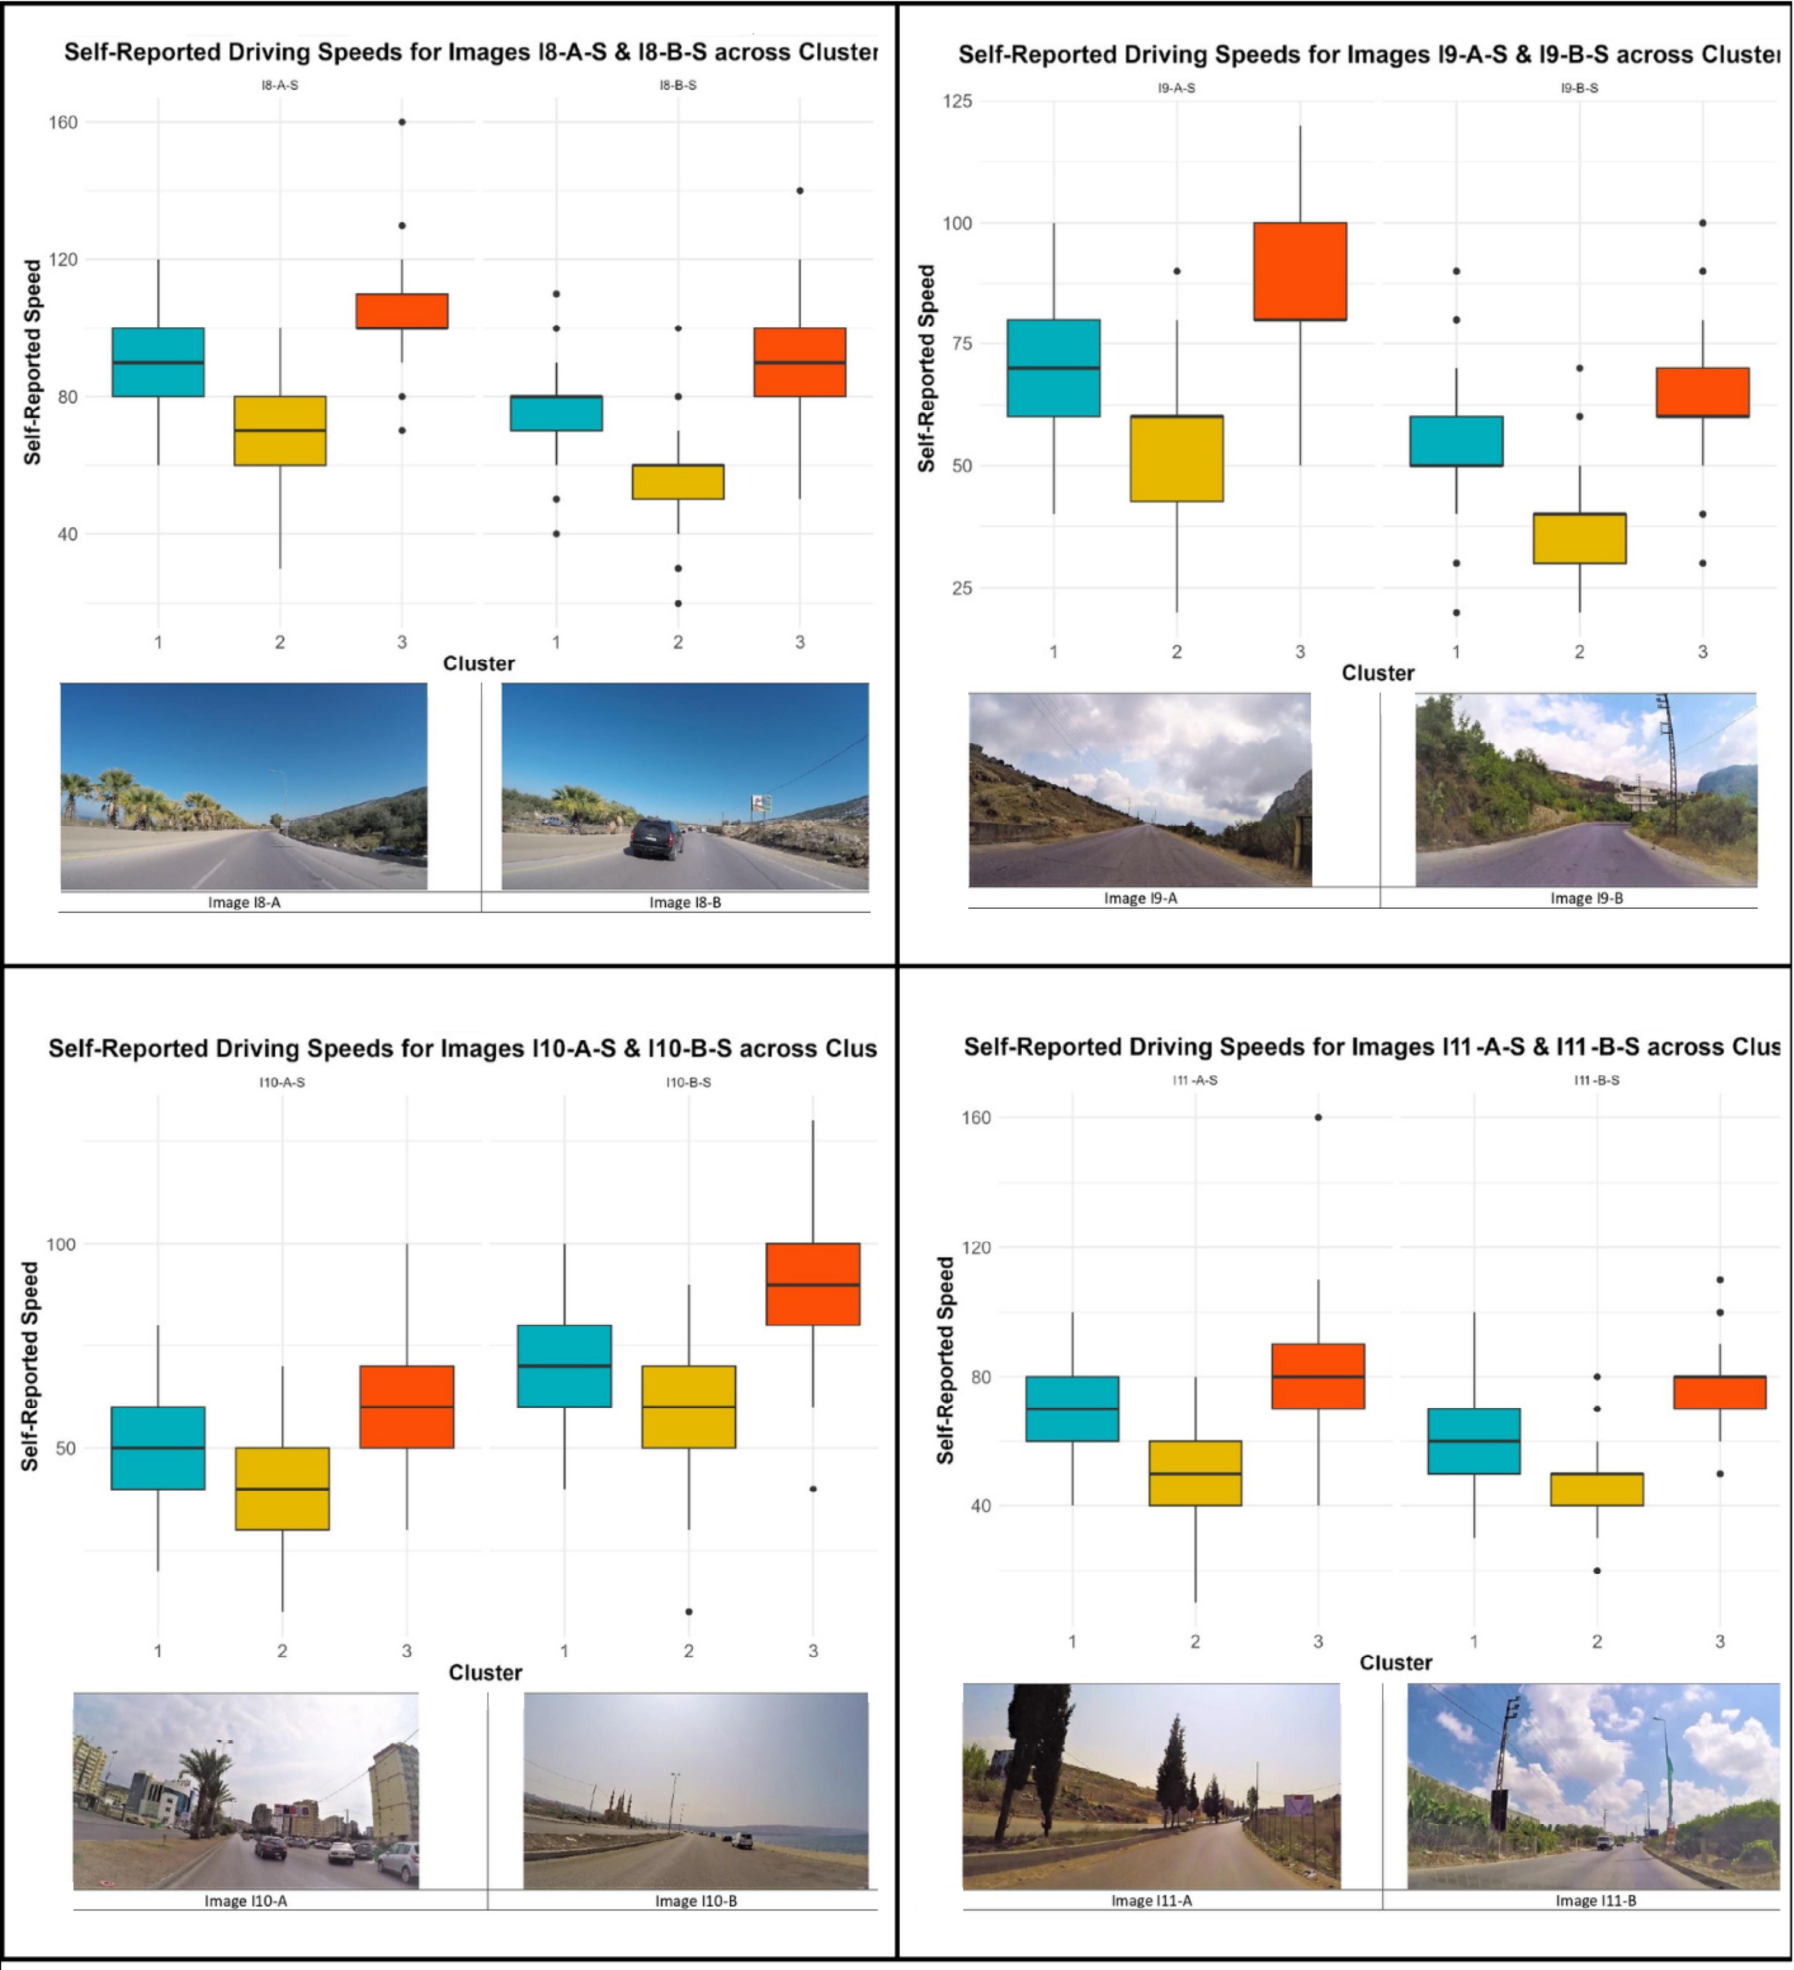
This section focuses on how specific road characteristics influence self-reported driving speeds. To visualize these dynamics, Fig. (7) presents boxplots illustrating the distribution of speeds for each cluster within various road scenarios. Cluster 1 drivers exhibit nuanced responses to road conditions. While traffic density has a minimal effect, suggesting a balanced approach to speed in both low and high-density situations, the presence of a sharp bend markedly reduces their speeds, underlining a cautious approach toward potential hazards. In contrast, less urbanized environments prompt an increase in speed, indicating a preference for faster driving away from urban congestion. Furthermore, the absence of a dividing median correlates with a reduction in speed, underscoring safety concerns on more open roads. Cluster 2 reveals a pattern of consistent caution, with drivers reducing their speeds across all scenarios, especially in high traffic and near sharp bends. However, like Cluster 1, drivers in Cluster 2 also prefer faster speeds in less urbanized areas, reflecting a preference for faster travel when away from dense urban areas. However, the influence of a dividing median on speed is less pronounced, indicating that the presence or absence of a median does not significantly alter driving speeds for this group. Cluster 3 drivers show a marginal impact of traffic density on speeds, with participants tending towards faster speeds regardless of traffic density, suggesting a propensity for higher speeds. The presence of a sharp bend leads to a significant reduction in speed, akin to Clusters 1 and 2, highlighting the universal caution in such scenarios. Like the other clusters, there's an increase in speed in less urbanized areas. The presence of a dividing median does not uniformly result in speed reduction or increase, indicating a complex response to road separation features in this cluster.
3.5. Intra-Cluster Perspectives: Exploring Drivers' Profiles and Practices
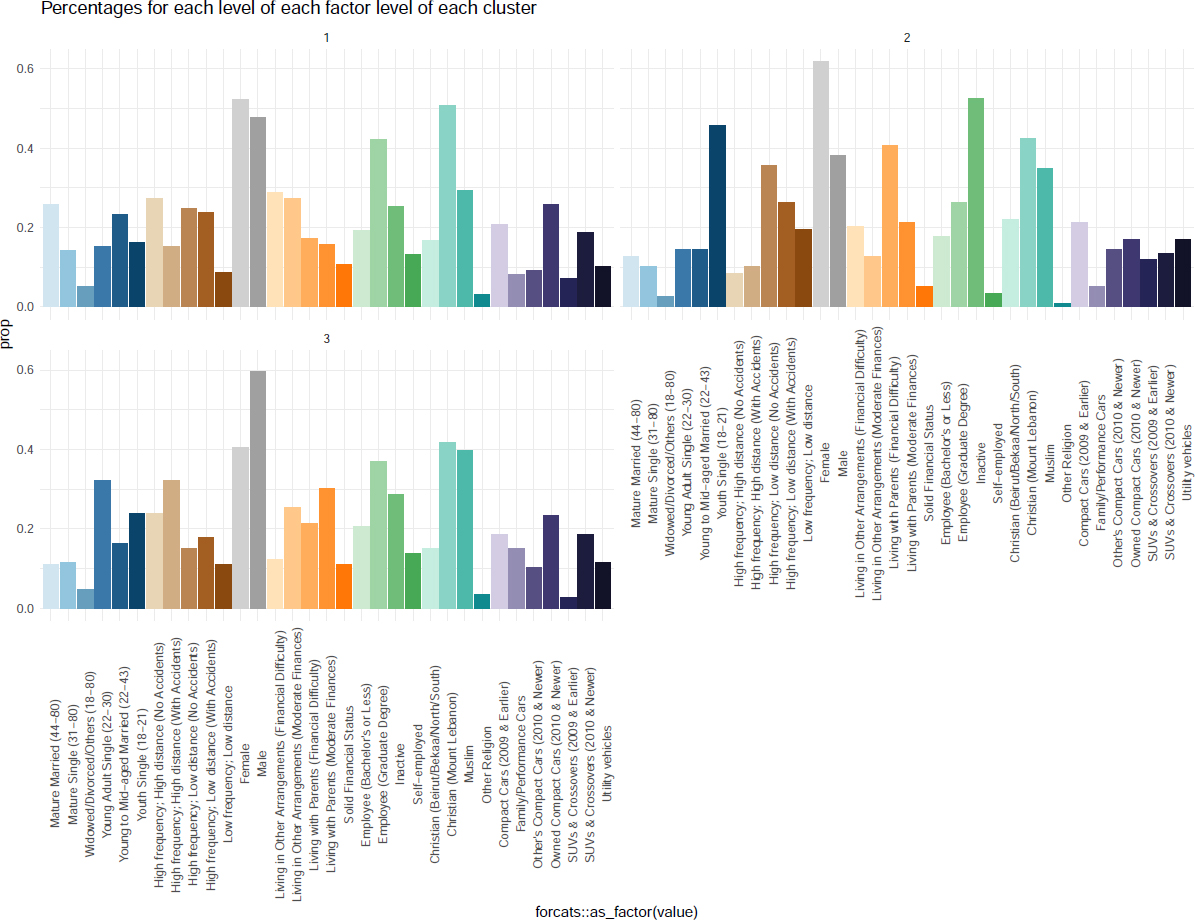
The cluster-based analysis reveals distinct patterns in demographics, driving experience, and vehicle attributes across the three clusters, each presenting a unique blend of characteristics. Cluster 1 exhibits a balanced gender distribution, skewing slightly towards females, with a significant representation of married individuals, particularly in the mature age bracket. This cluster is characterized by a preference for modern compact cars and a cautious driving and accident profile, indicative of a demographic that values safety and practicality. Cluster 2 is marked by a predominance of younger, single females living with parents, highlighting financial challenges with a notable representation in the youngest age bracket. This cluster's driving behavior leans towards local, low-distance navigation, with a preference for older compact cars and SUVs, reflecting the financial constraints and the lifestyle of its predominantly younger demographic. Cluster 3 distinguishes itself with a male majority and a young, single demographic, showcasing a balance in household composition and financial stability. The driving and accident profile suggests a riskier approach, with a preference for diverse modern and family/performance cars. This cluster represents a demographic that is financially stable yet exhibits a propensity for higher-risk driving and accident profiles. Fig. (8) represents the distribution of categorical variables across clusters, showcasing detailed percentages for a nuanced view of demographics, driving experience, and vehicle attributes.
4. DISCUSSION
The present study investigated adaptive driving behaviors within a representative sample of the Lebanese population faced with diverse road complexities. This inquiry segmented participants into three distinct clusters, offering a comprehensive examination of their responses to environmental challenges.
4.1. Cluster Dynamics and Driving Adaptations
To explore the nuanced adaptations of different driver groups, this section delves into the behavioral patterns that distinguish Cluster 1 and Cluster 2 in their approach to road complexities while also addressing the unique challenges faced by Cluster 3.
4.1.1. Divergent Adaptation Strategies in Cluster 1 and Cluster 2
Cluster 1 and Cluster 2 demonstrated adaptive behaviors, yet with notable differences in their levels of caution. Specifically, Cluster 1 effectively adjusted their driving to varying road conditions, showcasing a balanced approach that reflects a dynamic risk assessment, modifying speeds to match the escalating demands of road complexity. In contrast, Cluster 2, characterized by their heightened caution, consistently maintained lower speeds in all scenarios, reflecting a more conservative driving strategy that extends beyond mere compliance with speed limits, manifesting a deep-seated aversion to any perceived risks. This conservative nature of Cluster 2 can be seen as a preventive strategy, possibly driven by less confidence or experience among these drivers compared to the more seasoned and diverse demographic of Cluster 1. Additionally, Cluster 1's ability to vary speed adjustments indicates a higher level of situational awareness and flexibility, which contrasts with Cluster 2's uniform speed reduction, which suggests a lower tolerance for uncertainty and change, potentially impacting their efficiency in dynamic traffic situations. This distinction highlights how Cluster 2’s consistent under-speeding may reflect a strategy influenced by a preference for maximum safety margins, differing from Cluster 1's approach, which aims to balance caution with efficiency.
4.1.2. Cluster 3's Unique Challenges
Cluster 3 diverged from this pattern, exhibiting less adaptability and a propensity for risk-taking by frequently exceeding speed limits and showing inadequate response to increased road complexity. These variations suggest that a complex interplay of demographic, socio-economic, and cultural factors significantly influences adaptive driving behaviors across clusters [45-47].
Detailed distribution of drivers' profiles and practices within clusters.
4.1.3. Socio-Demographic Impact on Driving Behaviors
In-depth analysis of Cluster 1 revealed a demographic profile marked by a balanced gender distribution and a tendency towards more mature age groups, which correlated with conservative driving practices across different levels of road complexity. This observation aligns with existing literature highlighting the pivotal roles of age and driving experience in influencing cautious driving behaviors and a reduced inclination towards risk-taking [48-51]. Such evidence reinforces the significance of demographic factors in molding driving habits, affirming the necessity of incorporating these insights into road safety strategies. Previous research has reported that socio-economic status and household financial conditions significantly impact driving behavior, with financial constraints potentially leading to more cautious driving due to the higher costs associated with risk-taking [52, 53]. This heightened caution in Cluster 2 can be attributed to its demographic composition of younger, predominantly female drivers living under financial constraints with parents, suggesting that their conservative approach is driven by less driving experience and a higher sensitivity to potential risks. This study's findings align with this perspective, particularly in the case of Cluster 2. This reinforces the necessity to consider socio-economic backgrounds in road safety interventions and policy formulation. Cluster 3's analysis disclosed a tendency towards riskier driving behaviors among younger male drivers, a group characterized by financial stability and a diverse religious composition. This trend mirrors findings from prior studies identifying young males as more susceptible to engaging in risky driving, influenced by sensation-seeking and overconfidence [54-56]. The unique socio-cultural fabric of Lebanon, with its religious and regional diversity, introduces additional layers to the complexity of driving behaviors, highlighting the urgent need for culturally tailored road safety measures.
4.2. Implications for Road Safety Policies
To reflect on the diverse driving behaviors across clusters, this study delves into their implications for Lebanon's speed limit policies, particularly in urban settings marked by complex interactions. Currently, the uniform enforcement of a 50 km/h speed limit, as illustrated by Images A, B, and D, does not adequately reflect the environmental complexity [57]. Clusters 1 and 2, exhibiting cautious behavior in complex urban and pedestrian-dense areas, suggest that reducing speed limits to 30 km/h would align better with their driving patterns and enhance safety. This strategic adjustment would meet the specific needs of these drivers but also support broader Safe System recommendations, thereby improving road safety in densely populated settings [58, 59, 60]. Conversely, Cluster 3's behavior, characterized by a propensity to exceed speed limits, underscores a critical safety concern [61]. Introducing variable speed limits and robust enforcement measures, such as speed cameras in less complex environments where this behavior is prevalent, could enhance compliance and reduce high-speed driving risks. Considering the reduction of speed limits to 30 km/h in scenarios A and B would serve as a test to potentially expose the inadequacy of current speed adjustments made by drivers in this cluster. This observation suggests a disjunction between the perceived and actual complexity of the driving environment, highlighting the need for a reevaluation of speed limit policies to better reflect the realities of road safety and complexity [62].
A recalibration of speed limits, particularly in urban zones characterized by high pedestrian activity and intricate driving conditions, is advised. Proposed adjustments should derive from an in-depth analysis of road complexity to foster cautious driving [63, 64], serving as a robust deterrent against the risk-prone behaviors of drivers in Cluster 3. Additionally, for Cluster 2, implementing policy-driven educational initiatives that boost confidence and knowledge about safe speed ranges will address the overly cautious behaviors that can also pose risks. For Cluster 3, developing targeted public awareness campaigns focusing on the dangers of speeding and aggressive driving, especially tailored to young male drivers, will use strategic media and communication methods to effectively engage this demographic. Furthermore, the observed discrepancies in speed choices for Images A and B across all clusters reveal a critical insight: drivers perceive Image A as more complex than Image B, contrary to expert assessments made during the survey's design. This discrepancy underscores a fundamental principle of our theoretical model—that the individual interpretation of objective complexity varies significantly [65]. Essentially, the process through which drivers and experts evaluate complexity diverges, suggesting that the criteria or elements considered by each group are not aligned. Drivers may overlook certain aspects deemed critical by experts or vice versa, leading to different perceptions of the same environmental features. To further improve road safety, it is essential to formulate policies that mandate regular analysis of accident data and speed compliance rates by area to inform road design adjustments. Such improvements should include upgrading road signage, enhancing road surface markings, and redesigning intersections to reduce complexity. These measures aim to simplify navigation and enhance the intuitive use of roadways, ensuring safer environments for all drivers. This variance in interpretation raises important questions about road design and safety measures, emphasizing the need to consider how subjective perceptions of complexity influence driver behavior. It highlights the necessity for a more inclusive approach in assessing road complexity [66-68], one that integrates both expert analysis and drivers' lived experiences to develop road safety strategies that are truly reflective of all road users' perspectives.
4.3. Limitations and Future Directions
Some limitations need to be considered. First, the sample's demographic profile, with an overrepresentation of university graduates and Christians from specific regions, may limit the generalizability of the findings across Lebanon's diverse population. This could skew the understanding of driving behaviors and adaptation strategies, necessitating a broader sampling in future research to capture a wider spectrum of driver experiences [69]. Second, the study's reliance on self-reported data introduces potential biases. Participants’ responses could be influenced by social desirability or inaccurate recall, affecting the validity of the findings [70]. Future studies might benefit from employing observational techniques or simulation experiments to reduce these biases and enhance data reliability [71]. Additionally, the focus on Lebanese roads may not fully translate to other contexts due to differences in road infrastructure, traffic laws, and cultural attitudes towards driving, highlighting the need for comparative international research [72]. Lastly, the methodology does not account for the dynamic nature of driving, where immediate road conditions and personal judgment influence decisions to adhere to or deviate from speed limits. This static approach may not accurately reflect the complexities of real-world driving behavior, suggesting an area for further exploration in understanding the nuanced dynamics of driver adaptation and compliance [73].
CONCLUSION
The present study investigated adaptive driving behaviors among Lebanese drivers in response to varying road complexities, revealing significant differences across the three clusters. One of the most significant findings is the varied adaptability across these clusters, with Clusters 1 and 2 displaying adaptive behaviors in cautious and conservative driving, respectively, while Cluster 3 tended towards risk-taking by frequently exceeding speed limits. This underscores the impact of diverse demographic, socio-economic, and cultural influences on driving adaptation. Given these insights, there is a critical need for road safety policies that specifically cater to the distinct characteristics of each driver cluster. Furthermore, this research opens the door to examining other forms of adaptation beyond speed adjustment, such as the use of mobile phones while driving, which suggests diverse adaptation strategies among drivers. This calls for a disaggregated analysis to uncover various strategies offering insights into driver responses to road complexity. In conclusion, while adjusting speed is a common form of adaptation, this study highlights the importance of considering a broader spectrum of adaptive behaviors and the factors influencing them. Therefore, future research should aim to dissect these mechanisms further, offering targeted recommendations for enhancing road safety, not only in Lebanon but also in similar challenging driving environments globally.
AUTHORS' CONTRIBUTIONS
It is hereby acknowledged that all authors have accepted responsibility for the manuscript's content and consented to itssubmission. They have meticulously reviewed all results and unanimously approved the final version of the manuscript.
ABBREVIATION
| FAMD | = Factor Analysis of Mixed Data |
ETHICS APPROVAL AND CONSENT TO PARTICIPATE
Ethical approval for this study was granted by the Ethics Committee at the Saint Joseph University of Beirut (USJ), Beirut, Lebanon, under approval number USJ-2020-112.
HUMAN AND ANIMAL RIGHTS
The study protocol adhered to the ethical principles outlined in the Helsinki Declaration.
CONSENT FOR PUBLICATION
Consent was obtained from all participants before they participated in the study.
AVAILABILITY OF DATA AND MATERIALS
The data supporting the findings of the article is available in the Zenodo Repository at: https://zenodo.org/ records/11311916?token=eyJhbGciOiJIUzUxMiJ9.eyJpZCI6IjY0Mzg1ZjYyLWU0MmUtNDg5NS04MzVmLTM4ZGM3NTQ2YTI3MCIsImRhdGEiOnt9LCJyYW5kb20iOiIyNTNjMTMyMTY0NjZlZmUzZmYwODEwMmUwY2ZjNGRmNiJ9._fimENdENf4M6cc6C8KdsPqCiRhZ4394p4_Yln7r73g7W4XsbQtF-EFIpsFhITxf3suG03eajDRO_C3NRCgbcw, DOI 10.52 81/zenodo.11311916.

