All published articles of this journal are available on ScienceDirect.

Comprehensive Assessment of the Effectiveness of Passenger Transportation Processes using Intelligent Technologies
Abstract
Introduction
This studypresents a comprehensive evaluation of the effectiveness of passenger transportation using intelligent technologies based on economic, technical, and operational efficiency parameters. It reviews existing approaches to efficiency assessment and proposes an optimal set of criteria for assessing the efficiency of the passenger transport process, which will allow for better planning of routes, movement schedules, and choice of transport rolling stock.
Objective
This study aims to provide a better assessment of the efficiency of passenger transport using intelligent technologies.
Aims
This article aims to carry out an integral assessment of the efficiency of passenger transport using intelligent technologies based on the criteria of economic and technical-operational efficiency, which will allow better planning of routes and schedules and selection of rolling stock
Methods
In order to obtain a comprehensive criterion for assessing the efficiency of the transportation process, diverse techniques, including computer and mathematical modeling, algorithm theory, mathematical statistics, observation, and measurement, were employed.
Results
A general criterion was created in order to evaluate the efficiency of passenger transportation processes based on the overall costs for both the user and the operator. Furthermore, a specific criterion of efficiency for passenger transportation processes has been defined: passenger-kilometers traveled. The applicability of the model is evaluated in a bus corridor in Havana. The results show that due to external factors, namely overcrowding, overall costs decrease at the same rate for both 12-meter and 15-meter buses with different intervals, while the number of passengers transported per kilometer increases at a faster rate for larger buses.
Conclusion
Choosing a criterion to assess the effectiveness of the passenger transportation process requires considering various aspects of importance that will result in passenger comfort and safety, as well as the effectiveness of the transport process. To solve this problem, it is necessary to do additional research and analyses to determine the most appropriate set of criteria under specific conditions. In particular, consider vehicles of smaller capacity to take into account volumes with variable demand.
1. INTRODUCTION
Passenger transport plays an important role in providing mobility and connectivity in modern cities. However, with the increase in traffic flows, the need for efficient transport management to ensure passenger comfort, safety, and satisfaction emerges. In recent years, intelligent technologies have become increasingly important in passenger transport management. However, the choice of criteria for assessing the effectiveness of the transportation process is a complex task, as it requires consideration of many factors, such as transport speed, passenger flow density, ticket price, service level, etc.
With the development of intelligent technologies, new approaches to the optimization of the process in urban agglomerations became available, which revolutionized the management of transport mobility systems.
Real-time data collection and analysis, route optimi- zation, and improved traffic management are just some of the benefits that these technologies offer. However, it is important to establish objective criteria to assess the effectiveness of such systems and thus ensure that they effectively achieve their goals.
There are several approaches to assessing the effectiveness of the transportation process. Some approaches are based on economic indicators [1-6], other approaches include taking into account the quality of passenger service [7-10] and vehicle trips [11-14] comfort of the vehicle [12, 15-17], accessibility [2, 11, 18-20], vehicle speed [21-23] and safety for the user [24-27]. In rare cases, researchers consider indicators such as greenhouse gas emissions [15, 26, 28-31] and the carbon footprint [19, 32-36], technical and operational indicators (e.g. passenger-kilometers [1, 4, 37]), vehicle capacity utilization [38-40] and the average distance traveled by passengers and its cost [41].
In the existing literature, many authors propose to optimize service frequency and vehicle size for automated bus systems by considering travel time stochasticity, time-dependent passenger flows, vehicle capacity constraints (additional waiting time due to denied boarding), and external factors [16, 42]. Often, discomfort during the journey, both for seated and standing passengers on a micro level, is also included in the analysis [14, 42-44]. Other authors assess the impact of automation on optimal vehicle size [45], service frequency, fares [46], subsidies, and the extent of economies of scale, with potential reductions in vehicle operating costs due to the introduction of intelligent technology; consequently, granting benefits to users, costs, and to public transport passengers through reduced waiting times and optimal fares per trip [1, 8, 41, 42].
On the other hand, some authors consider the possibility of minimizing the travel time of a bus route by taking into account the bus travel time and dwell time at the station, highlighting the travel time as the main factor affecting the bus travel time and route [41, 43, 47, 48].
Other authors suggest that the availability of transport, the uneven dispatch of vehicles, as well as comfort in buses, that is, the possibility of traveling comfortably using transport, should be improved as an important factor for assessing effectiveness [18, 49-51].
The aims of this article is to carry out an integral assessment of the efficiency of passenger transport using intelligent technologies based on the criteria of economic and technical-operational efficiency, which will allow better planning of routes and schedules and selection of rolling stock. The objective of our work is to provide a better assessment of the efficiency of passenger transport using intelligent technologies.
2. MATERIALS AND METHODS
At present, it has not been possible to find a unique and precise criterion for assessing the efficiency of public transport, which is why a multi-criteria approach that combines the entire set of indicators that reflect the purpose of public transport is used. Not all of the characteristics used for evaluation can fully form an objective image of the quality of the service, although they provide valuable information on the operation of the transport system and can be used to identify areas for improvement as well as corrective measures. This makes it difficult to assess the operation of urban public transport systems objectively.
Thus, one of the urgent problems in the field of transport systems is the definition of a new universal set of criteria that guarantee an adequate assessment of passenger transport organization.
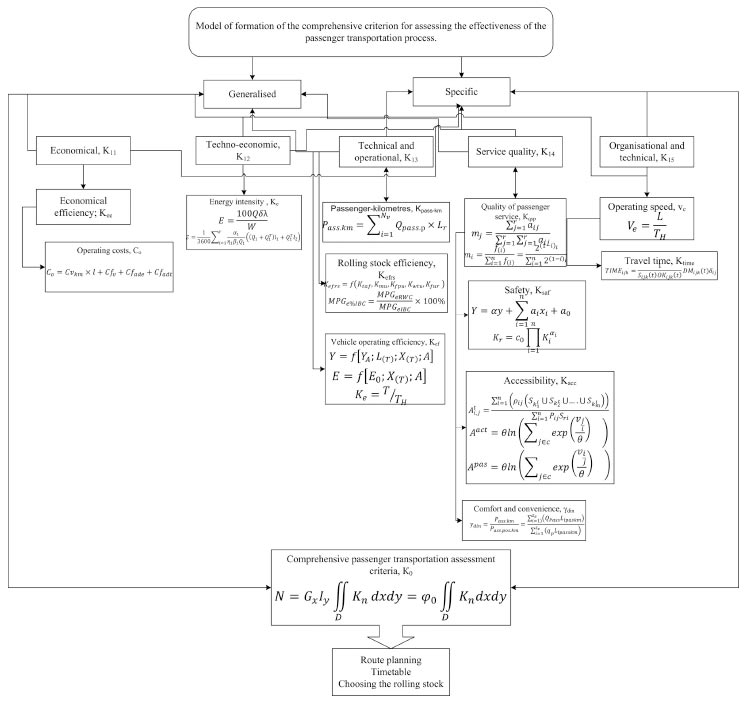
Fig. (1) shows the formulation of some criteria for assessing the effectiveness of the passenger transport process according to different authors.
An integrated assessment of the effectiveness of the passenger transportation process with the use of intelligent technologies is a systematic approach to evaluation. This includes taking into account different aspects such as passenger service quality, safety, speed, punctuality, and efficient use of the resources [52-55], all of which provide a comprehensive and objective assess- ment of the efficiency of the transportation process and identify areas for improvement.
3. RESULTS AND DISCUSSION
In order to carry out a comprehensive assessment of the effectiveness of the passenger transportation process using intelligent technologies, an integral approach that includes several stages is proposed. The creation of a system to assess the efficiency of the passenger transportation process requires the development of a system of indicators and methods to assess the efficiency of the passenger transportation process [56] using intelligent technologies that take into account the definition of existing key performance indicators of the transport process based on data collection [57, 58], determination of assessment criteria, analysis of the obtained data and comprehensive assessment of the results and decision-making (Fig. 2).
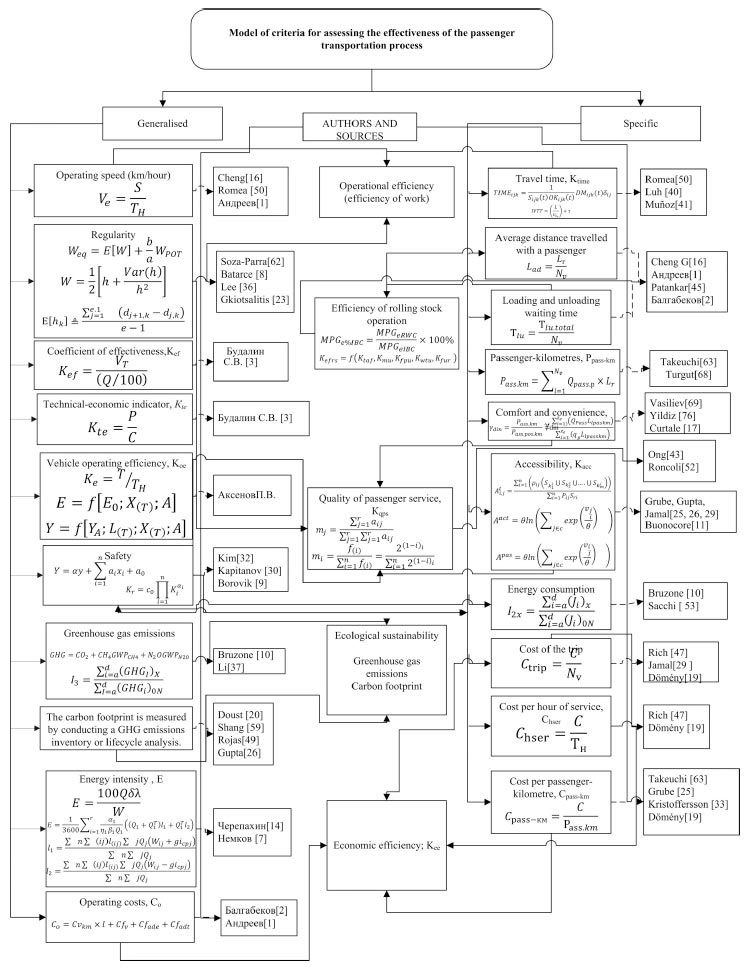
Model of criteria for assessing the effectiveness of the transportation process.
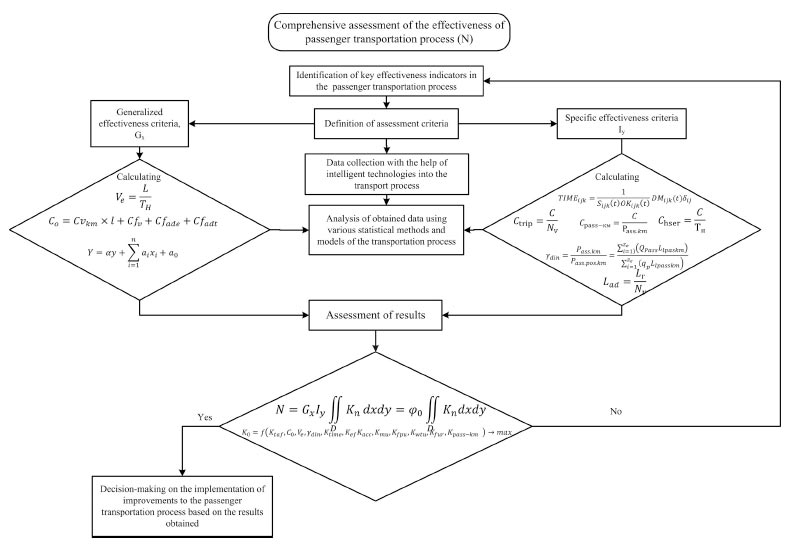
Algorithm of the integral assessment of the efficiency of the passenger transportation process (N).
In order to assess the efficiency of the passenger transport process, it is necessary to define an optimization criterion, which should allow for a comprehensive evaluation of the system. These can be generalized or specific effectiveness criteria that take into account all the main indicators or only some indicators of vehicle efficiency in the organization of the transportation process or reflect specific features of the vehicle in the transportation process [59, 60]. (Fig. 3).
Generalized and individual effectiveness criteria can be developed by optimizing one or a combination of several parameters or indicators used to assess effectiveness [61, 62]. In the former case, the criteria are considered multifactorial, while in the latter case, they are considered unifactorial.
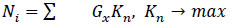
Based on the type of indicator chosen for assessing efficiency, the existing criteria can be categorized, as mentioned earlier, into generalized and specific efficiency criteria. The methods under development are founded on the comprehensive criterion for evaluating the effectiveness of the passenger transportation process, which involves applying a weighted average indicator (Eq 1):
 |
(1) |
where, GХ - Generalised effectiveness criteria; Kn - single effectiveness indicators obtained as a result of the assessment of transportation process with the use of intelligent technologies; Iy - specific effectiveness criteria; D- range of values of effectiveness assessment indicators of a given type regulated by standards; φo - certain range of values of effectiveness assessment indicators of a given type regulated by standards.
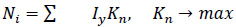
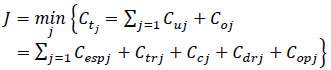
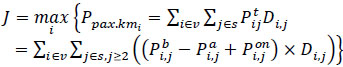
The optimization problem which makes it possible to evaluate the effectiveness of the transportation process with the use of intelligent technology, taking into account economic, technical-economic, technical-operational, quality of service, and technical-organizational criteria, is defined in the following equation (Eq 2):
 |
(2) |
In this given Eq. (1), the objective was to maximise the effectiveness of the passenger transportation process in a scenario of urban agglomerations (Eqs 3 and 4):
 |
(3) |
 |
(4) |
Taking into consideration the above, we have developed two criteria for assessing the transportation process: a general (economic) and a specific (technical-operational) criterion. For this purpose, we have taken into account the following assumptions.
The main assumptions used to determine the criteria for evaluating the transportation process are [42, 43, 63, 64]:
- In high-frequency bus systems, passenger arrivals at stations are assumed to be random;
- Dependent demand volumes are recorded during a 15-minute interval;
- A subject of consideration is a common bidirectional bus corridor with equal departure intervals from the first stop;
- Waiting time is variable (flow dependent), which may vary for a vehicle at each stop depending on the number of passengers getting off and on at that stop;
- The distribution of stochastic running times between stops is log normal;
- The capacity of vehicles is restricted, therefore:
Model for the formation of an integral criterion for assessing the effectiveness of passenger transportation process efficiency.
(a) The number of departures will never exceed the residual capacity of the vehicles;
(b) In case of denied boarding, additional waiting time shall be taken into account;
(c) If the demand for boarding exceeds the residual capacity of the bus, it is assumed that the probability of boarding is the same for all passengers waiting for that bus, independently of the destination.
- Overtaking while the bus is traveling is not permitted;
- To calculate user costs, the monetary value of vehicle travel time, initial waiting time, and extra waiting time due to denied boarding are differentiated;
- An estimate of the occupancy rate of the vehicle is needed, and the discomfort from the load limit for each bus must be taken into account;
- User cost is sensitive to on-board crowding levels on the vehicle for seated and standing passengers;
- Intelligent technology allows:
(a) Increased capital cost of vehicles due to the inclusion of automation technologies inside vehicles;
(b) Reduction in vehicle driving costs;
(c) Reduced vehicle operating costs by reducing fuel/energy consumption through a more balanced driving style.
To assess the effectiveness of the passenger transportation process using intelligent transport systems, the following criteria can be considered.
3.1. Generalised Criterion for Economic Effectiveness
According to a previous study [42], the criterion for minimum total cost of transportation (Ct), defined as the sum of user (Cu) and operator (Co) costs, is most commonly used as a measure of economic efficiency in the transportation process. The user cost (Cu) comprises waiting time and time spent in the vehicle. Operator costs (Co) include capital, driver, and operating costs. As suggested in a previous study [42], the single-objective optimization model allows for the simultaneous consideration of trade-offs between user and operator costs, thereby identifying an optimal solution that minimizes the total cost of public transportation services.
According to some authors, it has been demonstrated that the value of waiting time at bus stops is greater than the value of time in a vehicle [11, 65, 66]. Moreover, the value of the additional waiting time due to denied boarding (for passengers left behind due to capacity constraints) is greater than the value of the initial waiting time experienced in normal circumstances [42, 65, 67]. Thus, by using three different monetary evaluations, denoted as φesp1, φesp2, and φv [€ /h], they establish a difference among the monetary value of the initial waiting period, additional waiting time due to denied boarding, and the time spent within the vehicle.
To estimate operator costs, vehicle capital costs, and driver costs are usually defined on a temporal basis [€/veh-hour or €/veh-day], while operating costs are defined on a spatial basis [€/veh-km] [41, 42]. In our context, φdr and φcap [€/veh-h] is used to convert vehicle hours of operation into driver and vehicle capital costs, respectively, while φex [€/vehicle-km] is used to convert the distance traveled by vehicles into their operational costs. In this case, both are inversely proportional as the effectiveness of the transportation process is considered to be the higher when this indicator is lower (Eq 5):
 |
(5) |
Where: Cu – user cost; Cesp – total waiting time cost;
User cost (Cu)
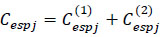
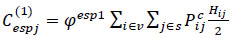
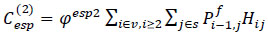
As described in expression (6), the total waiting time costs include: (1) the initial waiting time costs for new passengers entering the stops during the journey, plus (2) the extra waiting time costs due to denied boarding taken into account for passengers left behind who could not board the previous bus due to overcrowding.
The average waiting time is estimated as half of the headway (Hi,j/2) for travelers in the group (1) [see Eq. (7)], which is consistent with a common assumption in the field (e.g., in line with a common assumption in this field [8, 42, 43, 68]. Nevertheless, the total trip waiting time (Hi,j) for travelers in group (2) who must wait for the next vehicle is the extra waiting time. If the additional waiting time (φesp2) surpasses the initial waiting time (φesp1), refusing boarding could result in a substantial rise in passengers' costs associated with waiting time [45] (Eq 8).
 |
(6) |
 |
(7) |
 |
(8) |
where: Hi,j - Interval between buses i 1 and i at bus stop j (min.);  - Total number of passengers arriving at bus stop j during the trip between buses i-1 and i; φesp1 - Monetary value of initial waiting time, €/hour; φesp2 - Monetary value of additional waiting time due to denied boarding;
  - Total number of passengers who failed to board bus i at bus stop j.
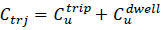
The cost of passenger dwell time in a vehicle consists of two components: the cost of trip time between stops, i.e. Cvtrip, and the cost of dwell time at stops, i.e. Cvdwellj (Eqs 9-11).
 |
(9) |
 |
(10) |
 |
(11) |
Where:  - Travel time of bus i between stops j-1 and j; δa - Acceleration time s; δd - Deceleration time; αsit - Vehicle sitting time multiplier; αst - Vehicle standing time multiplier;
  - Number of seated passengers on bus i between stops j-1 and j;
  - Number of seated passengers on bus i between stops j-1 and j;
  - Number of passengers on bus i between stops j-1 and j;
  - Number of passengers getting off bus i at stop j.
As shown in Eq. (10), the cost of trip time between stops is obtained by multiplying the total number of passengers on board (including both seated and standing passengers) by the total time required to travel between each two consecutive stops [42]. Furthermore, in this formulation, the user cost is sensitive to the level of vehicle congestion, allowing us to estimate the cost of passenger discomfort in a vehicle as a function of the occupancy level of each vehicle on each section of the route [42, 69]. Indeed, crowding in vehicles has proven to be a significant source of travel discomfort for both seated and standing passengers, thereby increasing the perceived vehicle dwell time for both groups of travelers. This study distinguishes between the value of time spent in a vehicle for seated and standing passengers using the crowding multipliers αsit and αst, respectively.
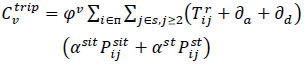
In addition, it is important to describe the operator cost elements (So) included in the target function (5). The introduction of intelligent technology in vehicles has the potential to affect the operator’s costs in three aspects: increased capital costs and reduced driver training and operational costs. Therefore in previous studies [41, 42], the operator costs were formulated in general terms for human-driven bus operations, and the impact of the introduction of intelligent vehicle technology on operator costs in general terms for human-driven bus operations and the impact on operator costs (including capital costs, driver costs, and operating costs) was separately described by additional factors, namely: β (β ≥ 1), ω (0 ≤ ω ≤ 1) и θ (0 ≤ θ ≤ 1) in line with a common assumption in this field [42]. The total capital cost of a vehicle (fleet acquisition cost) is estimated by the equation (eq 12):
 |
(12) |
where, β- Capital cost factor reflecting the level of increase in vehicle capital cost as a result of implementing intelligent technologies; φcap - Capital cost per vehicle per hour, i.e., the cost of owning or leasing a vehicle per hour;  -Time for bus i to stand at stop j;
  -Time for bus i to travel between stops j-1 and j;
  - Acceleration time s;
  - Deceleration time.
For bus fleets with intelligent technology, the coefficient β (β≥ 1) represents the increase in vehicle capital cost due to the inclusion of the implementation of intelligent technology in vehicles. The value of this parameter has been estimated [55, 65] for vehicles of different sizes.
The total cost of driving is estimated using the formula (eq 13):
 |
(13) |
where: φdr - Hourly driving cost.
It is not expected that intelligent technology will be able to completely eliminate the costs associated with human involvement, as some staff still monitor bus routes using intelligent technology, providing information to users and ensuring the safety of operations and passengers. Therefore, it is worth considering other new staff needs that may arise in an intelligent public transport system [41, 70]. For fleets equipped with intelligent technologies, the coefficient (0 ≤ ω ≤ 1) reflects the level of ongoing driving costs required after the introduction of intelligent technologies.
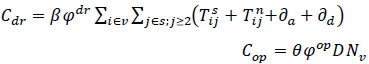
Eq. (14) considers the total operating costs (e.g., energy consumption, tyres, mechanical repairs, and maintenance) based on the total distance traveled by vehicles:
 |
(14) |
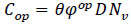
where, φop Vehicle operating cost per kilometre; D- Length of route; Nv- vehicle fleet size.
The coefficient θ (0 ≤ θ ≤ 1) represents the level of operating cost reduction with intelligent technology. This technology can reduce fuel/energy consumption per kilometer by providing more balanced driving functions [41, 42, 62] or V2V and V2I communications. For example, if θ = 0.8, it means that 20% of vehicle operating costs per kilometer can be saved with intelligent technology.
3.2. The Specific Criterion of Technical and Operational Efficiency
This criterion is based on an indicator called the criterion of passenger-kilometers transported in an efficient transportation process.
This criterion aims to define an indicator that estimates the number of passengers transported per kilometer traveled. In this case, the efficiency of the transportation process increases the higher this indicator is (eq 15):
 |
(15) |
where: V – Set of vehicles, V = {1, 2, ..., Nv}; S – Set of stops, S = {1, 2, ..., Ns}; i – Index of buses; j, k – Index of stops (from origin j to destination k) ; Di,j – the distance between stops j-1 and j of route i (km);  – total number of passengers transported by vehicle i from origin j to destination k (pax.);
  – Number of passengers inside vehicle i between stops j − 1 and j;
  > – Number of passengers boarding vehicle i at stop j
  – number of passengers alighting from vehicle i at the stop (in line with [42, 71]).
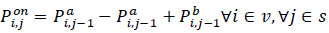
The number of passengers inside vehicle i between stops j-1 and j, includes those passengers who remained in vehicle i from the previous segment (j -2 → j- 1) because they do not need to alight at stop j-1, ( ), plus passengers boarding vehicle i at stop j-1, denoted by
  [54, 55]. Vehicles at the first stop are empty
 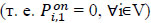 [42] (eq 16).
 |
(16) |
If passengers alight at the first stop still, this value is counted as  and this value will be added to Eq. (15).
Other criteria that could potentially be evaluated in intelligent transport systems, similar to the increase in transport productivity as measured by the number of passengers transported, a reduction in energy consump- tion, and a reduction in greenhouse gas emissions that are measured in conventional transport.
4. APPLICATION
In order to verify the criteria proposed above, several scenarios were modeled for an actual bus corridor in the city of Havana, serving an average total hourly demand of 2,375 [pax/hour] during the morning peak hours. Regarding the period of analysis, our modeling is performed over a three-hour period from 6:00 to 9:00 am. The time-dependent demand data related to the entire modeling period is presented below. The P-2 bus line will be the example. This bus route is a two-way bus route with 66 bus stops (33 stops in each direction) [72].
The input parameters used in the baseline scenarios are presented in Table 1. All cost parameters are based on hybrid vehicles using intelligent technology and human-driven public transport operations and have been calculated [41, 42, 73].
Taking into account intelligent technology and human-driven vehicles, stochastic travel times, and the presence or absence of vehicle overcrowding effects, different values of intervals and vehicle sizes are modeled. The optimal interval and vehicle size are determined for any variation. On the other hand, in order to comprehensively evaluate the effectiveness of the transport process using smart technologies in the global cost of public transport services, several sensitivity tests are conducted: human driving cost savings by implementing smart technologies, stochasticity of travel time, dwell time, regularity, crowding multipliers, extra waiting time and user- and operator-centered design options as proposed in [45, 52].
The variables affecting these criteria are vehicle interval and vehicle size (12 meters in length for articulated buses and 15 meters for large buses). There is a limited number of possible solutions that must be evaluated for each vehicle size to find the optimal solution that results in the lowest total cost and the highest number of passenger-kilometers transported. For example, for our experiment in Havana, taken as an illustrative example of a corridor with high passenger volume (2375 passengers per hour), the min interval and max interval are set at 5 and 12 minutes, respectively (i.e., fmin 5 and fmax 11 (veh/h), i.e., the set of intervals is considered as {5, 6, 7,.... 11 [veh/h], which contains a total of 6 elements. Therefore, for 2 different bus sizes, there are 6 × 2 = 12 possible solutions.
| Parameter | Unit | Value |
|---|---|---|
| Total demand | pax/hour | 2375 |
| Route length | км | 45,6 |
| Minimum frequency | veh/hour | 6 |
| Maximum frequency | veh/hour | 5 |
| Maximum interval | min/veh | 12 |
| Minimum interval | min/veh | 10 |
| Acceleration time | s | 7 |
| Deceleration time | s | 7 |
| Monetary value of time in a vehicle* | €/h | 2,9 |
| Monetary value of initial waiting time* | €/h | 3,5 |
| Monetary value of extra waiting time due to denied boarding** | €/h | 11,6 |
| Driver cost* | €/veh-h | 6,2 |
| Reduction of driving costs (baseline scenario) | % | 50 |
| Reduced running cost automation | % | 10 |
| Vehicle length | м | 12 |
| Vehicle capacity | pax./veh. | 160 |
| Number of seats | – | 31 |
| Number of doors | – | 2 |
| Cost of vehicle operation | €/veh-km | 0,7 |
| Capital cost of the vehicle | €/veh-h | 7,7 |
| Increasing capital cost automation | % | 25 |
| Load factor*Fij | αsit | αsta |
|---|---|---|
| 0-75 | 0,86 | - |
| 75-100 | 0,95 | - |
| 100-125 | 1,05 | 1,62 |
| 125-150 | 1,16 | 1,79 |
| 150-175 | 1,27 | 1,99 |
| 175-200 | 1,40 | 2,20 |
| 200- | 1,55 | 2,44 |
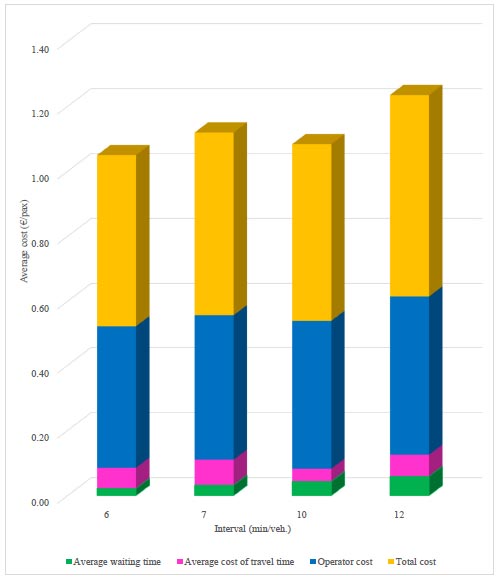
Total running costs for 12 metres buses.
Table 2 provides information on vehicle occupancy levels in terms of average and maximum occupancy for any given scenario (eq 17).
 |
(17) |
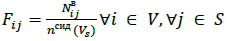
In Figs. (4 and 5), the results obtained for waiting costs, vehicle dwell time costs, operator costs, and total costs are shown. Of the two bus size options, the option with the lowest total cost is the 15 meter (240 passenger capacity) bus option with a 6-minute interval (10 buses per hour). Although the 12 meter (capacity of 160 passengers) bus has a higher cost, the passenger waiting time and operator costs are lower.
Total running costs for 15 metres buses.

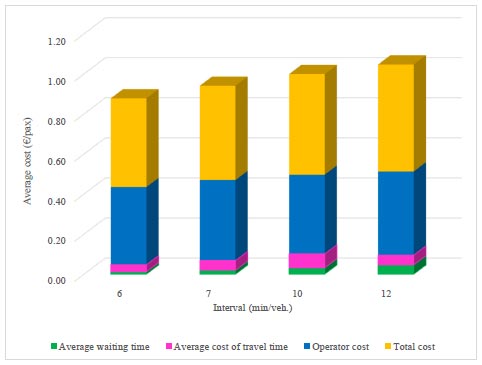
User and operator costs of 12-meter buses.
In Figs. (6 and 7), the operator and user costs and the total cost are shown. As you can see, the user cost for both types of buses increases with increasing intervals between buses. This is mainly due to the increased waiting time of passengers at the bus stops.
As for the cost of extra waiting time due to denied boarding, as can be seen in Fig. (8), it decreases for larger vehicles with lower intervals.
User and operator costs of 15 meter buses.
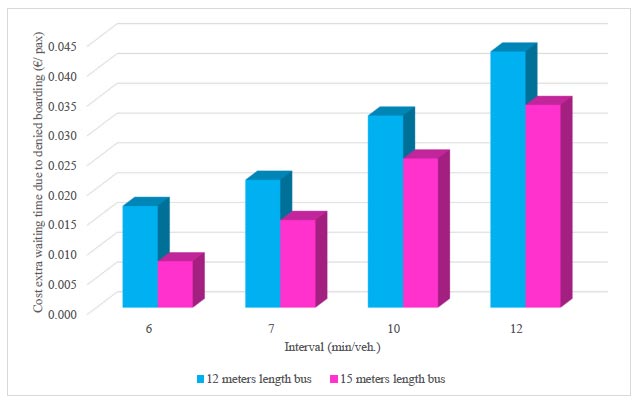
Cost of extra waiting time due to boarding denial.
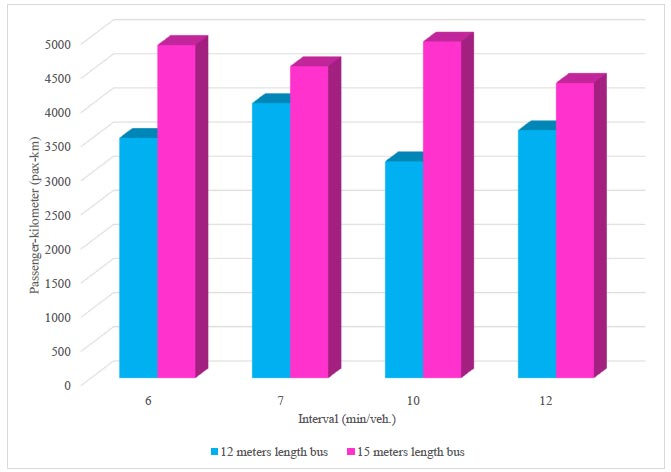
Passenger kilometres according to bus size and the interval between buses (headway).
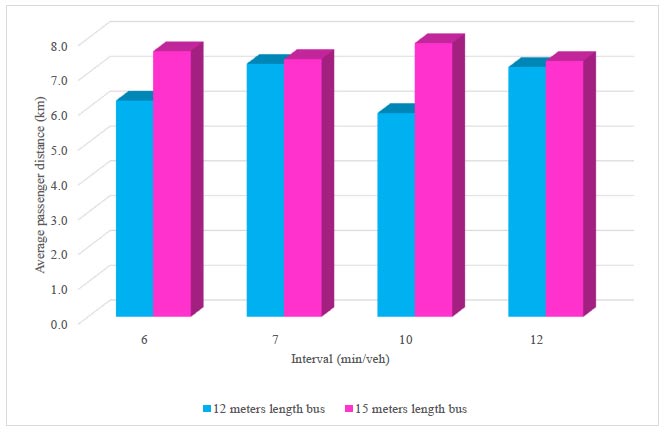
Average passenger distance (km).
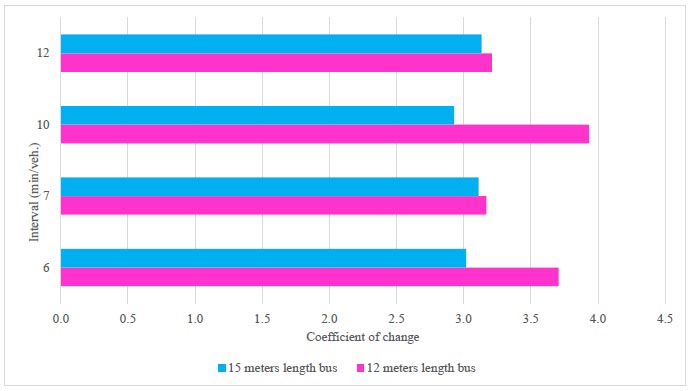
Coefficient of change.
With respect to the criterion of number of passengers transported per travelled kilometre (passenger- kilometres), Fig. (9) shows that the best option is to use a 15-metre bus with a 10-minute interval (frequency of 6 veh/hour).
Two indicators related to the criterion of the number of passengers transported per traveled kilometer (passenger-kilometres) expressing the productivity of the transport process [4] have been calculated. These indicators are the average distance a passenger is transported and the coefficient of change of the route, i.e. how many times vehicle capacity is used during a trip. As shown in Figs. (10 and 11) for both indicators, the best option is a 15-metre length bus with an interval of 10 minutes/veh.
The criteria developed in this work have among their benefits that they can be applied in near real-time to public transport routes with realistic bus sizes, obtaining a comprehensive evaluation of the efficiency of the passenger transport process, allowing to make decisions in the operation of the system.
CONCLUSION
Choosing criteria for evaluating the effectiveness of the passenger transportation process is a complex challenge that requires considering various aspects to ensure passenger comfort, safety, and efficient transport. It is crucial to consider the specific objectives and requirements of passenger transport, as well as the operating conditions of the vehicles. To address this issue, additional research and analysis are necessary to determine the most suitable criteria for specific conditions. This includes considering vehicles with smaller capacities, accommodating fluctuating demands, and other relevant factors.
Our experiment was conducted on a real case in Havana. Several scenarios were modeled by combining different factors in order to evaluate the applicability of the proposed criteria. Additionally, to better assess the potential impact of smart technology implementation on the social costs of public transport, we have analyzed cost savings in driver fees due to automation, travel time uncertainty, regularity of waiting time, congestion factors, the value of savings in denied boarding, as well as user and operator-centered designs.
Overall costs are reduced with longer buses at lower intervals (increased frequency), as well as costs associated with extended waiting times due to denied boarding.
The highest values of passenger-kilometers are obtained with larger buses, where the average passenger distance is greater, resulting in a smaller coefficient of change.
The results show that due to external factors related to overcrowding, the total cost decreases at the same rate for both 12-meter and 15-meter buses at different intervals, while the number of passengers transported per kilometer increases at a faster rate for larger-size buses. Hence, larger size buses operate at lower occupancy rates, which improves the quality of service through less overcrowding and lower waiting costs. In addition, the use of larger-sized buses can significantly reduce or eliminate boarding denials. Thus, larger buses can be economically viable, even with fewer passengers than smaller buses, resulting in a significant improvement in the quality of the service.
AUTHOR’S CONTRIBUTION
It is hereby acknowledged that all authors have accepted responsibility for the manuscript's content and consented to its submission. They have meticulously reviewed all results and unanimously approved the final version of the manuscript.

