All published articles of this journal are available on ScienceDirect.
Investigating Real-world Emissions from Liquefied Petroleum Gas-fueled Vehicles: A Modeling Approach that Utilizes Portable Emissions Measurement Systems
Abstract
Introduction
The study presents an analysis of the emissions data from an LPG-fueled vehicle, focusing on key exhaust components. CO2, THC, and NOx. Data were aggregated from road tests conducted using a Portable Emissions Measurement System (PEMS). Subsequently, the impact of various factors, including vehicle speed, engine load, and engine RPM, on the generated emissions was investigated.
Methods
In addition, the methodology for developing emission models, particularly for THC in LPG vehicles, is outlined. The results demonstrate the feasibility of creating reliable and robust emission models characterized by low mean squared error (MSE) and high R2 values.
Results
These findings contribute to a better understanding of the relationship between operational parameters and emissions, providing valuable information for emissions control strategies in vehicles powered by LPG. Research highlights the potential of data-driven approaches to improve environmental assessments and promote cleaner vehicle technologies.
Conclusion
The findings may prove useful in formulating emission reduction strategies and advancing technologies to reduce the environmental impact of LPG-powered vehicles.
1. INTRODUCTION
The growing global interest in actions aimed at reducing exhaust emissions has led to intensive research into alternative fuels and technologies that can help reduce the negative environmental impact of the automotive sector [1-3]. One fuel that is gaining popularity is liquefied petroleum gas (LPG), which produces fewer pollutants compared to traditional fuels such as gasoline and diesel [4, 5]. Due to its lower cost and widespread availability, LPG is widely used in both passenger and commercial vehicles [6, 7].
LPG, also known as autogas, is a mixture of propane and butane and is widely used as a fuel alternative to gasoline and diesel [8, 9]. LPG has a favorable emission profile, producing lower amounts of harmful substances such as nitrogen oxides (NOx), particulate matter (PM) and carbon dioxide (CO2) [10, 11]. Its combustion properties allow LPG to reduce pollutant emissions in urban environments, making it a more environmentally friendly fuel. Furthermore, LPG is cheaper than traditional fuels, leading to lower operating costs for vehicles, especially in commercial fleets [12, 13]. Although LPG has a lower energy density compared to gasoline, it is widely applied in passenger and commercial transport, as well as urban logistics, and is a key element in efforts to reduce emissions from the transportation sector [14, 15].
This work addresses the issue of emissions analysis of an LPG-powered vehicle and explores aspects of exhaust emissions modeling for such vehicles. Data collection is carried out using a portable emission measurement system (PEMS). Emission modeling for LPG-powered vehicles is essential for several reasons. First, in the face of growing global concerns about air quality and climate change, understanding emission profiles for vehicles that use alternative fuel sources, such as LPG, is critical to formulating effective environmental policies. LPG is recognized as a fuel with lower carbon dioxide (CO2) and particulate emissions compared to conventional gasoline or diesel, making it a promising option for reducing greenhouse gas emissions [16-18]. However, precise emission modeling is necessary to quantify these benefits under real-world driving conditions, which can differ significantly from laboratory tests [19-21]. Furthermore, the use of portable emission measurement systems (PEMS) allows for a comprehensive and continuous monitoring of emissions during actual vehicle operation, providing valuable data to improve existing models and improve their predictive accuracy [22, 23]. This approach not only supports regulatory compliance, but also informs stakeholders, including manufacturers, policymakers, and consumers, about the environmental performance of LPG-powered vehicles, contributing to their wider adoption as part of a sustainable transportation strategy.
Despite numerous laboratory studies on emissions from vehicles powered by LPG, actual pollutant emissions under real-world driving conditions remain a research challenge [24]. Various road conditions, driving styles, and dynamic changes in urban traffic can significantly impact emission levels [25, 26]. Therefore, the analysis of real-world emissions under different driving conditions is essential for a comprehensive understanding of the environmental impact of LPG.
A research aims to compare and evaluate exhaust emissions from a Euro 4 petrol engine vehicle operating on both gasoline and liquefied petroleum gas (LPG) [27]. Using an exhaust gas analyzer, the study emphasizes the importance of monitoring emissions and examines how fuel type affects emissions under various driving conditions, following the Real Driving Emissions (RDE) testing standard. The findings indicate that while gasoline combustion leads to higher emissions of carbon monoxide (CO) and carbon dioxide (CO2), combustion of LPG results in elevated levels of hydrocarbons (HC) and nitrogen oxides (NOx), illustrating the practical impact of fuel choice on environmental emissions.
Another study related to the analysis of LPG vehicle emissions was conducted [28]. This work investigates the conversion of a conventional 2-liter gasoline hybrid electric vehicle (HEV) to a liquefied petroleum gas direct injection hybrid electric vehicle (LPDI-HEV) as part of global efforts to achieve carbon neutrality and evolving emission regulations. The experimental results reveal that while LPDI-HEV provides engine output and CO2 emissions comparable to traditional gasoline HEVs, it significantly reduces particulate number (PN) emissions, proving more economical in urban taxi applications and showcasing its potential as a sustainable transition technology.
In terms of modeling exhaust emissions for LPG-powered vehicles, a relevant study is [29]. This research presents a new methodology to develop microscale CO2 emission models specifically for LPG vehicles, addressing the limited computational models available in this field. Using data from road tests conducted with a portable emission measurement system (PEMS) and the on-board diagnostic interface (OBDII), the model utilizes gradient-boosting machine learning techniques, achieving good precision with an R2 value of 0.61 and a mean squared error (MSE) of 0.77. This makes it suitable for analyzing continuous CO2 emissions and creating emission maps for urban environmental assessments.
However, the literature indicates gaps in the methodology for emissions modeling, particularly a lack of studies on modeling THC emissions from LPG-powered vehicles [30, 31].
This article analyzes the real-world emissions of an LPG-powered vehicle using a portable emission measurement system (PEMS). This system enables real-time emission measurements under various road conditions, providing accurate data on emissions such as nitrogen oxides (NOx), carbon dioxide (CO2) and hydrocarbons (THC). The study was carried out under various driving conditions, including urban, suburban, and highway driving, allowing an assessment of how real world operating conditions affect the emission levels of LPG-powered vehicles. Vehicle operational data was aggregated into various clusters, such as vehicle speed and engine RPM.
The objective of this study is not only to evaluate emissions under different driving conditions, but also to present a methodology to analyze these data to develop a machine learning model to predict THC emissions for LPG-powered vehicles. This will be the first model available for an LPG-powered vehicle in the literature.
The paper consists of a “Materials and Methods” section, which describes the research equipment used, the study subject, and the research area. This section also characterizes the computational and data analysis techniques applied to develop emission models for the LPG-fueled vehicle. The subsequent sections present the research results, including aggregate emissions data for CO2, THC, and NOx, as well as exploratory data analysis (EDA) and emission modeling results. The paper concludes with a “Discussion” and “Conclusion” section, which outline the main findings and compare them with results from other studies.
2. MATERIALS AND METHODS
The overall workflow is presented in Fig. (1). The process consists of two steps. The first involves analyzing emissions data from harmful exhaust components obtained from road tests for a selected LPG-powered vehicle. This data is then subjected to exploratory data analysis to identify the optimal set of predictors for the THC emissions model. Next, the study presents the methodology for creating a THC emissions model for the LPG-powered vehicle using machine learning techniques.

General workflow.
The vehicle used in this study is a 2014 model that meets Euro 6 emission standards, ensuring compliance with stringent environmental protection requirements. It is equipped with a 1,149 cm3 spark ignition engine designed to operate on both gasoline and liquefied petroleum gas (LPG). The engine delivers a maximum power output of 55 kW at 5,500 rpm and a torque of 105 Nm at 4,250 rpm, providing suitable performance under various operating conditions. The vehicle features a five-speed manual transmission and a multipoint fuel injection (MPI) system, which improves fuel efficiency and reduces pollutant emissions. In addition, the inclusion of a three-way catalytic converter (TWC) further contributes to the reduction of harmful substances in the exhaust gases. The total weight of the vehicle is 980 kg. Fig. (2) shows a simplified diagram of the tested LPG-powered vehicle with a portable emissions measurement system (PEMS) and OBD II interface to measure operational parameters.
For the tests carried out, a Portable Emission Measurement System (PEMS) was used, allowing an accurate and direct analysis of real-world vehicle emissions under actual road conditions. This system is equipped with advanced sensors that monitor levels of various pollutants, such as nitrogen oxides (NOx), hydrocarbons (HC), and carbon dioxide (CO2) [32-34]. Using PEMS technology, real-time measurements can be taken, providing precise data on emissions in different driving conditions, including urban, suburban, and highway scenarios [35]. The mobility of the PEMS enables its application in various locations and driving scenarios, which is a significant step toward a better understanding of the impact of external factors on emissions from LPG-powered vehicles [36].
Data analysis was carried out in the Google Colab environment, which facilitates the efficient processing of large data sets and provides access to advanced analytical tools [37, 38]. Using this platform, hydrocarbon (THC) emissions modeling was performed on the basis of data collected via PEMS measurements. Google Colab, with its access to cloud computing resources, enabled the use of Python and popular analytical libraries such as Pandas, NumPy, and Scikit-learn for data analysis and predictive model development [39, 40].
The first stage of the presentation of the results includes an overview of CO2, THC and NOx emissions relative to vehicle speed. In the second stage, the emission results are compared with the engine load parameters. The third stage presents emissions in relation to the speed of the engine. To allow further data analysis, pair plots and a correlation matrix of selected operational parameters of the LPG-powered vehicle tested were prepared. Finally, the methodology for developing a THC emission model for this vehicle is discussed.
3. RESULTS
3.1. Operating Parameters of an LPG Vehicle and Generated Exhaust Emissions
In the first stage of the study, an analysis of CO2, THC and NOx emission data was carried out in relation to vehicle speed. Data were grouped into three categories: low, medium, and high speeds. This classification is intended to reveal the driving characteristics under which the highest accumulation of average emissions from the LPG-powered vehicle occurs. The results are presented in Figs. (3, 4, and 5).
Analysis of pollutant emission graphs in relation to vehicle speed indicates a varied impact of speed on the emission levels of different substances. CO2 emissions show an upward trend with increasing speed, reaching their highest levels at high speeds (more than 80 km/h), suggesting intensified fuel combustion at higher speeds. Meanwhile, THC emissions, although relatively low at low and moderate speeds, increase dramatically at speeds above 100 km/h, possibly due to less efficient fuel combustion under high engine loads. For NOx emissions, the highest levels are observed at moderate speeds (40 to 80 km / h), with emissions decreasing at high speeds. This may result from combustion conditions that favor NOx production at moderate speeds, whereas higher speeds seem to reduce these emissions. These findings demonstrate that vehicle speed affects the levels of specific pollutants emission in different ways, which is relevant for emission reduction strategies in road transportation.
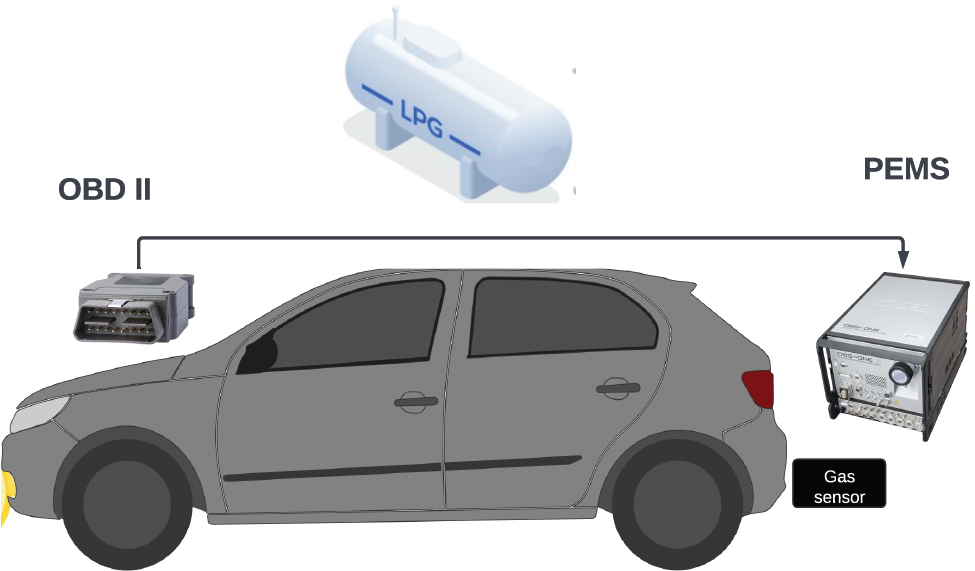
Simplified diagram of the LPG vehicle tested with installed PEMS.
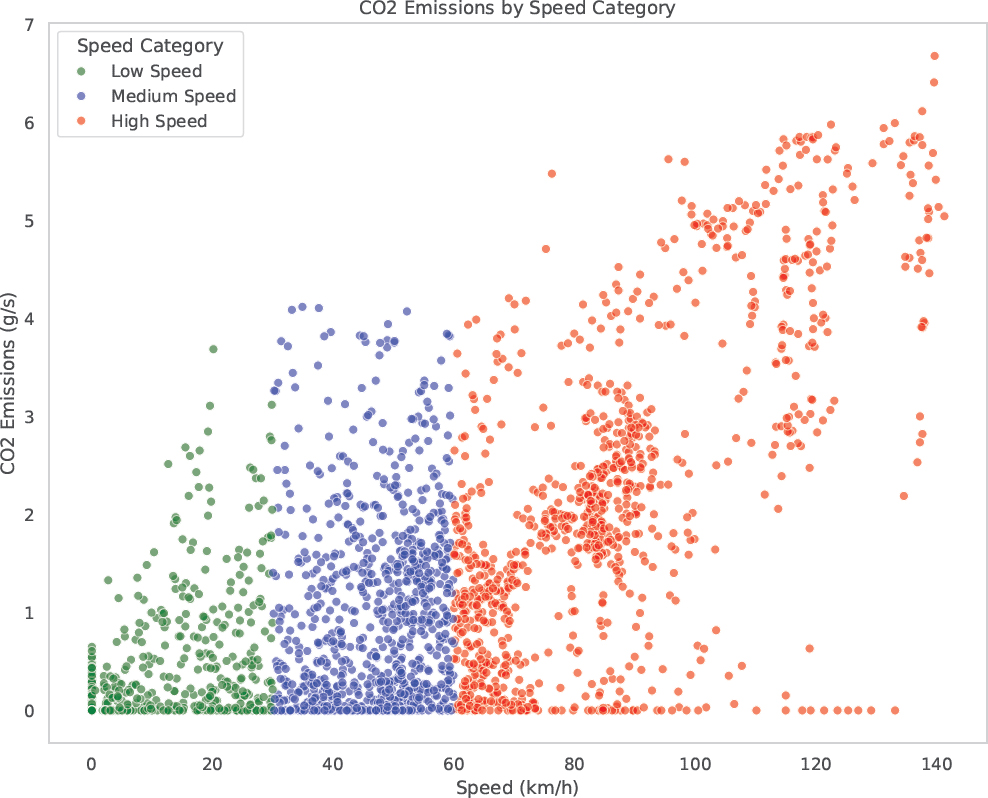
CO2 emissions relative to the speed parameter of an LPG vehicle.
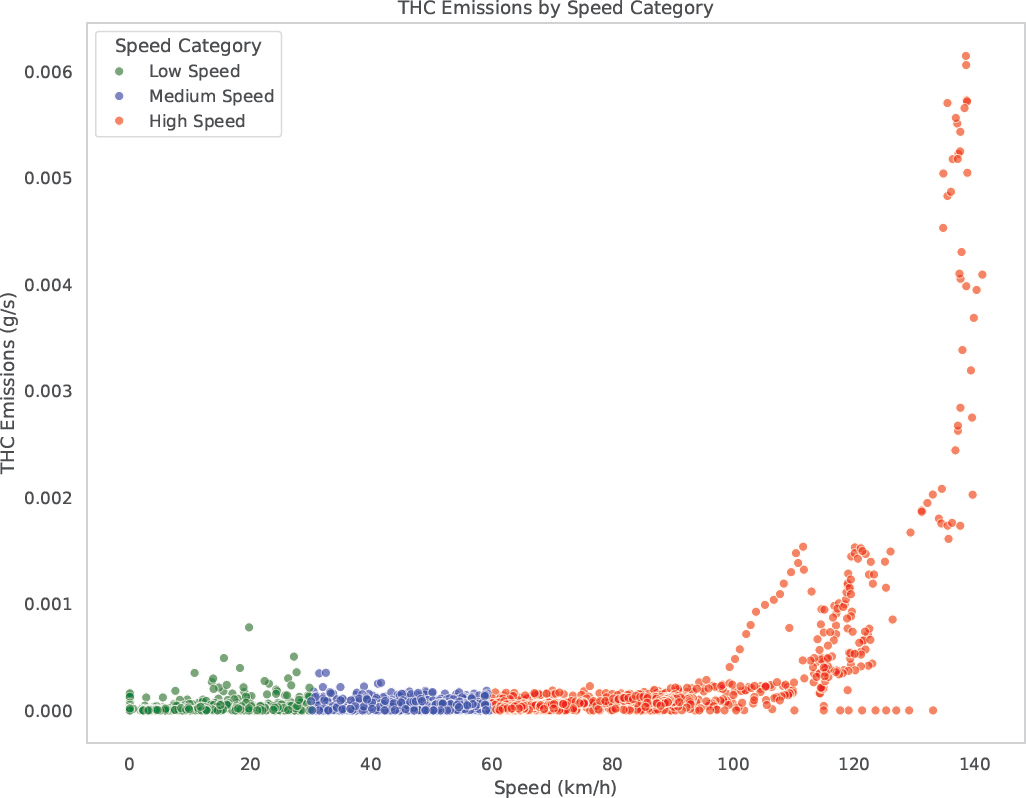
THC emissions relative to the speed parameter of an LPG vehicle.
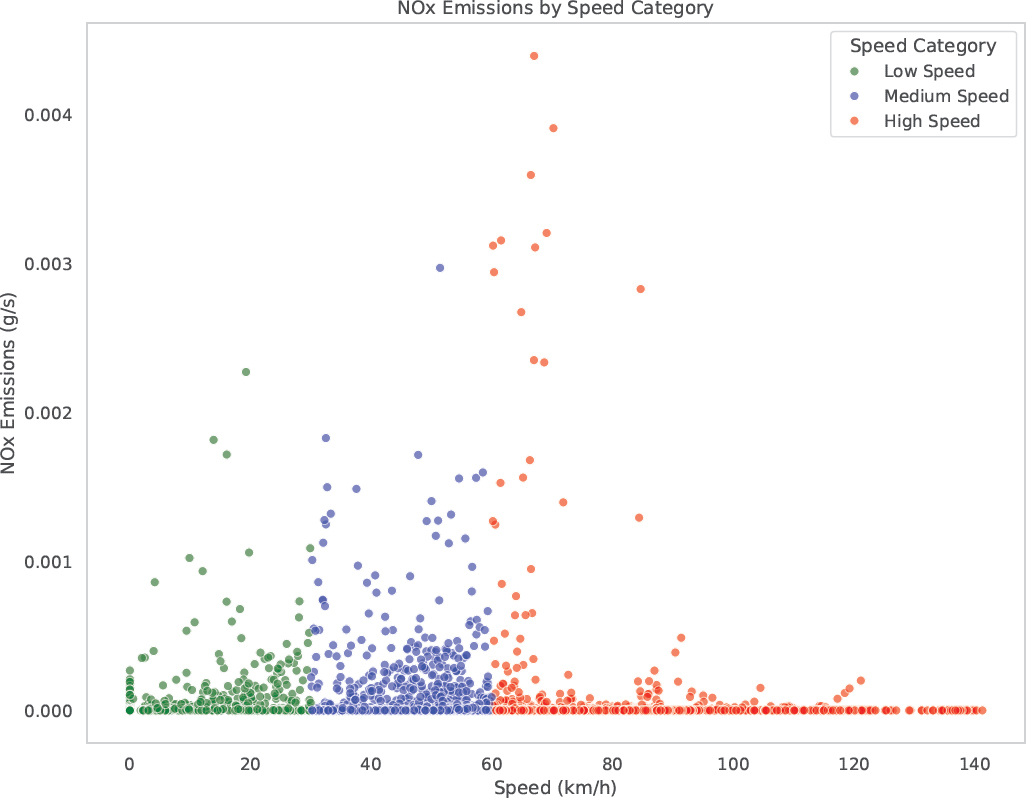
NOx emissions relative to the speed parameter of an LPG vehicle.
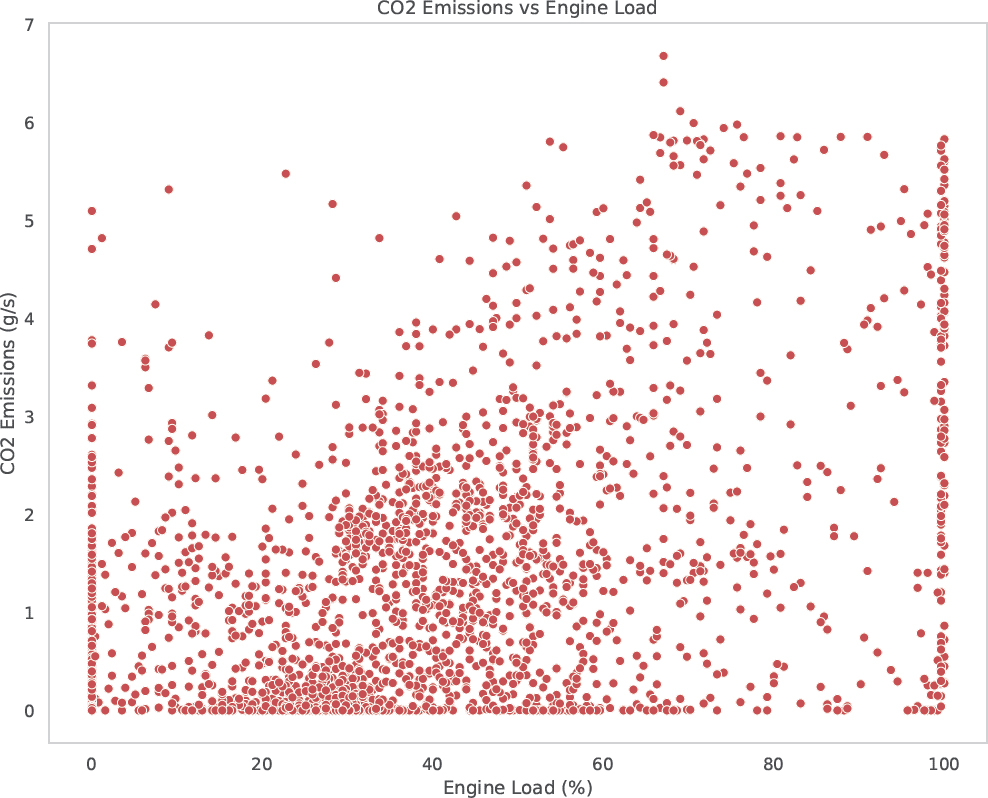
CO2 emissions relative to the engine load parameter of an LPG vehicle.
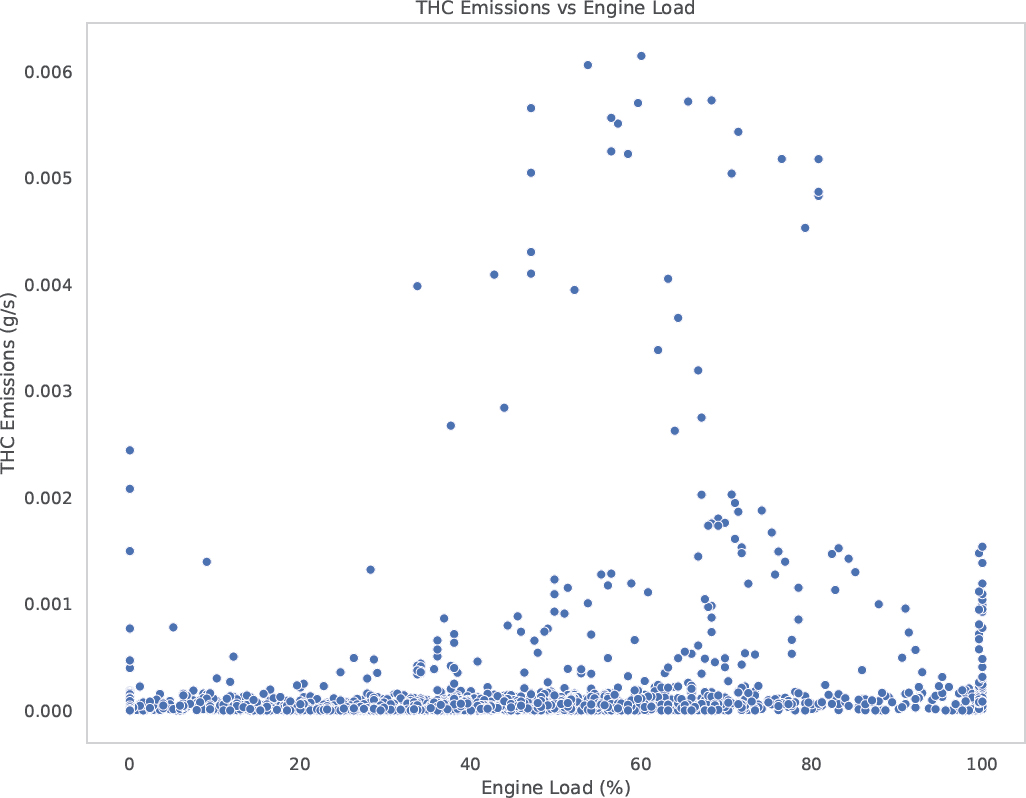
THC emissions relative to the engine load parameter of an LPG vehicle.
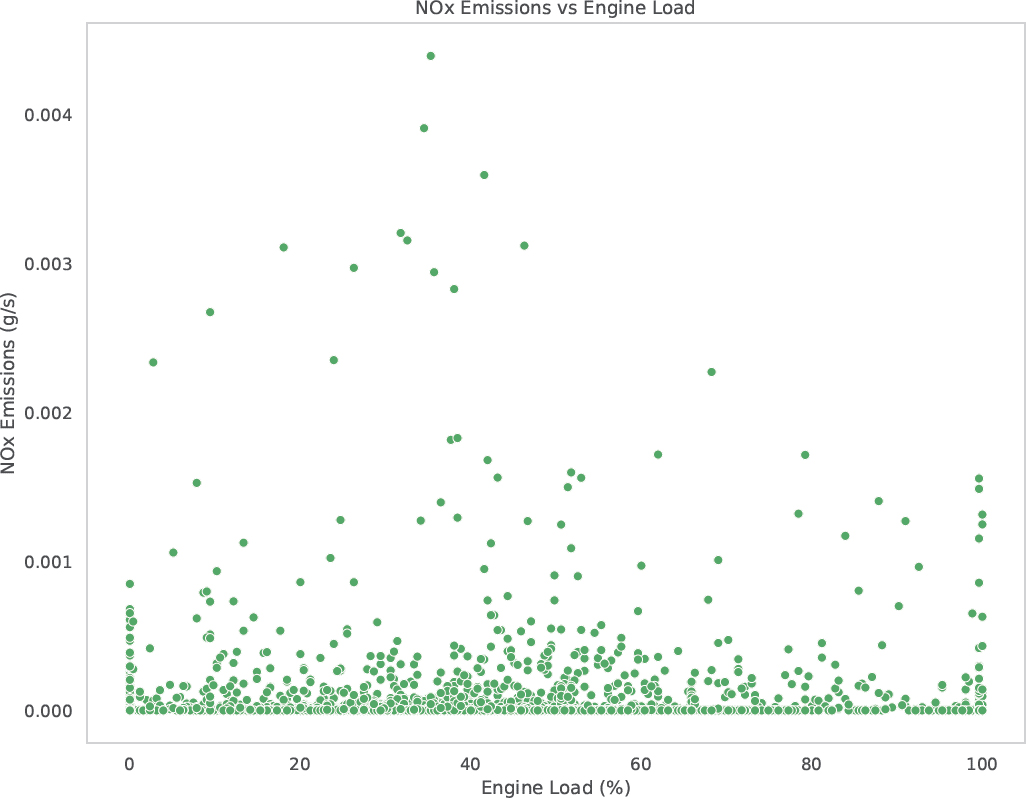
NOx emissions relative to the engine load parameter of an LPG vehicle.
The next parameter analyzed was the engine load in relation to exhaust emissions, with the results presented in Figs. (6, 7, and 8).
Analysis of pollutant emission graphs as a function of engine load shows that varying load levels distinctly affect the emissions of CO2, THC and NOx. CO2 emissions exhibit an increasing trend, reaching a peak at maximum engine load, indicating a direct relationship between fuel consumption and greenhouse gas emissions. On the contrary, THC emissions are highest at moderate engine loads (40–60%), which can result from less efficient fuel combustion under these conditions, leading to incomplete hydrocarbon oxidation. On the other hand, NOx emissions reach their peak values at moderate engine loads, decreasing at both very low and very high loads, potentially due to optimal combustion temperatures that favor nitrogen oxide formation at moderate load levels. These findings reveal that the levels of specific pollutants' emission depend highly on engine operating conditions, a factor crucial to the development of effective emission reduction strategies for motor vehicles.
The next parameter studied was the speed of the engine and its influence on the pollutant emissions of the LPG-fueled vehicle. The engine speed was classified into three categories: low, medium, and high. The results of the CO2, THC and NOx emissions based on this operating parameter are shown in Figs. (9, 10, and 11).
Analysis of pollutant emissions in relation to engine speed (RPM) reveals distinct differences in CO2, THC and NOx emissions across RPM categories. CO2 emissions increase with higher RPM, reaching their maximum at high speeds, indicating intensified fuel combustion at elevated engine speeds. THC emissions remain low at low and moderate RPM but rise sharply at high RPM (above 3000 rotations per minute), likely due to incomplete combustion under higher load conditions. In contrast, NOx emissions peak at moderate RPM (around 2000 RPM) and decrease at high RPM, suggesting that combustion at moderate engine speeds creates optimal conditions for nitrogen oxide formation, while higher speeds may reduce this effect. These findings indicate that pollutant emissions are closely related to engine RPM, highlighting the need to consider specific emissions behavior at various RPM levels to develop effective emission reduction strategies for vehicles.
3.2. EDA for Data as Input for Subsequent Analyses and Machine Learning Model Development
Exploratory data analysis (EDA) is a process used to gain a deep understanding and preliminary analysis of a data set before building a machine learning model [41, 42]. Performing EDA helps to uncover the structure and characteristics of the data, as well as to identify issues such as missing data, outliers, inconsistencies, and potential anomalies [43, 44]. EDA also enables the discovery of important patterns and relationships between variables, which is invaluable when selecting appropriate features for modeling [45, 46]. Additionally, this process aids in data preparation, allowing scaling, cleaning, and the creation of new variable types of features, which ultimately improves model performance [47, 48]. A pair plot is also utilized as part of EDA, providing a visual examination of relationships between pairs of numerical variables in the data set. The pair plot allows for the assessment of variable distributions along the diagonal and helps identify outliers, offering a comprehensive view of the data and any potential issues that may impact analysis and modeling results.
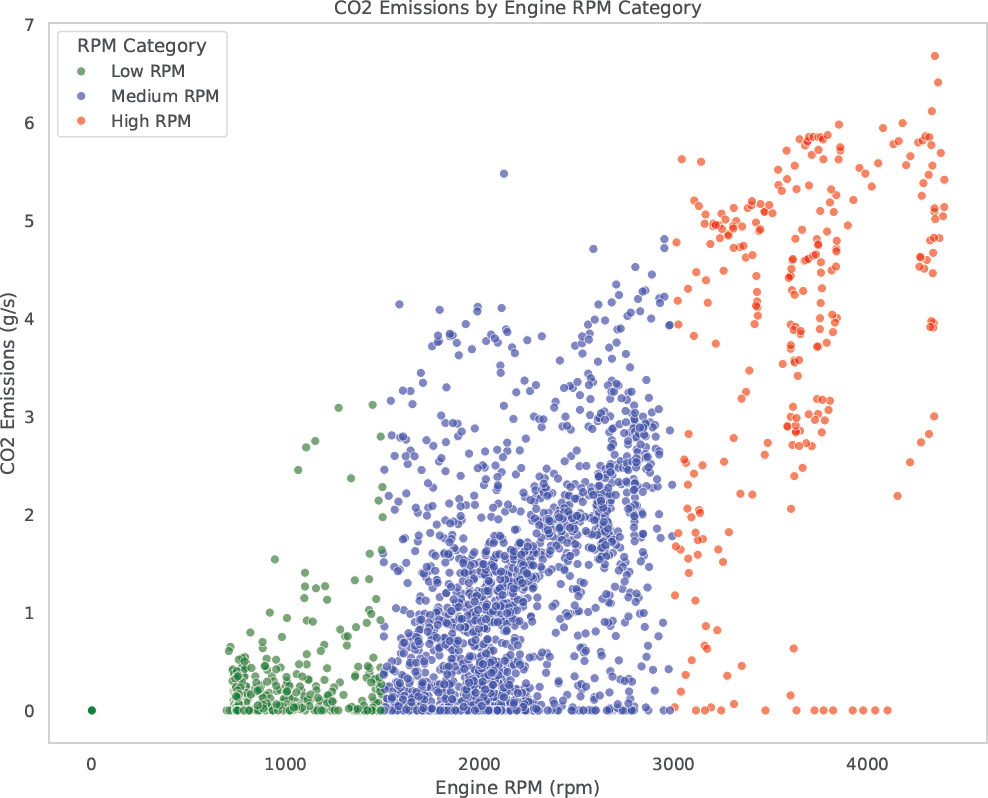
CO2 emissions relative to the engine RPM parameter of an LPG vehicle.
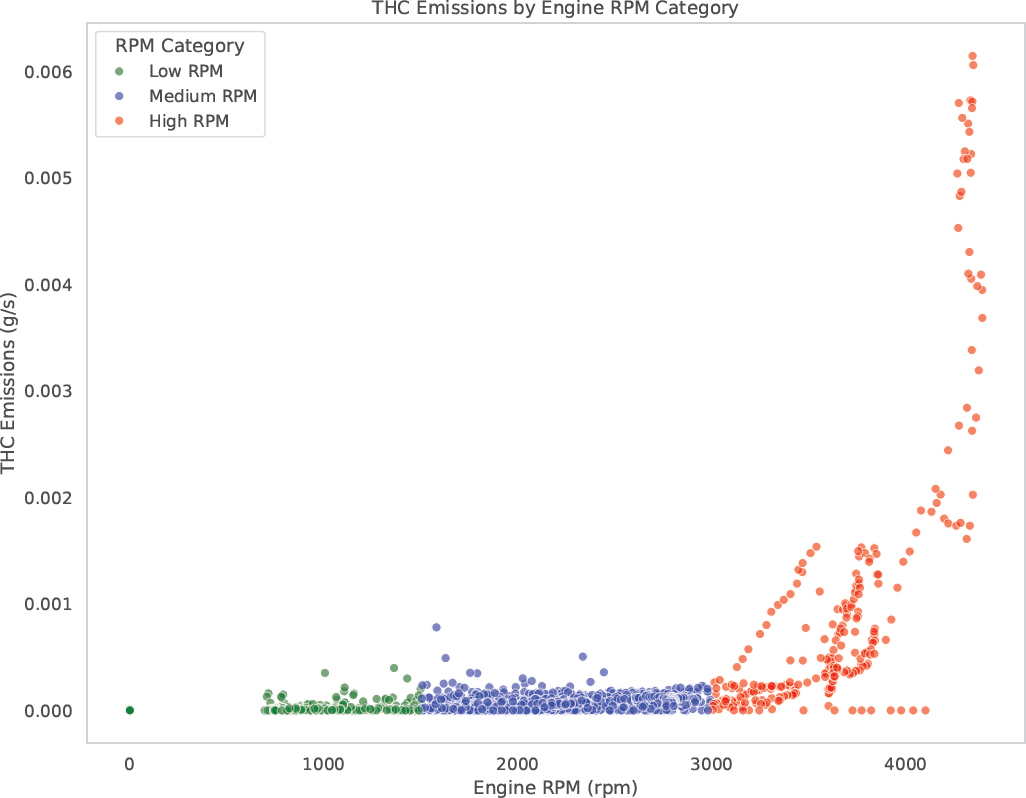
THC emissions relative to the engine RPM parameter of an LPG vehicle.
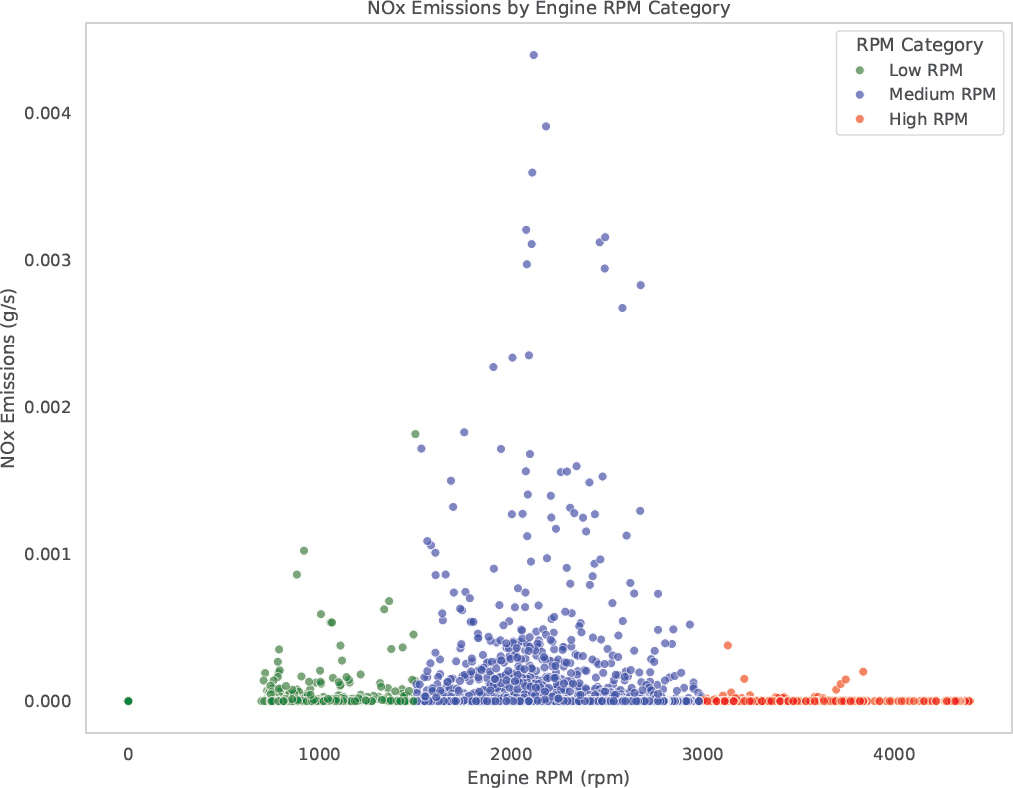
NOx emissions relative to the engine RPM parameter of an LPG vehicle.
The pair plot for the emission data and selected engine parameters is shown in Fig. (12).
Fig. (12) shows the relationships between the selected engine parameters and exhaust emissions in LPG-powered vehicles and serves as an example of a pair plot used in exploratory data analysis (EDA). This type of graph allows for the quick identification of potential relationships and correlations between variables, which is important when analyzing emissions. Along the diagonal, we see the distributions of individual variables: the engine RPM distribution is multimodal, which may suggest different engine operating modes, while the speed (Speed) distribution is right-skewed, indicating that most observations come from lower speeds. CO2 emissions are concentrated at lower values, with some higher deviations, while THC and NOx emissions are strongly concentrated around very low values, suggesting that their emissions are often minimal or very low. Analysis of relationships between variables shows that engine RPM is strongly correlated with vehicle speed – the higher the RPM, the higher the speed. Both RPM and speed also show a positive correlation with CO2 emissions, which is in line with intuition, as higher RPM and speed are associated with increased fuel consumption and higher CO2 emissions. In the case of THC and NOx emissions, the relationship between speed and RPM is less pronounced, although THC emissions increase at higher RPM and speed values, while NOx emissions occur primarily at lower speeds and RPM. The relationships between different emissions also provide interesting insights – THC emissions appear to increase with CO2 emissions, while NOx emissions are more dispersed and may depend on specific engine operating conditions.
The correlation heat map plays a crucial role in exploratory data analysis (EDA) during the development of predictive models, as it allows the quick identification of relationships between variables [49, 50]. This visualization helps detect highly correlated variables, which may be redundant – an essential step, as an excess of correlated features leads to information duplication, increased model complexity, and the risk of overfitting [51, 52]. Correlation analysis enables the selection of the most relevant features, allowing one of the strongly correlated variables to be removed in favor of the one with a stronger relationship to the target variable. Additionally, the correlation heatmap offers better insight into the data structure and intervariable dependencies, supporting the choice of algorithm and approach to feature engineering. It also facilitates the early detection of issues such as multicollinearity, which can affect the stability and interpretability of the model, especially in linear regression contexts [53, 54]. Fig. (13) presents the correlation heatmap for emission data and selected vehicle measurement operational parameters.
Fig. (13) shows a correlation matrix that illustrates the strength and direction of relationships between various variables related to emissions and engine parameters in LPG-powered vehicles. Each cell in the matrix contains a correlation coefficient (ranging from -1 to 1), represented by color: from shades of red (for strong positive correlations) to blue (for negative correlations). Analyzing the relationships, we can observe that CO2 emissions have
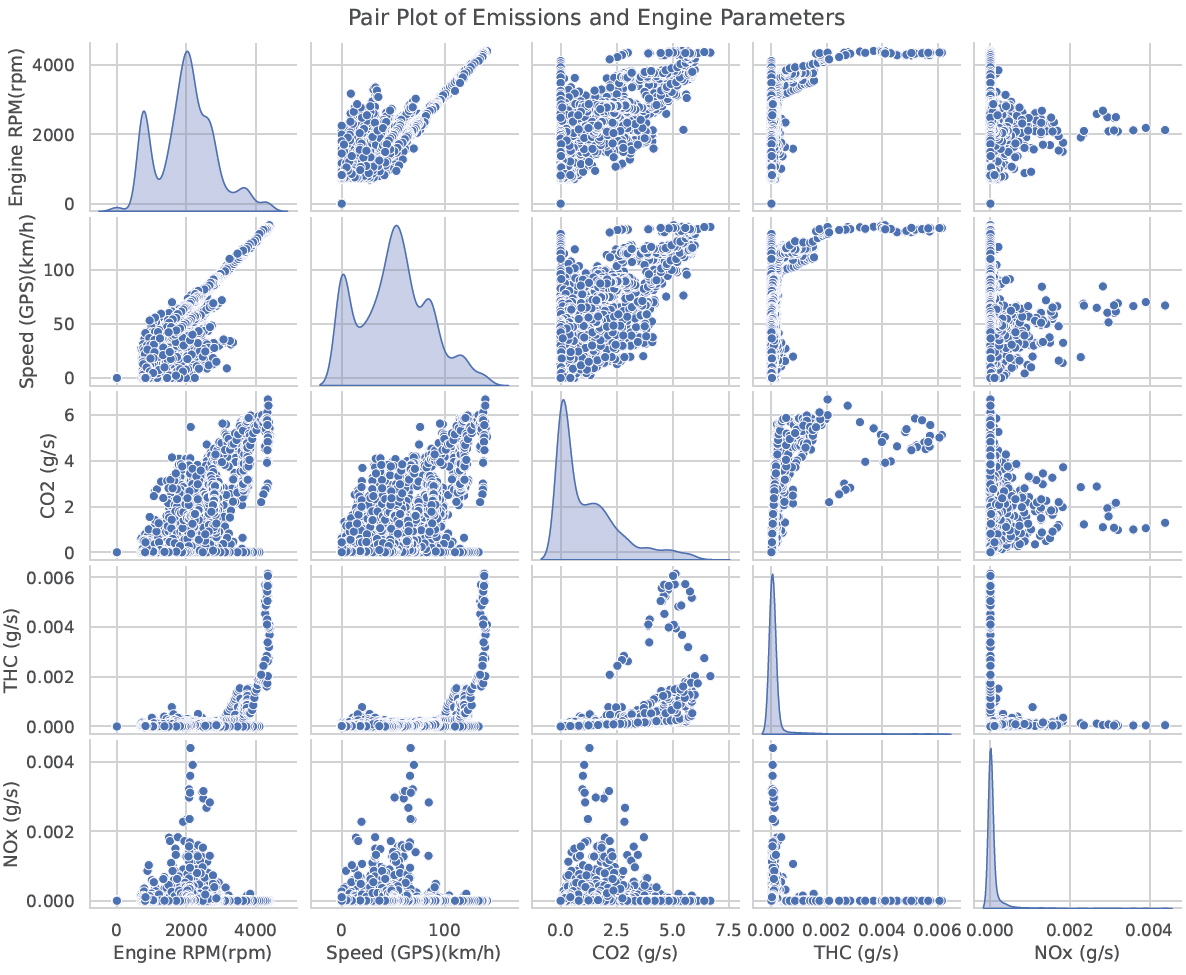
A pairplot chart for emission data and selected operating parameters of an LPG vehicle.
a strong positive correlation with GPS speed (0.68), engine RPM (0.72) and throttle position (0.63), indicating that higher values of these variables are associated with higher CO2 emissions. THC emissions show a moderate correlation with GPS speed (0.43) and engine speed (0.47), suggesting that increases in THC are also associated with more intense engine operation, although this relationship is weaker than that of CO2. In contrast, NOx emissions do not show significant relationships with other variables, which may indicate that their values depend on more complex factors independent of simple engine operation parameters. Engine operation parameters also display strong correlations among themselves: The GPS speed is strongly positively correlated with the engine RPM (0.90), confirming that higher driving speeds are typically associated with higher RPMs. The engine load is clearly correlated with the throttle position (0.83), which is logical, as a larger throttle opening is associated with a higher engine load.
Based on Figs. (12 and 13), the GPS speed and engine RPM variables were selected for the example construction of the THC emission model for the vehicle powered by LPG.
3.3. Creating a THC Emissions Model for an LPG Vehicle
To predict total hydrocarbon emissions (THC) based on GPS speed and engine RPM data, a machine learning approach was employed. The process began with the import of the necessary libraries, such as pandas, numpy, matplotlib, and scikit-learn, which facilitate data manipulation, result visualization, and model creation. The data were then loaded from a CSV file, allowing for preliminary analysis.
Two key attributes for the model were selected: GPS speed (in km/h) and engine RPM, with THC assigned as the target variable. The data was then split into training and test sets in an 80/20 ratio, a standard practice in data analysis that allows for the evaluation of model performance on unseen data.
To predict THC values, a random forest regression model was used, known for its high effectiveness in regression problems. Random Forest Regressor is an algorithm from the family of random forests that uses ensembles of decision trees to predict continuous values. It is an ensemble learning method that combines the results of multiple decision trees to achieve more accurate and stable predictions [55, 56]. In this model, each tree is trained on a different subset of data and features, reducing model variance and protecting against overfitting [57-59]. The model was trained in the training set, allowing it to learn the patterns present in the data. After completing the training process, predictions were made on the test set, allowing the evaluation of the model quality. The results were promising, with a mean squared error (MSE) of 1.69e-08 and a determination coefficient (R2) of 0.9015. The R2 value indicates that the model explains approximately 90.15% of the variability in the THC data, suggesting that the model is well adapted to the data.
The model validation results, presented through a histogram and an actual vs. predicted plot, are shown in Fig. (14). These plots confirm the high effectiveness of the THC prediction model for the LPG-powered vehicle.
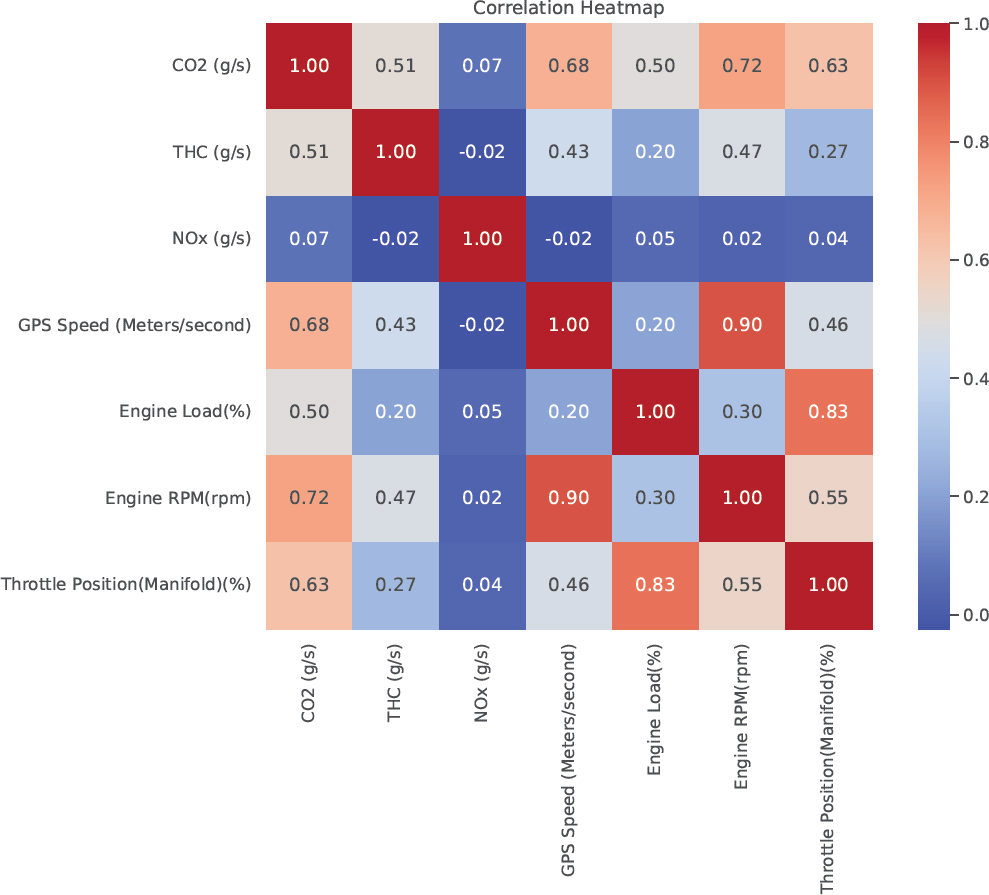
Correlation heatmap for analyzed vehicle parameters.
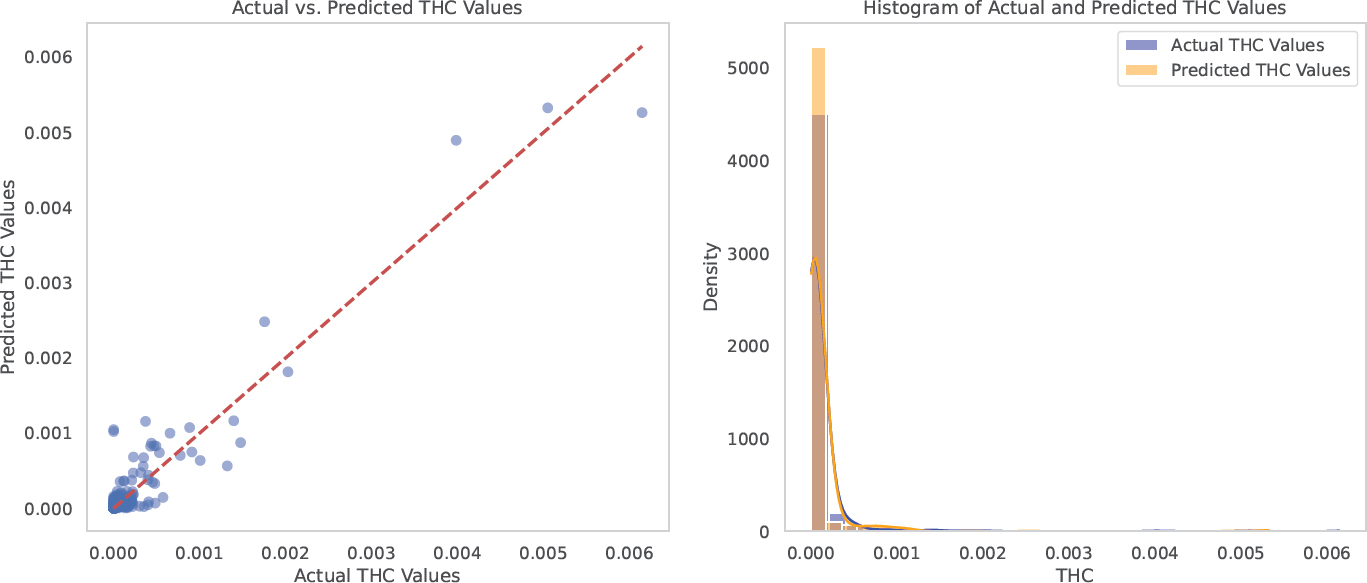
Actual vs. predicted THC emission values with histogram.
Fig. (14) presents an analysis of the results of the THC emission prediction using a predictive model. The plot on the left illustrates the comparison between the actual THC values and those predicted by the model. The values are distributed around the dashed line, which represents perfect agreement (y = x); the closer the points are to this line, the better the alignment between the predictions and the actual values. Most points are close to the line, indicating that the model predicts THC emissions well, although some minor deviations occur at higher actual values, suggesting slight prediction errors for extreme emission values. The right plot shows a histogram of the actual and predicted THC values, allowing an assessment of the distribution alignment between these two data sets. Both distribution lines are highly concentrated around very low THC values, which is in line with the nature of THC emissions (high values are rare). The actual and predicted distributions are almost identical, further confirming that the model accurately captures the characteristics of THC emissions in the data.
4. DISCUSSION
The results of the analysis of the emission data from LPG-powered vehicles provide significant information on the relationships between operational parameters and exhaust emissions. Studying CO2, THC, and NOx emissions in the context of factors such as vehicle speed, engine load, and engine RPM reveals clear patterns that are crucial to understanding the emission behavior of LPG vehicles under various driving conditions.
The analysis showed that CO2 emissions increase with higher vehicle speeds, particularly at speeds exceeding 80 km/h, which is consistent with expectations for fuel combustion efficiency. This trend suggests that higher speeds lead to increased fuel consumption and, consequently, to increased CO2 emissions. In contrast, THC emissions show a significant increase at speeds greater than 100 km/h, indicating a potential decrease in combustion efficiency and the onset of incomplete combustion under high engine loads. This underscores the need for improved combustion control mechanisms in LPG vehicles, especially during high-speed driving.
The analysis of engine load further illustrates emission profiles. The results indicate that THC emissions peak at moderate engine loads (40-60%), which may suggest suboptimal combustion conditions that require further tuning of the engine management system. However, NOx emissions reach their highest values at intermediate loads, consistent with the temperature dependence of NOx formation during combustion.
The application of machine learning techniques, particularly random forest regression, in emission modeling yielded promising results. The low mean squared error (MSE) and the high coefficient of determination (R2) suggest that the model effectively captured the patterns in the data. This indicates that machine learning approaches can serve as valuable tools to predict emissions based on operational parameters, potentially facilitating the development of real-time monitoring systems for LPG vehicles. Such conclusions can also be drawn from similar work for other vehicles powered by other fuels [60-62].
The literature on the analyzed topic reveals gaps in the modeling of emissions for LPG-powered vehicles [63]. Another study focuses on the conversion of gasoline engine vehicles to LPG, highlighting the ecological and economic benefits of this fuel. This article details the gas injection system installation process, its calibration and road testing to compare the performance of vehicles using conventional and alternative fuels. Differences compared to the presented work include a focus on the conversion process and calibration of the LPG system, while the current work concentrates on the analysis of emission data from LPG-powered vehicles and THC emission modeling based on speed and engine RPM.
Another study [64] focuses on emissions from LPG-powered vehicles under real driving conditions (RDE) using portable emissions measurement systems (PEMS), examining the emissions of harmful substances and CO2 from a Dacia Duster 1.0 TCe 100 ECO-G running on Eurosuper 95 gasoline and LPG. The research aimed to determine the emission levels according to the RDE procedure and to compare the results for both types of fuel. Another study [29] focuses on methods for reducing CO2 emissions from vehicle exhaust systems through the use of LPG, considering its widespread use in European countries such as Poland, Romania and Italy. The authors present an innovative methodology to create microscale CO2 emission models for LPG-powered vehicles, using data from road tests and OBDII diagnostic interfaces. Differences compared to the presented work include the application of gradient machine learning to analyze data and predict CO2 emissions, while the current work focuses on modeling THC emissions with respect to speed and engine RPM.
There are significant gaps in the literature on LPG vehicle emission modeling, particularly on the application of machine learning techniques [65, 66]. The work is timely because it uses artificial intelligence algorithms for the emissions modeling process [67-70]. This work is one of the first to present a methodology for modeling THC emissions based on operational parameters such as speed and engine RPM.
The findings of this study are consistent with recent research on transportation and emissions modeling, which highlights the growing importance of integrating energy-saving approaches and advanced technologies in the context of smart cities. For example, Macioszek et al. [71] emphasized the need for multidisciplinary approaches to address global energy challenges in urban mobility systems, including the reduction of vehicular emissions through optimized traffic management. Similarly, Acuto et al. [72] demonstrated the importance of analyzing environmental performance in urban environments, where the use of simulation models such as VSP (Vehicle Specific Power) can provide insights into emission patterns and guide the design of more sustainable urban infrastructure. These studies support the need for comprehensive data-driven solutions, similar to the machine learning models applied in this research, which can predict emissions based on operational parameters.
Additionally, work [73] on modeling CO2 emissions from vehicles fueled with compressed natural gas underscores the growing need for microscale emission models, especially those considering real driving cycles. Such models can offer valuable benchmarks for our understanding of LPG vehicle emissions, as both CNG and LPG are often seen as alternative and environmentally friendly fuels. Furthermore, the increasing integration of artificial intelligence techniques in transportation energy modeling, as seen in the study [74] on electric vehicles, aligns with our use of machine learning to predict and optimize emissions, paving the way for the development of more sophisticated systems for real-time emission monitoring.
The broader context of these studies, which explore innovations in vehicular networks, energy savings, and environmental impacts, is reinforced by Al-Mekhlafi et al. [75, 76], who investigated the potential of vehicular ad hoc networks (VANETs) and fog computing to improve vehicle communication systems and optimize energy usage. These technologies could eventually complement emission reduction efforts by enabling real-time data sharing and improving vehicle performance tracking.
Although this study provides valuable information on the emission patterns of LPG-powered vehicles, there are several areas for future research that could further improve our understanding and contribute to emission reduction strategies. One of the primary limitations of the current study is that the data was sourced from a single vehicle model. This limits the generalizability of the findings, as different LPG vehicles may have different emission profiles depending on engine design, fuel system configuration, and emission control technologies. Future work should involve a wider set of vehicle models with varying engine configurations and emission control systems. This would help assess the consistency of observed trends across a more diverse range of LPG-powered vehicles and allow for a more accurate generalization of the emission predictions.
In addition, the current study focused primarily on the relationship between emissions and key operational parameters, such as vehicle speed, engine load, and engine RPM. While these parameters offer valuable information, further research could explore additional factors that influence emissions, such as ambient temperature, driving behavior (e.g., acceleration patterns and driving cycles), and fuel quality. Incorporating such variables into emission models could lead to more robust and realistic predictions, which would be especially valuable for real-time monitoring systems.
The application of machine learning models such as Random Forest in emission prediction has shown promise, but future work should explore the use of other advanced techniques, such as deep learning and neural networks, to further refine predictive accuracy. This could enable the development of more sophisticated models that account for complex, non-linear relationships between operational parameters and emissions. Additionally, the integration of real-time vehicle data from onboard diagnostics (OBD-II) systems could improve the models by incorporating dynamic driving conditions, providing a more comprehensive picture of emissions over time.
Another area of future exploration is the development of emission reduction strategies based on the findings of this study. Although the results suggest potential improvements in combustion efficiency, future work could include the testing of various optimization methods for LPG engine tuning. This could include the integration of adaptive control strategies that adjust engine parameters in real-time to minimize emissions based on current driving conditions.
In summary, this study emphasizes the critical need for continued research into the emissions profiles of LPG-powered vehicles and the effectiveness of various operational parameters that affect these emissions. Using advanced data analysis techniques, the automotive industry can strengthen its efforts to develop cleaner vehicle technologies, contributing to the broader goal of reducing greenhouse gas emissions and improving air quality.
CONCLUSION
The study provides valuable information on the impact of operational parameters on exhaust emissions from LPG-powered vehicles. Analysis of CO2, THC, and NOx emissions in relation to vehicle speed, engine load, and engine RPM revealed distinct patterns. CO2 emissions increased with speed, while THC emissions rose sharply at speeds above 100 km/h, indicating combustion inefficiencies under high engine loads. NOx emissions peaked at moderate speeds, highlighting the varying effects of driving conditions on emissions.
Regarding engine load, CO2 emissions increased with higher loads, while THC emissions peaked at moderate loads. NOx emissions showed a similar trend, peaking at moderate loads and decreasing at both lower and higher levels. The RPM of the engine had a clear impact, with CO2 emissions increasing at higher RPM, THC rising at high RPM and NOx peaking at moderate RPM. Machine learning models, particularly random forest regression, successfully predicted THC emissions based on engine parameters, achieving a high R2 value of 0.9015 and a low MSE, suggesting their potential for real-time emission monitoring. Despite promising results, the study was based on data from a single vehicle type, limiting its generalizability. Future research should include a wider range of LPG vehicle models. Overall, this research underscores the potential of LPG vehicles to reduce emissions and provides valuable information for improving emission control strategies.
AUTHORS’ CONTRIBUTION
The author confirms sole responsibility for the following: study conception and design, data collection, analysis and interpretation of results, and manuscript preparation.
LIST OF ABBREVIATIONS
| CO2 | = Carbon dioxide |
| EDA | = Exploratory Data Analysis |
| HEV | = Hybrid Electric Vehicle |
| LPG | = Liquefied Petroleum Gas |
| LPDI-HEV | = Liquid Phase Direct Injection Hybrid Electric Vehicle |
| MSE | = Mean Squared Error |
| NOx | = Nitrogen Oxides |
| OBD | = On-Board Diagnostics |
| PEMS | = Portable Emissions Measurement System |
| R2 | = R-Squared |
| RPM | = Revolutions Per Minute |
| THC | = Total Hydrocarbons |
AVAILABILITY OF DATA AND MATERIAL
All data generated or analyzed during this study are included in this published article.
FUNDING
This work was supported by The Ministry of Infrastructure and Development under the Eastern Poland Development Operational Program, including the European Regional Development Fund, which financed the research instruments.


