All published articles of this journal are available on ScienceDirect.

Enhanced Warehousing Operations through Platform-driven Horizontal Collaboration between Service Providers and Customers
Authors Info & Affiliations
Abstract
Introduction
This study is a research article. The study investigates the problem of customer assignments to existing warehouses within the scope of supply chain management, aiming to achieve cost savings and operational efficiency in warehouse operations. Specifically, the customer assignment problem is modeled under the assumptions of horizontal collaboration, utilization of a shared digital infrastructure, fair distribution, and cold chain logistics. These assumptions are applied within a framework consisting of clusters of service receivers and service providers.
Objective
This research aims to assess the impact of horizontal collaboration, common digital infrastructure, cold chain logistics, and fair income distribution assumptions on assignment problems under the title of warehouse management.
Methods
A decision support model is proposed for the assignment problem under the title of warehouse management. This model incorporates the key assumptions and operational parameters to optimize customer assignments under varying scenarios.
Results
The findings obtained from the study reveal that in the presence of horizontal collaboration among service providers, the costs of service providers are minimized, the demands of service receivers are met more, the profit obtained from service receivers increases, and the number of warehouses used increases. Under the assumption of fair distribution, it has been observed that cold warehouses contribute more to the total profit, in other words, the income obtained per volume of warehouses, since they generate more income compared to standard warehouses.
Conclusion
This study highlights the benefits of fostering horizontal collaboration and fair income distribution among supply chain actors through a shared online platform. The results underscore the potential for improving profit levels, meeting customer demands more effectively and optimizing warehouse utilization. These insights provide valuable guidance for decision-makers aiming to enhance supply chain efficiency and equity.
1. INTRODUCTION
For centuries, people lived predominantly in small communities, but in recent decades, there has been a marked shift towards urbanization. The United Nations’ World Urbanization Prospects projects that there will be more than 5 billion urban dwellers by 2030 [1]. This urban shift offers opportunities such as a wider customer base and economies of scale but also poses challenges such as higher transport costs, congestion, pollution and noise [2]. In terms of reducing such high costs and minimizing the above-mentioned challenges, the application of collaboration among logistics stakeholders is considered to be a highly successful method to increase efficiency in the supply chain [3]. Particularly when considered in the context of the 2030 Sustainable Development Agenda, strategic collaborative alliances between small and medium-sized enterprises help these companies overcome the challenges they encounter in their supply chain processes, such as procurement and transportation [4].
Collaboration refers to the formation of alliances in the field of transportation and logistics, which can span from operational to long-term strategic levels [3, 5]. Simatupang and Sridharan [6] defined supply chain collaboration as the cooperation of two or more chain members to create a competitive advantage through sharing benefits derived from increased profitability in meeting customer needs through information sharing, joint decision-making, and collaboration rather than acting alone [7]. In collaborative efforts, all parties must enhance their competitive skills to succeed in joint improvement initiatives, co-develop production, and solve problems together [8, 9]. Vertical collaboration involves forming beneficial alliances across different levels of the supply chain to minimize logistics costs. Horizontal collaboration occurs when companies at the same market level share knowledge, facilities or resources to reduce costs or improve services [10, 11].
Various examples can be given for studies on vertical collaboration in supply chains. For example, Bahinipati and Deshmukh [12] examined the extent to which farmers participate in vertical collaboration within the industrial chain. Li et al. [13] investigated the factors that influence vertical collaboration between different actors within the supply chain. Maflahah et al. [14] proposed a vertical collaboration structure that has been shown to have positive economic impacts on supply chain actors. Many research articles in the literature have extensively examined vertical collaboration within the logistics industry. However, horizontal collaboration has not garnered the same level of attention, as noted in [15]. Recognizing this gap, this study focuses on the warehouse management strategies of service providers engaged in horizontal logistics collaboration.
The infrastructure under consideration, which serves as the focus of this study and motivates the modeling, was established to address the short-term rental needs of supply chain actors. Additionally, warehouse owners' desire to generate supplemental income has driven the decision to rent out unused warehouse space. Mixing and consolidation centers, frequently utilized by various supply chain actors, exemplify horizontal logistical cooperation, particularly in the food industry [16]. In the context of horizontal collaboration in logistics, several types of cooperation exist. For instance, companies with common customers may share logistics vehicles [17], while practices such as shared freight carriers and load consolidation, known as pooling, aim to enhance supply chain sustainability [15]. However, studies addressing the sharing of facilities especially shared warehouses-remain limited. Notable examples include the sharing of unmanned micro warehouses by suppliers in China [18] and the use of shared warehouses by suppliers to distribute products to multiple retailers [16].
Another issue that draws attention and needs to be addressed when implementing collaborations among actors in the supply chain is cost allocation methods that encourage actors to collaborate, where actors share the overall supply chain returns or costs through the existence of a transparent and fair sharing mechanism [19]. In the literature, cost allocation methods consist of various examples, such as profit sharing [20], cost sharing [21], and CO2 emission sharing [22] within the scope of game theory. However, a notable gap in the literature is the lack of mathematical models addressing fair distribution. Instead, the concept is often discussed in the context of income distribution among actors, without providing a rigorous analytical framework.
The inclusion and use of digital tools and platforms in the supply chain is one of the main motivation sources of the study. In the context of supply chain management, increasing the level of digital development of companies, the use of specialized digital services and information and communication systems allows the smoother management of information systems and processes between supply chain actors [23].
The warehouse rental system and digitalization topics mentioned above bring together service receivers (customers) in need of warehouse space with warehouse owners (service providers, depots, warehouse) through a digital platform based on crowdsourcing1. The system’s objective is to facilitate warehouse owners in maximizing their operational capacity and boosting their revenues, while simultaneously minimizing logistics expenses for clients seeking temporary storage space2.
The adoption and reliance on digital technologies to carry out business activities is referred to as “digital transformation” or “digitalization” [24]. Crowd-sourcing approach, which is among the elements of digitalization, facilitates the management of storage operations and
1The concept of crowdsourcing has also been successfully applied in various sectors, including Airbnb in the hospitality industry (https://www.airbnb.com.tr/), Prolific (https://www.prolific.com/) or You Reply (https://www.youreply.com.tr/) in online data collection, and Uber (https://www.uber.com) in passenger transportation. Online accessed: March 2024.
2parkpalet.com Online accessed: March 2024.
connects warehouses with individuals or companies looking for storage space on a modern digital platform. In addition, the use of the platform enables service providers to convert the unused space in their warehouses into grey warehouses and generate additional revenue3. As seen from real-life examples, with the increasing trend of digitalization and automation in the warehousing sector, firms have made developing new warehousing practices and smart technology infrastructures a priority [25].
This study focuses on the problem of customer assignment to available depots, as observed in supply chain and logistics management, in order to achieve cost savings and operational efficiency. The assignment problem is defined within a finite planning horizon, incorporating the use of digital infrastructure and fair revenue distribution among service providers collaborating via an online platform. It involves clusters of service receivers and two distinct types of service providers: cold chain and standard. Note that fair revenue distribution among service providers collaborating through an online platform offers several key benefits, such as long-term partnerships, better resource utilization, customer satisfaction, and enhanced trust and cooperation.
The study aims to assess the impact of horizontal collaboration, common digital infrastructure, cold chain logistics, and fair income distribution assumptions on the assignment problem under the title of warehouse management. Accordingly, a decision support model based on integer linear programming for the assignment problem under the title of warehouse management is proposed for the problem. The applicability of the model and the potential benefits that could be derived from its use are demonstrated through a base case and numerical analyses.
The rest of the article is structured as follows. The next section presents a literature review based on horizontal collaboration in logistics. In the third section, the assignment problem is formally defined, including the problem statement and the proposed model. Numerical results are presented in the fourth section, followed by concluding remarks in the last section.
2. METHODS
The literature review conducted within the scope of the study was handled with the stages of defining appropriate keywords, scanning and analyzing the literature. The Web of Science database was used as the source to be scanned. While scanning the Web of Science database, the keyword “horizontal collaboration” was first searched, and 327 publications were found in this search. Then, the word “logistics” was written in the “refine” section and the search was made again, and 141 publications were found in this search.
Then, according to the document type, articles, notifications and early access publications were scanned and 69 publications involving mathematical methods in the study method were obtained in this scan. Among these publications, 20 studies that used allocation methods in their studies were examined. These publications and detailed information are summarized in detail in Table 1.
Table 1 summarizes the studies on allocation decisions based on factors such as cost, profit, and CO2 emissions, which are addressed under the title of fair distribution, primarily in vehicle routing, location routing, and supply chain network design problems.
Table 1 highlights that vehicle routing, location selection, and supply chain network design problems are the predominant problem types addressed in the literature. It is seen that vehicle routing and location routing problems are often included in the same problem. Similarly, the predominant model types include hybrid models and analytical models. Hybrid models refer to studies that use more than one model together, such as linear programming and game theory, while analytical models include those using multi-criteria decision making, simulation and agent-based simulation.
When examining the solution approaches employed in the studies, it becomes evident that heuristic methods and general-purpose solvers are commonly utilized. For example, Basso et al. [35], Wang et al. [18] and used Cuervo et al. [27] favored heuristic methods, Balcik et al. [31], Sampath et al. [33] and Mrabti et al. [22] utilized general purpose solvers, Vos et al. [32] and Hasan and Niyogi [34] used both heuristic and general-purpose solvers.
Upon examination of the fundamental decisions addressed in the studies, it is evident that a diverse array of decisions is considered. For instance, Vanovermeire et al. [19] and Vanovermeire and Sorensen [26] focus on scheduling decisions, Verdonck et al. [21] and Ouhader and Elkyal [28] discuss assignment decisions, Balcik et al. [31] and Hacardiaux et al. [38] examine location decisions, Sampath et al. [33] and Basso et al. [37] address inventory decisions, Wei and Wu [40] discusses cost allocation, Hacardiaux et al. [38] considers CO2 emission sharing, Ouhader and Elkyal [28] discusses profit sharing, and Vos et al. [32] focuses on gain sharing. This indicates a broad spectrum of decisions explored within the studies.
While there are studies by Verdonck et al. [21], Ouhader and Elkyal [29], Ouhader and Elkyal [28] that include assignment decisions, which are also discussed in our study, when fair distribution or allocation methods are considered, no study that provides for fair income distribution like our study is found within the scope of this reviewing.
Regarding the utilization of shared infrastructure, carried out to reduce transportation and other costs, notable examples include Tinoco et al. [30], which discuss the shared use of resources such as vehicles, where two different shippers bundle their shipments to share the same transportation vehicle using a collaborative shipping plan, and Verdonck et al. [21], which examines the sharing of distribution centers with partnering organizations.
3https://deportak.com/ Online accessed: March 2024.
| S.no | Writer(s)/Refs. | Problem Type | Model Type | Solution Approach | Key Decisions Made | Objective Function | Use of Common Infrastructure | Fair Distribution | Cold Chain Logistics |
|---|---|---|---|---|---|---|---|---|---|
| 1 | [20] | Capacity investment planning | Analytical | - | Capacity | - | - | Profit sharing | - |
| 2 | [19] | Order bundling | Hybrid | - | Scheduling Cost sharing |
Number of trips minimization | - | Cost sharing | - |
| 3 | [26] | Vehicle routing | Analytical | - | Scheduling Gain sharing |
Distribution costs minimization | - | Gain sharing | - |
| 4 | [21] | Vehicle routing | Hybrid | General purpose solver | Selection Assignment Location Inventory Cost sharing |
Minimization of fixed costs and transportation costs | Common use of carrier facility locations | Cost sharing | - |
| 5 | [27] | Vehicle routing | Hybrid | Heuristic | Scheduling Routing Profit sharing |
Coalition profit maximization | - | Profit sharing | - |
| 6 | [28] | Location and vehicle routing | Hybrid | Heuristic, general-purpose solver | Inventory Routing Assignment Location Profit sharing |
Transportation cost minimization, transportation-related CO2 emissions minimization, social impact maximization to measure business opportunities created | - | Profit sharing | - |
| 7 | [29] | Location and vehicle routing | Hybrid | Heuristic, general-purpose solver | Location Assignment Routing Cost sharing CO2 emissions sharing |
Transportation cost and transportation-related CO2 emissions minimization | - | Cost and CO2 emission sharing | - |
| 8 | [30] | Inventory management | Analytical | - | Inventory | Minimization of logistics costs | Common use of transport vehicles | Cost sharing | - |
| 9 | [31] | Supply chain network design | Hybrid | General purpose solver | Location Inventory Cost sharing Risk sharing |
Investment amount minimization, warehouse fixed cost minimization, inventory costs minimization, transportation costs minimization | - | Cost and risk sharing | - |
| 10 | [32] | Supply chain network design and inventory routing | Hybrid | Heuristic, general-purpose solver | Routing Gain sharing |
Distribution costs minimization and inventory holding costs minimization | Vendor managed inventory (VMI) | Gain sharing | - |
| 11 | [33] | Shipping consolidation | Hybrid | General purpose solver | Inventory Cost sharing |
Market cost-transportation cost maximization, minimum usage of trucks maximization, total number of demands shipped maximization | Blockchain system (stakeholders select packaging opportunities for shippers and match carriers) | Cost Sharing | - |
| 12 | [34] | Vehicle routing | Hybrid | Heuristic, general-purpose solver | Routing Cost sharing |
Tour cost minimization, penalty cost minimization of undelivered packages | Multi-agent system (information and communications infrastructure) | Cost sharing | - |
| 13 | [35] | Job scheduling | Hybrid | Heuristic | Scheduling Cost sharing |
Minimizing total delay costs | - | Cost sharing | - |
| 14 | [36] | Location and vehicle routing | Hybrid | General purpose solver | Inventory Cost sharing CO2 emissions sharing |
Transportation cost minimization, vehicle-related CO2 emission minimization, maximization of social impact to measure business opportunities created | - | Cost and CO2 emission sharing | - |
| 15 | [18] | Vehicle routing | Hybrid | Heuristic | Routing Profit sharing |
Coalition profit maximization | - | Profit sharing | Fresh products suppliers |
| 16 | [37] | Cooperative Game Theory | Hybrid | General purpose solver | Inventory Profit sharing |
Cost minimization | - | Profit sharing | - |
| 17 | [38] | Location-inventory | Hybrid | General purpose solver | Location Cost sharing CO2 emissions sharing |
Minimization of logistics costs, minimization of CO2 emissions from transportation | - | Cost and CO2 emission sharing | - |
| 18 | [22] | Supply chain network design | Hybrid | General purpose solver | Capacity Inventory Routing CO2 emissions sharing |
Minimization of CO2 emissions from vehicles and distribution centers | - | Cost and CO2 emission sharing | - |
| 19 | [39] | Supply chain network design | Hybrid | - | Inventory Cost sharing |
Operational cost minimization | - | Cost sharing | - |
| 20 | [40] | Cost sharing | Analytical | - | Inventory Cost sharing |
Operating cost minimization | Resource and risk sharing platform | Cost sharing | - |
| 21 | Our Study | Assignment | LP* | General purpose solver | Assignment Revenue sharing |
Profit maximization | Digital platform that brings customers and warehouses together | Revenue sharing | Cold chain depots |
For instance, Sampath et al. [33] discuss a blockchain system that allows stakeholders to select packaging options for senders and match with carriers and consolidate freights, resulting in higher utilization of trucks and lower shipping costs. Vos et al. [32] tried to achieve a collaborative savings model using Vendor Managed Inventory systems in a logistics distribution network with multiple suppliers, and Hasan and Niyogi [34] discusses information and communication infrastructure to reduce the overall costs and increase the utilization level of their resources.
Our study is important in terms of addressing multiple infrastructure elements, including digital and technological infrastructure systems that offer significant advantages such as cost savings and holistic supply chain profit, and warehouses that can be used jointly by customers, which are included under the title of physical infrastructure elements.
As noted above, the studies include allocation methods that facilitate the fair distribution of factors such as costs, emission rates, gains and profits among supply chain actors. These methods, which promote fair sharing among stakeholders, are referred to as collaboration benefits. They incentivize participation in collaborations that deliver benefits such as reduced unit costs, reduced unit emission rates, improved unit profit margins and overall gains. In this research, we focus on the fair distribution of total revenue among warehouse service providers. In this research, we focus on the fair distribution of total revenue among service providers with the expectation that actors will be encouraged to collaborate to fairly share the total revenue among actors.
Apart from the study Wang et al. [18], there is a noticeable absence of research addressing cold chain logistics. Our study aims to contribute to the topic of cold chain logistics with the cold warehouse types discussed and the energy cost parameter included in our model.
This study takes a different approach from the existing literature on horizontal collaboration in logistics and the allocation problem. Specifically, it simultaneously integrates the following features: (i) the use of digital infrastructure through a digital platform that connects service providers and receivers, (ii) ensuring fair income distribution by fairly sharing total income among service providers, and (iii) incorporating cold chain logistics, including the use of cold chain warehouses and accounting for their energy costs. Thus, the paper provides a contribution to the literature in terms of assessing the impact of horizontal logistics cooperation, shared digital infrastructure, cold chain logistics, and the assumption of fair income distribution on the allocation problem.
3. PROBLEM DESCRIPTION AND MATHEMATICAL FORMULATION
This section presents a formal description of the assignment problem and the proposed mathematical model.
3.1. Problem Description
The problem involves depots (service providers) and customers connecting on a digital platform to collaborate. Customers’ needs are matched with suitable depots, allowing depots to use their available space. Both customers and depots have defined characteristics like demand type and volume. The digital platform brings depot owners and customers together, enabling depot collaboration. Depots can earn extra revenue by using their space efficiently, while customers can request storage via the platform.
In this context, the set C denotes customers, while the set W = {Wc U Ws} represents service providers, encompassing cold chain depots (denoted by Wc = {1,2, ... , |Wc|}) and standard depots (denoted by Ws = {1,2, ... , |Ws|}).
When a customer is allocated to a depot, the depot owner assumes responsibility for transporting the customer’s stored product from the customer’s location to the depot, storing it, and then transporting it back to the same customer location. The problem is tackled within a finite planning horizon denoted by T = {1,2, ..., |T|}.
Upon fulfilling customer demand, revenue ri is obtained, which varies depending on the customer’s demand volume and the time period for which the depot is rented, with different values for cold chain and standard depots. In terms of costs, transporting the customer demand from the known customer point to the depot and back to the same customer point incurs transportation cost εi,w, handling and insurance costs hw and aw respectively, are incurred for storing the relevant requests in the service provider depots. Additionally, a periodical average energy consumption cost, calculated based on the volume measure provided only by the cold chain service provider and varying according to the percentage of depot utilization, is denoted as energyw.
The empty capacities of service providers and the demands of customers are known precisely at the beginning of the planning horizon. The available empty capacities offered by service providers for customers are given in terms of volume and area as cvw,t and cmw,t respectively. Additionally, the demands are determined in terms of volume and area as vi and mi. It is assumed that demands occur in consecutive periods or blocks, and the demand volumes/areas are equal for each period. For example, a service receiver’s demand may span three periods, with a volume of 1,100 m3 per period, totaling 3,300 m3. These demands need to be collectively fulfilled from the period when the demand begins until the period when the demand ends. Unfulfilled customer demands cannot be carried over to subsequent periods. In other words, any demands not met in the current period cannot be fulfilled in future periods. In addition, there is no requirement to satisfy each customer’s demand, and it is assumed that each customer’s demand is satisfied by only one service provider.
In the defined problem, customer-to-service provider assignment decisions are made on a per-period basis throughout the planning horizon. These decisions determine whether customers are assigned to depots. From the perspective of the service providers, the objective is to maximize total profit while distributing this revenue fairly among the service providers. This profit is calculated by subtracting the energy, handling, insurance, and transport costs specific to each depot from the revenue received from service receivers.
3.2. Mathematical Formulation
This section presents the formulation of the 0-1 integer linear programming model under consideration. Table 2 provides the notation, including the sets, parameters, and decision variables used in expressing the mathematical model.
| Sets | ||
|---|---|---|
| C | the set of customers C = {1,2, ... , |C|} | - |
| W | the set of service providers W = {Wc U Ws} | - |
| Wc | the set of cold chain service providers Wc = {1,2, ... , |Wc|} | - |
| Ws | the set of standard service providers Ws = {1,2, ... , |Ws|} | - |
| T | the set of time periods T = {1,2, ... , |T|} | - |
| Parameters | ||
| ri | revenue obtained when demand of service receiver i ∈ C is met | $ |
| li,w | 1 if service receiver i ∈ C is suitable for storage at service provider w ∈ W, 0 o.t.w | (0,1) |
| di,t | 1 if there is demand for service receiver for periods t∈t, 0 o.t.w | (0,1) |
| vi | volume requirement of service receiver i∈C | m3 |
| mi | area requirement of service receiver i∈C | m2 |
| energyw | average energy consumption cost per period of cold chain service provider w ∈ Wc varying with the utilization rate of storage | m3/$ |
| hw | total handling cost of service provider w ∈ W | m3/$ |
| aw | total insurance cost of service provider w ∈ W | m3/$ |
| εi,w | total transportation cost when demand of service receiver i ∈ C is stored at service provider w ∈ W | km/$ |
| cvw,t | volume-based capacity available at the beginning of period t ∈ T for service provider w ∈ W | m3 |
| cmw,t | area-based capacity available at the beginning of period t ∈ T for service provider w ∈ W | m2 |
| p | parameter ensuring fair distribution of revenue among service providers | (0-1] |
| Variables | ||
| Xi,w,t | 1 if service receiver i ∈ C is assigned to service provider w ∈ W during period t ∈ T, 0 o.t.w | (0,1) |
| Yi,w | 1 if service receiver i ∈ C is assigned to service provider w ∈ W within the planning horizon, 0 o.t.w | (0,1) |
We now present the (0-1) integer linear formulation of the problem. The model is then (Eq. 1):
Maximize
 |
(1) |
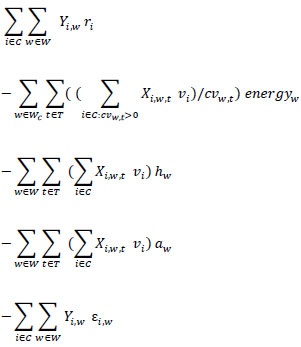
The objective function consists of five parts (Eq. 1): Equations represent, respectively, the revenue obtained by the service provider when meeting the demand of the customer, denotes the energy consumption cost of the cold storage facility provided by the cold storage service provider, which varies based on the utilization rate by the customer, and represent the total handling and insurance costs incurred when the customer’s demand is stored at the service provider, respectively, and encompasses the total transportation cost incurred when the demand is transported from the customer’s location to the storage facility and from the facility to the required destination (Eq. 2).
 |
(2) |
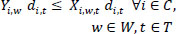
Constraint set (2) ensures that each service receiver is assigned to an appropriate service provider (Eq. 3).
 |
(3) |
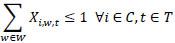
Constraint set (3) ensures that each service receiver is assigned to only one service provider in each period (Eq. 4).
 |
(4) |
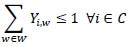
Constraint set (4) ensures that each service receiver is assigned to only one service provider throughout the planning horizon (Eq. 5).
 |
(5) |
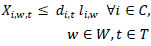
Constraint set (5) assumes that if a service receiver has demand in a period and is assigned to a service provider in that period, then it is assumed that the same demand exists and the assignment is made throughout the planning horizon covered by that demand (Eq. 6).
 |
(6) |
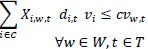
Constraint set (6) prevents the volume requirement of the service receiver for each period from exceeding the capacity available in terms of volume for the service provider (Eq. 7).
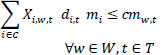 |
(7) |
Constraint set (7) prevents the volume capacity provided by each service provider from exceeding the volume requirement requested by the service receiver for each period (Eqs. 8 and 9).
 |
(8) |
 |
(9) |
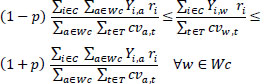
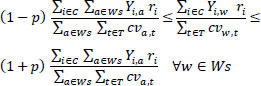
Constraint set (8) ensures fair distribution of total revenue obtained per available cubic meter among cold chain service providers, while constraint set (9) does the same among standard service providers (Eqs. 10 and 11).
 |
(10) |
 |
(11) |
The numerical constraints on the decision variables in the model are provided as constraint sets (10) and (11). The 0-1 integer linear programming model is defined by the objective function numbered (1) and constraint sets numbered (2)-(11).
4. RESULT AND DISCUSSION
This section presents the numerical analyses and their results for the problem. Firstly, a base case is created to demonstrate the applicability of the developed mathematical model and its associated benefits. Data and solutions for this base case are shared. Subsequently, different scenarios based on the problem are generated and the corresponding data and solutions are provided. Detailed analyses of both the base case and the scenarios are then carried out and the solutions are compared. Key Performance Indicators (KPIs) are used to comment on the solutions obtained. These KPIs include (i) revenue, (ii) energy costs, (iii) handling costs, (iv) insurance costs, (v) transport costs and (vi) total profit. For the numerical analyses, the developed mathematical model was solved using IBM OPL ILOG CPLEX software version 22.1.1 on a computer with 8 GB of memory and a 64-bit operating system, equipped with an Intel(R) Core (TM) i5-5200U CPU running at 2.20 GHz.
4.1. Description and Data
The mathematical model developed based on the problem at hand utilized data and operations from two separate companies engaged in logistics and warehouse leasing activities in Turkey for the parameters of the base case and scenario analyses. In the assignment problem considered, there are a total of 20 service providers, 9 of which are cold chain and 11 are standard, and 50 service receivers, 24 of which are cold chain, and 26 are standard.
In the base case, a planning horizon of 12 monthly periods is established. Service provider capacities and service receiver demands, expressed in volume and area, are hypothetically determined using numerical sets at different intervals. Service receiver requirements are presented in blocks in successive periods, with equal volumes and areas for each period. The adequacy of service provider capacity in volume and area, and service receiver demand in volume and area are presented in Tables A.1, A.2, A.3 and A.4 in Appendix A, respectively.
The revenue obtained by service providers from warehouses has been determined as $150 per cubic meter monthly for cold storage and $75 per cubic meter monthly for standard storage. Distance data forming the transportation cost between service receivers and service providers (see Appendix A Table A.5) have been obtained from a data library providing examples for routing problems (UK50 12)4. It is assumed that the fuel consumption of vehicles moving between service receivers and service providers is 24 liters per 100 km, and the price of gasoline is $2.3 per liter in the UK. Using this data, the fuel costs for vehicles moving between service receivers and service providers have been calculated for both outbound and return trips (see Appendix A Table A.6). The parameter specified among the parameters and included in constraints (8) and (9), denoted as p, determines how closely or distantly the revenue will be distributed among the warehouses. Therefore, p takes values in the range of (0-1). Since the mid-point of the range (0-1) is considered as 0.5, the value p is used as the basis in the base case. Other problem parameters used in the base case are given in Table 3.
| Parameter | Value | Source |
|---|---|---|
| ri | 75-150 | Hypothetical |
| li,w | (0,1) | Hypothetical |
| di,t | (0,1) | Hypothetical |
| vi | Table A.3 | Hypothetical |
| mi | Table A.4 | Hypothetical |
| energyw | 1,600 | Tamgüç Panel and Soğutma5 |
| hw | 0.2695-0.305 | Zeyport6 |
| aw | 0.485-0.785 | Tarsim7 |
| εi,w | Table A.6 | (UK50 12) |
| cvw,t | Table A.1 | Hypothetical |
| cmw,t | Table A.2 | Hypothetical |
| p | 0.5 | Hypothetical |
4.2. Base Case Solution
As shown in Table 4, which presents the KPI’s obtained from the base case solution, the solution yields a revenue of approximately $1,100,646 over the 12-month period, encompassing the total revenue generated by 20 warehouses. Looking at four different cost categories, it’s worth noting that insurance costs are the highest, totaling $127,500 and representing 49% of total costs. This is followed, in descending order, by energy costs at 25%, handling costs at 24% and transport costs at 1%. The profit obtained by subtracting these costs from the revenue is approximately $842,353.
Table 5 shows the allocation of customers to warehouses over the specified time periods. In the” Depot” column, Wc represents cold chain warehouses, while Ws represents standard warehouses. The horizontal columns represent the time periods, and the cells at the intersection of warehouses and time periods indicate the customers assigned to the warehouses.
As illustrated in Table 5, from the perspective of fulfilled demand, out of 26 standard demand customers, 17 had their demands met, while 9 did not. Among the 24 customers requiring cold chain services, 17 had their demands met, and 7 did not. In addition, in the 6th and 7th time, the 29th and 3rd customers were assigned to cold storage, designated as Wc2, at the same time, and it is observed that they used the warehouse jointly. Regarding warehouse utilization, it is noted that all warehouses are actively in use.
4http://www.apollo.management.soton.ac.uk/prplib.htm Online accessed: April 2021
| KPI | Base Case |
|---|---|
| Income ($) | 1,100,646.9 |
| Energy cost ($) | 66,475.0 |
| Handling cost | 62,182.0 |
| Insurance cost ($) | 127,500.0 |
| Transportation cost ($) | 2,136.4 |
| Total cost ($) | 258,293.4 |
| Total profit ($) | 842,353.4 |
| Number of standard customers assigned | 17 |
| Number of assigned cold chain customers | 17 |
| Number of standard customers that cannot be assigned | 9 |
| Number of cold chain customers that cannot be assigned | 7 |
| Number of standard warehouses assigned | 11 |
| Number of cold chain warehouses assigned | 9 |
| Number of standard warehouses not assigned | 0 |
| Number of cold chain warehouses not assigned | 0 |
| Warehouses* | 1 | 2 | 3 | 4 | 5 | 6 | 7 | 8 | 9 | 10 | 11 | 12 |
|---|---|---|---|---|---|---|---|---|---|---|---|---|
| Wc1 | 31 | - | - | 47 | - | 24 | 24 | 24 | 24 | - | - | - |
| Wc2 | - | - | 3 | 3 | 3 | 29-3 | 29-3 | 29 | 29 | 29 | 29 | - |
| Ws3 | - | - | - | - | - | - | - | - | - | - | - | - |
| Wc4 | - | - | - | 30 | 30 | 30 | 30 | 30 | 30 | 30 | - | - |
| Ws5 | - | - | 25 | 25 | 25 | - | 42 | - | - | - | - | - |
| Wc6 | - | - | 44 | 44 | 44 | 44 | 44 | 44 | 44 | - | - | - |
| Ws7 | - | - | - | - | - | - | - | 15 | 15 | 48 | 48 | 48 |
| Ws8 | - | - | 11 | 11 | 11 | 11 | 11 | 11 | 11 | 11 | 11 | - |
| Ws9 | 1 | 1 | - | - | - | - | - | 41 | 41 | 41 | 41 | 41 |
| Wc10 | - | - | - | 45 | 14 | 14 | 14 | 14 | 9 | 9 | 9 | 9 |
| Ws11 | - | - | - | 39 | 39 | 39 | - | - | - | - | - | 35 |
| Wc12 | 12 | 12 | 12 | 12 | - | 21 | 21 | 21 | 21 | - | - | - |
| Ws13 | 28 | 28 | 28 | 28 | 28 | 28 | - | - | - | - | - | - |
| Ws14 | - | - | - | - | - | - | - | 7 | 7 | 7 | 7 | 7 |
| Wc15 | - | - | - | 33 | 33 | 33 | 33 | 38 | 38 | 38 | 38 | 38 |
| Ws16 | 4 | 4 | 4 | 4 | 4 | 4 | 4 | 4 | - | - | - | - |
| Ws17 | 34 | 34 | - | - | - | 22 | 22 | 22 | 22 | 22 | 22 | - |
| Wc18 | 8 | 8 | 8 | 8 | 8 | - | - | - | 50 | 50 | 50 | 50 |
| Wc19 | - | - | - | 26 | 26 | 26 | 26 | 26 | - | - | 36 | 36 |
| Ws20 | 18 | 18 | - | - | - | - | - | 20 | 20 | 20 | 20 | 20 |
| Scenario 1 | Analysis of the Impacts of Fair Income Distribution on Total Revenue and Costs |
| Scenario 2 | Analysis of the individual contributions of warehouses to total revenue |
| Scenario 3 | Analysis of the benefits of inter-warehouse collaboration |
| p-values | 0.1 | 0.2 | 0.3 | 0.4 | 0.5* | 0.6 | 0.7 | 0.8 | 0.9 | 1 |
|---|---|---|---|---|---|---|---|---|---|---|
| Income ($) | 409,275.1 | 1,050,468.3 | 1,099,000.0 | 1,100,646.9 | 1,100,646.9 | 1,100,646.9 | 1,100,646.9 | 1,100,646.9 | 1,100,646.8 | 1,100,646.8 |
| Energy Cost ($) | 45,107.0 | 62,808.0 | 66,475.0 | 66,475.0 | 66,475.0 | 66,475.0 | 66,475.0 | 66,475.0 | 66,475.0 | 66,475.0 |
| Handling Cost ($) | 14,707.0 | 59,468.00 | 62,045.0 | 62,182.0 | 62,182.0 | 62,182.0 | 62,182.0 | 62,182.0 | 62,182.0 | 62,182.0 |
| Insurance Cost ($) | 42,837.0 | 121,750.0 | 127,280.0 | 127,500.0 | 127,500.0 | 127,500.0 | 127,500.0 | 127,500.0 | 127,500.0 | 127,500.0 |
| Transportation Cost ($) | 1,170.0 | 2,319.1 | 2,090.9 | 2,136.4 | 2,136.4 | 2,121.4 | 2.121.4 | 2,121.4 | 2,105.0 | 2,105.1 |
| Total Cost ($) | 103,821.0 | 246,345.1 | 257,933.0 | 258,293.4 | 258,293.4 | 258,278.4 | 258,278.4 | 258,278.4 | 258,262.0 | 258,262.0 |
| Profit ($) | 305,454.1 | 804,123.1 | 841,066.9 | 842,353.4 | 842,353.4 | 842,368.5 | 842,368.5 | 842,368.5 | 842,384.7 | 842,384.7 |
4.3. Scenario Analyses
This section presents scenario analyses conducted on the addressed problem, along with their respective solutions and evaluations. Comparisons are drawn between these scenario analyses and the base case discussed earlier, followed by interpretations and assessments.
Within the scenario analyses conducted, the focus is placed on warehouses collaborating or operating independently, fair revenue distribution among warehouses, and individual revenue comparisons for warehouses.
Initially, the parameter determining fair revenue distribution among warehouses, denoted as “p-value” is varied within the range (0-1) that is, the revenues obtained by the warehouses per volume are differentiated to take values in the closest and farthest ranges, and changes in KPIs are observed. In the second scenario, each warehouse’s individual revenue contribution is analyzed. Within the scope of this analysis, each warehouse was removed from the analysis one by one, and the model was run assuming that nineteen warehouses cooperated each time. The third scenario explores non-collaborative warehouse operations, where customers are randomly assigned to warehouse types matching their demands and capacity, with preference given to warehouses generating the highest revenue for these customers.
The three main scenario analyses mentioned above are presented in Table 6.
4.3.1. Analysis of the Impacts of Fair Income Distribution on Total Revenue and Costs
The results from the first scenario analysis showcase the variation in the p-values, which are incorporated into constraint sets (8) and (9) to ensure fair distribution of total revenue per available cubic meter among service providers, both for cold chain and standard providers. By adjusting the p values within the range of (0-1), the extent of revenue distribution fairness among depots is determined, and the resultant impact on KPIs is observed. Table 7 presents the KPIs observed under different p-values.
As observed from Table 7, the p-values have taken ten different values, and the model has been solved for each p value. The results obtained illustrate the variation in KPI’s due to the differentiation in the p value. If we examine the transition from p = 0.1 to p = 0.4, it can be observed that all KPI’s take their lowest values at p = 0.1. As p increases from p = 0.1 to p = 0.4, revenue, profit, handling cost, and insurance cost consistently increase, while the energy cost increases from p = 0.1 to p = 0.3 and remains the same at p = 0.4. The transportation cost increases at p = 0.2, decreases at p = 0.3, and increases again at p = 0.4.
Examining the transition from p = 0.5 to p = 1, since p = 0.5 is at the midpoint, it can be said that, except for minor changes, the KPI’s related to revenue, energy cost, and insurance cost remain the same from p = 0.4 to p = 1. It can be inferred that the changing items are mainly transportation costs due to assignment differences, and it is appropriate to say that the changes (increases or decreases) in profit are as much as the change in transportation costs.
From another perspective, as the p values increase from 0.1 to 1, it can be observed that the range of revenue obtained by depots increases, indicating a departure from the fair distribution of revenue. Figs. (1 and 2) illustrate the distributions of revenue per cubic meter obtained by depots based on p = 0.1 and p = 1, respectively.
As stated above, it is observed that the depot revenue levels based on p = 0.1 and provided in Fig. (1) are closer to each other and distributed in a smaller range. Conversely, considering p = 1 as the basis, the depot revenue levels shown in Fig. (2) are farther from each other and distributed in a larger range. Additionally, it is observed that when the solution is obtained for p = 0.1, customers are only assigned to cold storage depots. For p = 1, customers are assigned to both standard and cold storage depots. As shown in Figs. (1 and 2), the revenue per cubic meter obtained by standard depots is indicated in green, while the revenue per cubic meter obtained by cold storage depots is indicated in gray.
4.3.2. Analysis of the Individual Contributions of Warehouses to Total Revenue
In the second scenario analysis, individual contributions of depots to the total revenue level were examined by sequentially removing each depot from the analysis and re-executing the model. This process was repeated twenty times, corresponding to the total number of depots. The “p” value used was 0.5, consistent with the base case. Sets
5https://www.tamgucsogutma.com.tr/ Online accessed: March 2024
6https://zeyport.net/Online accessed: March 2024
7https://www.tarsim.gov.tr/Online accessed: March 2024
“Wcu = {1,2, ..., |Wcu|} and Wsu = {1,2, ..., |Wsu|}” were introduced to the model, representing cold chain and standard depots, respectively. Note that at each time, the depot whose contribution is being analyzed is not included in the sets Wcu and Wsu. In this context, constraints (8) and (9) have been removed from the model, and constraints (12) and (13) provided below have been added (Eqs. 12 and 13).
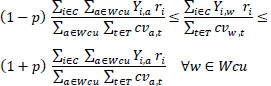 |
(12) |
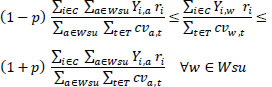 |
(13) |
Accordingly, the model has been redefined with objective function (1) and constraint sets (2-7), (10-13). The changes in KPI’s from the first depot to the twentieth depot and the individual contributions of the depots are shown in Table 8 below.
Table 8 presents data for total profit from the collaborative base case analysis of the depots and the individual contributions of each depot to the total profit in Scenario Analysis 2. The last column of the table shows the difference between the profit obtained in the base case analysis and Scenario Analysis 2. Individual contributions of the twenty depots to the total revenue are provided in the fourth column. It is observed that the individual contributions of cold chain depots to the total revenue are higher compared to standard depots, mainly because cold chain depots earn more revenue per volume.
The highest individual contributions come from the 19th and 18th depots, both cold chain facilities catering to customers with substantial capacity demands. Among standard depots, the 8th and 16th depots stand out for their comparatively higher individual contributions, likely due to evaluating 9 and 8 periods of available capacity, respectively, resulting in increased revenue. Conversely, the negative individual contribution of the fifth depot suggests that collaborating with other depots yields higher profits than operating independently. In essence, it implies that the fifth depot benefits from collaboration within the sector.
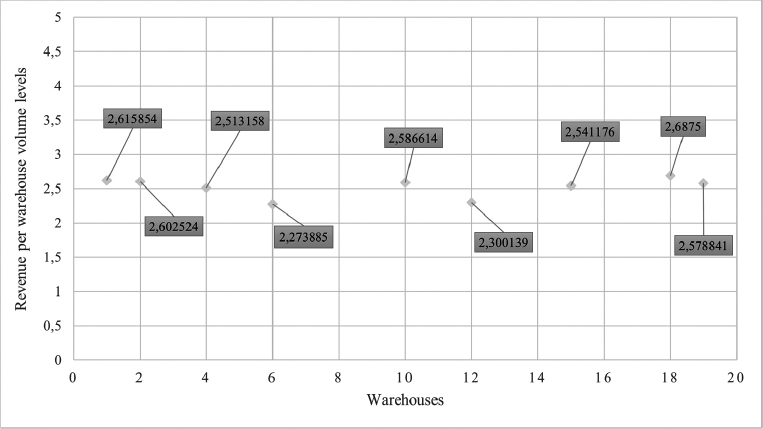
Revenue distribution of warehouses per volume for p = 0.1 value ($).
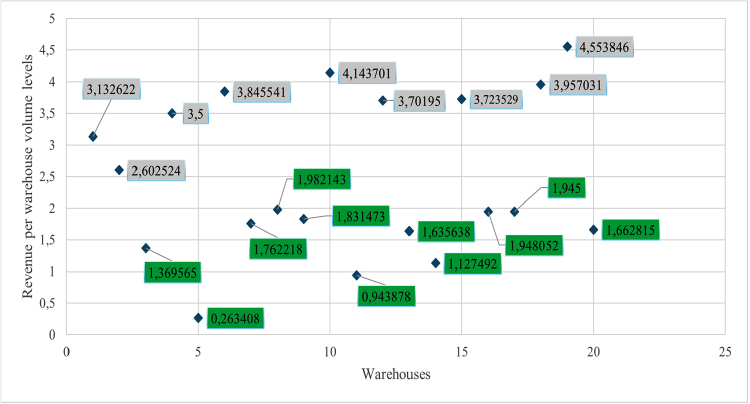
Revenue distribution of warehouses per volume for p = 1 value ($).
| Warehouses* | Scenario Analysis 2 Total Profit Level | Contribution of Warehouses to Individual Income Level | Percentage Change Level** |
|---|---|---|---|
| Wc1 | 811,831.7 | 30,521.7 | 3.62% |
| Wc2 | 811,536.2 | 30,817.2 | 3.65% |
| Ws3 | 842,083.4 | 270.0 | 0.032% |
| Wc4 | 811,383.1 | 30,970.3 | 3.67% |
| Ws5 | 842,379.6 | -26.1 | -0.003% |
| Wc6 | 811,388.2 | 30,965.1 | 3.67% |
| Ws7 | 842,270.1 | 83.2 | 0.009% |
| Ws8 | 793,209.1 | 49,144.3 | 5.83% |
| Ws9 | 842,267.4 | 86.0 | 0.010% |
| Wc10 | 790,478.6 | 51,874.8 | 6.15% |
| Ws11 | 826,539.9 | 15,813.5 | 1.87% |
| Wc12 | 792,488.5 | 49,864.9 | 5.91% |
| Ws13 | 806,107.9 | 36,245.5 | 4.30% |
| Ws14 | 842,322.2 | 31.2 | 0.003% |
| Wc15 | 790,229.8 | 52,123.6 | 6.18% |
| Ws16 | 795,097.6 | 47,255.8 | 5.60% |
| Ws17 | 842,239.7 | 113.7 | 0.013% |
| Wc18 | 785,863.3 | 56,490.1 | 6.70% |
| Wc19 | 775,921.7 | 66,431.7 | 7.88% |
| Ws20 | 842,158.6 | 194.8 | 0.023% |
** The comparative results of the base case and scenario solution are expressed as a percentage difference.
| - | Number of Assigned Customers (Number) | Total Profit Achieved ($) |
|---|---|---|
| Base case | 34/50 | 842,353 |
| Case A: Manual Assignment 1 | 23/50 | 563,528 |
| Case B: Manual Assignment 2 | 33/50 | 803,086 |
4.3.3. Analysis of the Benefits of Inter-warehouse Collaboration
Based on the analysis of the third scenario, an attempt was made to demonstrate the benefits of inter-depot collaboration. For this purpose, a comparison was made between the scenario where depots collaborate and the scenario where they do not collaborate.
In this context, based on the results obtained from the solution of the third scenario analysis, it is first assumed that the warehouses operate individually without cooperating. Suitability ratings for all other depots were consequently set to zero for each depot under examination. This procedure was iterated 20 times for each depot. Second, using the initial analysis solutions found through optimization, different depot options were found where customers could be assigned, and customers were then manually assigned to these depots. In the context of manual assignment 1, from the perspective of customers assigned to warehouses, starting with warehouses that have one alternative and following in the direction of increasing the number of alternatives, the first warehouse assignment among the options to which customers could alternatively be assigned has been made. As the final analysis solution, based on manual assignment 2, customers who were assigned to warehouses in the case study result but were not assigned to any warehouse in manual assignment 1 have been identified, and these customers have been assigned to the warehouses that are most suitable for them and generate the most revenue, starting with the most preferred.
To facilitate a clearer presentation of the analysis results, we have compiled Table 9 below. This table offers a comparison between the base case and the aforementioned cases, specifically detailing the number of customers assigned to depots and the total profit generated.
When assessing the cases delineated in Table 9, it becomes evident that in the base case scenario, where cooperation among depots is present, roughly 34 out of 50 customer demands are satisfied, yielding a total profit of approximately $842,353.
Comparing the base case, where depot cooperation exists, with cases lacking such collaboration and employing manual assignment specifically, case A and case B, we observe significant differences. In case A, leveraging initial optimization analysis, depot options for customer assignments are identified, and customers are manually allocated accordingly. The number of fulfilled customer demands decreases from 34 out of 50 to 23 out of 50. Similarly, the total profit declined from approximately $842,353 to $563,528. This trend suggests that in the absence of depot cooperation, both the fulfillment of customer demands and the total profit decrease.
Furthermore, in the scenario where depot cooperation is absent, and customers initially assigned to depots in the base case but not assigned in case A is identified, an alternative manual assignment approach is implemented. Here, customers with the potential for the highest revenue are prioritized, and assignments are made to suitable depots with available capacity. Upon examining the second manual assignment, case B, we observe an improvement in fulfilled customer demand, which increases to 33 out of 50 compared to case A. The total profit also rises to approximately $803,086. However, despite these enhancements, case B still falls short in terms of both fulfilled customer demand and total profit when compared to the collaborative assumption present in the base case.
These outcomes lead to the conclusion that the absence of cooperation between depots results in a decrease in both the number of fulfilled customer demands and the total profit. The reduction in fulfilled customer demands underscores the significant positive influence of inter-depot collaboration on meeting customer needs. Consequently, highlighting the significance of collaboration becomes imperative in achieving higher total profit and ensuring fair distribution of this profit.
CONCLUSION
The objective of this study is to reduce service providers’ expenses and enhance their profitability from service receivers by devising and solving the customer-to-depot assignment problem. Specifically, it focuses on optimizing the allocation of service receivers to depots to fulfill the maximum possible level of service demands efficiently.
This paper presents a 0-1 integer linear programming model to address the assignment problem. The model incorporates a digital platform that links depots and customers of two different types: standard and cold chain. The model is based on the assumption that the platform enables the allocation of the customer needs to suitable depots, thus optimizing the utilization of depot capacity. The digital platform’s infrastructure anticipates and manages known features of customers and depots, including demand information, necessary depot properties, demand volume/area, and duration.
After developing the model, a base case and three distinct scenarios were analyzed using a general-purpose solver. Numerical analyses were performed to highlight the applicability and utility of the model. In the base case, assuming cooperation among providers and fair income distribution, the total profit reached approximately $842,353, with 34/50 customer demands met and all 20 depots utilized.
In scenario analysis 1, examining the impact of the fair income distribution, altering p-values (0-1) revealed that as p-values rise from 0.1 to 1, the revenue range for depots widens, signaling a move away from fair distribution. This analysis assessed how income distribution changed across warehouses and changes (increases or decreases) on KPIs, showing a clear correlation between increasing p-values and growing income inequality. Scenario analysis 2 focuses on the unique revenue contributions of each depot, removing each depot individually to rerun the model 20 times. Cold chain depots were found to contribute more to total revenue than standard depots due to their higher revenue per volume. Scenario 3 analyzed the benefits of depot collaboration, initially simulating depots operating independently by resetting suitability and rerunning the model 20 times. Optimization then identified depot alternatives for customer assignment, with manual allocations made. Customers not assigned in the initial run but identified through case study analysis were allocated to the most suitable, revenue-optimizing depots. The outcomes highlight that without collaboration, customer demand fulfillment and profit decrease, demonstrating the positive impact of inter-depot collaboration on meeting demands.
This study highlights the importance of horizontal collaboration in logistics, utilizing common digital platforms, optimizing cold chain logistics, and guaranteeing fair revenue distribution when tackling the assignment problem.
Future research could enhance the model’s real-world applicability by incorporating uncertain factors into the problem. Expanding the diversity of service providers and receivers, as well as extending the planning horizon, presents avenues for further exploration. Additionally, advancing the study with large-scale examples and employing intuitive or meta-heuristic algorithms could offer valuable contributions to the literature.
AUTHORS’ CONTRIBUTION
M.S.: Study conception and design; M.C.: Writing the Paper; H.C.K.: Data Analysis or Interpretation; S.B.: Writing - Reviewing and Editing. All authors reviewed the results and approved the final version of the manuscript.
LIST OF ABBREVIATIONS
| VMI | = Vendor managed inventory |
| KPIs | = Key Performance Indicators |
AVAILABILITY OF DATA AND MATERIALS
All data generated or analyzed during this study are included in this published article.
CONFLICT OF INTEREST
Dr. Mehmet Soysal is the Associate Editorial Board Member of the journal The Open Transportation Journal.
ACKNOWLEDGEMENTS
Declared none.
DISCLOSURE
This study has been derived from the PhD thesis as “Sustainable warehouse management in cold chain logistics under horizontal collaboration assumption” written by Müge Çerçi under the supervision of Prof. Dr. Mehmet Soysal in the Business Administration Doctoral Program at Hacettepe University, Türkiye.
Appendix A. Additional Parameter Values of the Base Case Scenario and their Sources
This appendix section presents the capacity adequacy of service providers in terms of volume and area (Tables A.1 and A.2), service receiver demands in terms of volume and area (Tables A.3 and A.4), distances between customers and service providers (Table A.5), transportation costs between customers and service providers (Table A.6).
| - | Service Provider | |||||||||||||||||||
|---|---|---|---|---|---|---|---|---|---|---|---|---|---|---|---|---|---|---|---|---|
| Time Period | 1* | 2* | 3 | 4* | 5 | 6* | 7 | 8 | 9 | 10* | 11 | 12* | 13 | 14 | 15* | 16 | 17 | 18* | 19* | 20 |
| 1 | 1800 | 0 | 2700 | 0 | 2850 | 0 | 3400 | 0 | 2900 | 1750 | 2800 | 2000 | 2800 | 3050 | 1700 | 3000 | 2900 | 1900 | 2000 | 3100 |
| 2 | 0 | 0 | 2700 | 0 | 2850 | 0 | 3400 | 0 | 2900 | 0 | 0 | 2000 | 2800 | 3050 | 1700 | 3000 | 2900 | 1900 | 2000 | 3100 |
| 3 | 1900 | 1900 | 2800 | 1800 | 2850 | 2200 | 3200 | 3100 | 2800 | 0 | 0 | 2000 | 2800 | 3050 | 0 | 3000 | 2900 | 2150 | 2000 | 3150 |
| 4 | 2000 | 1900 | 0 | 1800 | 2850 | 2200 | 3200 | 3100 | 2900 | 2100 | 3150 | 1900 | 2950 | 3100 | 1900 | 3100 | 0 | 2150 | 1800 | 0 |
| 5 | 2000 | 1950 | 0 | 1900 | 2900 | 2150 | 3300 | 3100 | 0 | 2100 | 3000 | 0 | 2950 | 3150 | 1850 | 3200 | 0 | 2150 | 1800 | 0 |
| 6 | 1700 | 2200 | 3000 | 1900 | 0 | 2150 | 0 | 3300 | 0 | 2100 | 3000 | 1800 | 2950 | 0 | 1850 | 3050 | 3000 | 0 | 2100 | 2900 |
| 7 | 1700 | 2200 | 3000 | 2000 | 2900 | 1700 | 0 | 3300 | 2850 | 1850 | 3000 | 1800 | 0 | 0 | 1850 | 3050 | 2950 | 0 | 2100 | 2850 |
| 8 | 1750 | 2100 | 3000 | 2000 | 2900 | 1800 | 3200 | 3300 | 2850 | 1850 | 2900 | 2150 | 0 | 3000 | 1900 | 3150 | 2950 | 1850 | 2100 | 2850 |
| 9 | 1750 | 0 | 3200 | 2000 | 3000 | 1700 | 3200 | 3300 | 2700 | 1900 | 2900 | 2150 | 2850 | 3000 | 1900 | 3150 | 3100 | 1850 | 0 | 2900 |
| 10 | 1800 | 1800 | 3200 | 2000 | 2900 | 1800 | 3450 | 3000 | 2700 | 1800 | 2900 | 2150 | 2700 | 2900 | 2200 | 3100 | 3100 | 1750 | 0 | 2900 |
| 11 | 0 | 1800 | 3200 | 0 | 2900 | 0 | 3450 | 3000 | 2700 | 1800 | 2900 | 0 | 2700 | 2900 | 2200 | 0 | 3100 | 1750 | 1800 | 3000 |
| 12 | 0 | 0 | 3100 | 1700 | 0 | 0 | 3450 | 3000 | 2700 | 1800 | 2850 | 0 | 2700 | 2900 | 2200 | 0 | 3100 | 1750 | 1800 | 3000 |
| - | Service Provider | |||||||||||||||||||
|---|---|---|---|---|---|---|---|---|---|---|---|---|---|---|---|---|---|---|---|---|
| Time Period | 1* | 2* | 3 | 4* | 5 | 6* | 7 | 8 | 9 | 10* | 11 | 12* | 13 | 14 | 15* | 16 | 17 | 18* | 19* | 20 |
| 1 | 374.0 | 0 | 561.0 | 0 | 592.2 | 0 | 706.4 | 0 | 602.6 | 363.6 | 581.8 | 415.5 | 581.8 | 633.7 | 353.2 | 623.3 | 602.6 | 394.8 | 415.5 | 644.1 |
| 2 | 0 | 0 | 561.0 | 0 | 592.2 | 0 | 706.4 | 0 | 602.6 | 0 | 0 | 415.5 | 581.8 | 633.7 | 353.2 | 623.3 | 602.6 | 394.8 | 415.5 | 644.1 |
| 3 | 394.8 | 394.8 | 581.8 | 374.0 | 592.2 | 457.1 | 664.9 | 644.1 | 581.8 | 0 | 0 | 415.5 | 581.8 | 633.7 | 0 | 623.3 | 602.6 | 446.7 | 415.5 | 654.5 |
| 4 | 415.5 | 394.8 | 0 | 374.0 | 592.2 | 457.1 | 664.9 | 644.1 | 602.6 | 436.3 | 654.5 | 394.8 | 612.9 | 644.1 | 394.8 | 644.1 | 0 | 446.7 | 374.0 | 0 |
| 5 | 415.5 | 405.1 | 0 | 394.8 | 602.6 | 446.7 | 685.7 | 644.1 | 0 | 436.3 | 623.3 | 0 | 612.9 | 654.5 | 384.4 | 664.9 | 0 | 446.7 | 374.0 | 0 |
| 6 | 353.2 | 457.1 | 623.3 | 394.8 | 0 | 446.7 | 0 | 685.7 | 0 | 436.3 | 623.3 | 374.0 | 612.9 | 0 | 384.4 | 633.7 | 623.3 | 0 | 436.3 | 602.6 |
| 7 | 353.2 | 457.1 | 623.3 | 415.5 | 602.6 | 353.2 | 0 | 685.7 | 592.2 | 384.4 | 623.3 | 374.0 | 0 | 0 | 384.4 | 633.7 | 612.9 | 0 | 436.3 | 592.2 |
| 8 | 363.6 | 436.3 | 623.3 | 415.5 | 602.6 | 374.0 | 664.9 | 685.7 | 592.2 | 384.4 | 602.6 | 446.7 | 0 | 623.3 | 394.8 | 654.5 | 612.9 | 384.4 | 436.3 | 592.2 |
| 9 | 363.6 | 0 | 664.9 | 415.5 | 623.3 | 353.2 | 664.9 | 685.7 | 561.0 | 394.8 | 602.6 | 446.7 | 592.2 | 623.3 | 394.8 | 654.5 | 644.1 | 384.4 | 0 | 602.6 |
| 10 | 374.0 | 374.0 | 664.9 | 415.5 | 602.6 | 374.0 | 716.8 | 623.3 | 561.0 | 374.0 | 602.6 | 446.7 | 561.0 | 602.6 | 457.1 | 644.1 | 644.1 | 363.6 | 0 | 602.6 |
| 11 | 0 | 374.0 | 664.9 | 0 | 602.6 | 0 | 716.8 | 623.3 | 561.0 | 374.0 | 602.6 | 0 | 561.0 | 602.6 | 457.1 | 0 | 644.1 | 363.6 | 374.0 | 623.3 |
| 12 | 0 | 0 | 644.1 | 353.2 | 0 | 0 | 716.8 | 623.3 | 561.0 | 374.0 | 592.2 | 0 | 561.0 | 602.6 | 457.1 | 0 | 644.1 | 363.6 | 374.0 | 623.3 |
| Customers | |||||||||||||||||||||||||
|---|---|---|---|---|---|---|---|---|---|---|---|---|---|---|---|---|---|---|---|---|---|---|---|---|---|
| Time Periods | 1 | 2* | 3* | 4 | 5* | 6 | 7 | 8* | 9* | 10 | 11 | 12* | 13 | 14* | 15 | 16 | 17* | 18 | 19 | 20 | 21* | 22 | 23* | 24* | 25 |
| 1 | 1900 | 0 | 0 | 2000 | 0 | 1800 | 0 | 1090 | 0 | 1950 | 0 | 1120 | 0 | 0 | 0 | 0 | 0 | 2000 | 0 | 0 | 0 | 0 | 1210 | 0 | 0 |
| 2 | 1900 | 0 | 0 | 2000 | 0 | 1800 | 0 | 1090 | 0 | 1950 | 0 | 1120 | 0 | 0 | 0 | 1930 | 0 | 2000 | 0 | 0 | 0 | 0 | 1210 | 0 | 0 |
| 3 | 0 | 0 | 1100 | 2000 | 0 | 1800 | 0 | 1090 | 0 | 1950 | 1850 | 1120 | 1875 | 0 | 0 | 1930 | 0 | 0 | 1800 | 0 | 0 | 0 | 1210 | 0 | 1935 |
| 4 | 0 | 0 | 1100 | 2000 | 0 | 1800 | 0 | 1090 | 0 | 1950 | 1850 | 1120 | 1875 | 0 | 0 | 1930 | 0 | 0 | 1800 | 0 | 0 | 0 | 1210 | 0 | 1935 |
| 5 | 0 | 1150 | 1100 | 2000 | 0 | 1800 | 0 | 1090 | 0 | 1950 | 1850 | 0 | 1875 | 1190 | 0 | 1930 | 0 | 0 | 1800 | 0 | 0 | 0 | 1210 | 0 | 1935 |
| 6 | 0 | 1150 | 1100 | 2000 | 1090 | 1800 | 0 | 0 | 0 | 1950 | 1850 | 0 | 1875 | 1190 | 0 | 1930 | 0 | 0 | 1800 | 0 | 1095 | 1960 | 1210 | 1130 | 0 |
| 7 | 0 | 1150 | 1100 | 2000 | 1090 | 1800 | 0 | 0 | 0 | 1950 | 1850 | 0 | 1875 | 1190 | 0 | 1930 | 1200 | 0 | 1800 | 0 | 1095 | 1960 | 1210 | 1130 | 0 |
| 8 | 0 | 0 | 0 | 2000 | 1090 | 1810 | 0 | 0 | 0 | 1850 | 0 | 1875 | 1190 | 1880 | 1930 | 1200 | 0 | 1800 | 1945 | 1095 | 1960 | 0 | 1130 | 0 | |
| 9 | 0 | 0 | 0 | 0 | 1090 | 0 | 1810 | 0 | 1160 | 0 | 1850 | 0 | 0 | 0 | 1880 | 0 | 1200 | 0 | 1800 | 1945 | 1095 | 1960 | 0 | 1130 | 0 |
| 10 | 0 | 0 | 0 | 0 | 1090 | 0 | 1810 | 0 | 1160 | 0 | 1850 | 0 | 0 | 0 | 0 | 0 | 1200 | 0 | 1800 | 1945 | 0 | 1960 | 0 | 0 | 0 |
| 11 | 0 | 0 | 0 | 0 | 1090 | 0 | 1810 | 0 | 1160 | 0 | 1850 | 0 | 0 | 0 | 0 | 0 | 1200 | 0 | 1800 | 1945 | 0 | 1960 | 0 | 0 | 0 |
| 12 | 0 | 0 | 0 | 0 | 0 | 0 | 1810 | 0 | 1160 | 0 | 0 | 0 | 0 | 0 | 0 | 0 | 1200 | 0 | 0 | 1945 | 0 | 0 | 0 | 0 | 0 |
| Customers | |||||||||||||||||||||||||
| Time Periods | 26* | 27* | 28 | 29 | 30* | 31* | 32 | 33* | 34 | 35 | 36* | 37 | 38* | 39 | 40* | 41 | 42 | 43 | 44* | 45* | 46 | 47* | 48 | 49* | 50* |
| 1 | 1180 | 0 | 2050 | 0 | 0 | 1120 | 0 | 0 | 1900 | 0 | 0 | 0 | 0 | 0 | 1085 | 0 | 0 | 1860 | 0 | 0 | 0 | 0 | 0 | 1125 | 0 |
| 2 | 1180 | 0 | 2050 | 0 | 0 | 0 | 0 | 0 | 1900 | 0 | 0 | 0 | 0 | 0 | 1085 | 0 | 0 | 1860 | 0 | 0 | 0 | 0 | 0 | 1125 | 0 |
| 3 | 1180 | 0 | 2050 | 0 | 0 | 0 | 1850 | 0 | 0 | 0 | 0 | 1950 | 0 | 0 | 1085 | 0 | 0 | 1860 | 1150 | 0 | 1920 | 0 | 0 | 1125 | 0 |
| 4 | 1180 | 0 | 2050 | 0 | 1140 | 0 | 1850 | 1150 | 0 | 0 | 0 | 1950 | 0 | 1800 | 0 | 0 | 0 | 1860 | 1150 | 1125 | 1920 | 1210 | 0 | 1125 | 0 |
| 5 | 1180 | 0 | 2050 | 0 | 1140 | 0 | 1850 | 1150 | 0 | 0 | 0 | 1950 | 0 | 1800 | 0 | 0 | 0 | 1860 | 1150 | 0 | 1920 | 0 | 0 | 0 | 0 |
| 6 | 1180 | 0 | 2050 | 1820 | 1140 | 0 | 1850 | 1150 | 0 | 0 | 0 | 1950 | 0 | 1800 | 0 | 0 | 0 | 1860 | 1150 | 0 | 1920 | 0 | 0 | 0 | 0 |
| 7 | 1180 | 1095 | 0 | 1820 | 1140 | 0 | 1850 | 1150 | 0 | 0 | 0 | 1950 | 0 | 0 | 0 | 0 | 2030 | 1860 | 1150 | 0 | 1920 | 0 | 0 | 0 | 0 |
| 8 | 1180 | 1095 | 0 | 1820 | 1140 | 0 | 0 | 0 | 0 | 0 | 0 | 1950 | 1190 | 0 | 0 | 1975 | 0 | 1860 | 1150 | 0 | 1920 | 0 | 0 | 0 | 0 |
| 9 | 0 | 1095 | 0 | 1820 | 1140 | 0 | 0 | 0 | 0 | 0 | 0 | 1950 | 1190 | 0 | 0 | 1975 | 0 | 0 | 1150 | 0 | 1920 | 0 | 0 | 0 | 1170 |
| 10 | 0 | 1095 | 0 | 1820 | 1140 | 0 | 0 | 0 | 0 | 0 | 0 | 0 | 1190 | 0 | 0 | 1975 | 0 | 0 | 0 | 0 | 1920 | 0 | 2020 | 0 | 1170 |
| 11 | 0 | 1095 | 0 | 1820 | 0 | 0 | 0 | 0 | 0 | 0 | 1200 | 0 | 1190 | 0 | 0 | 1975 | 0 | 0 | 0 | 0 | 0 | 0 | 2020 | 0 | 1170 |
| 12 | 0 | 1095 | 0 | 0 | 0 | 0 | 0 | 0 | 0 | 2000 | 1200 | 0 | 1190 | 0 | 0 | 1975 | 0 | 0 | 0 | 0 | 0 | 0 | 2020 | 0 | 1170 |
| Customers | ||||||||||||||||||||||||||
|---|---|---|---|---|---|---|---|---|---|---|---|---|---|---|---|---|---|---|---|---|---|---|---|---|---|---|
| Time Periods | 1 | 2* | 3* | 4 | 5* | 6 | 7 | 8* | 9* | 10 | 11 | 12* | 13 | 14* | 15 | 16 | 17* | 18 | 19 | 20 | 21* | 22 | 23* | 24* | 25 | |
| 1 | 394.8 | 0 | 0 | 415.6 | 0 | 374 | 0 | 226.5 | 0 | 405.2 | 0 | 232.7 | 0 | 0 | 0 | 0 | 0 | 415.6 | 0 | 0 | 0 | 0 | 251.4 | 0 | 0 | |
| 2 | 394.8 | 0 | 0 | 415.6 | 0 | 374 | 0 | 226.5 | 0 | 405.2 | 0 | 232.7 | 0 | 0 | 0 | 401 | 0 | 415.6 | 0 | 0 | 0 | 0 | 251.4 | 0 | 0 | |
| 3 | 0 | 0 | 228.6 | 415.6 | 0 | 374 | 0 | 226.5 | 0 | 405.2 | 384.4 | 232.7 | 389.6 | 0 | 0 | 401 | 0 | 0 | 374 | 0 | 0 | 0 | 251.4 | 0 | 402.1 | |
| 4 | 0 | 0 | 228.6 | 415.6 | 0 | 374 | 0 | 226.5 | 0 | 405.2 | 384.4 | 232.7 | 389.6 | 0 | 0 | 401 | 0 | 0 | 374 | 0 | 0 | 0 | 251.4 | 0 | 402.1 | |
| 5 | 0 | 239 | 228.6 | 415.6 | 0 | 374 | 0 | 226.5 | 0 | 405.2 | 384.4 | 0 | 389.6 | 247.3 | 0 | 401 | 0 | 0 | 374 | 0 | 0 | 0 | 251.4 | 0 | 402.1 | |
| 6 | 0 | 239 | 228.6 | 415.6 | 226.5 | 374 | 0 | 0 | 0 | 405.2 | 384.4 | 0 | 389.6 | 247.3 | 0 | 401 | 0 | 0 | 374 | 0 | 227.5 | 407.3 | 251.4 | 234.8 | 0 | |
| 7 | 0 | 239 | 228.6 | 415.6 | 226.5 | 374 | 0 | 0 | 0 | 405.2 | 384.4 | 0 | 389.6 | 247.3 | 0 | 401 | 249.4 | 0 | 374 | 0 | 227.5 | 407.3 | 251.4 | 234.8 | 0 | |
| 8 | 0 | 0 | 0 | 415.6 | 226.5 | 0 | 376.1 | 0 | 0 | 0 | 384.4 | 0 | 389.6 | 247.3 | 390.6 | 401 | 249.4 | 0 | 374 | 404.2 | 227.5 | 407.3 | 0 | 234.8 | 0 | |
| 9 | 0 | 0 | 0 | 0 | 226.5 | 0 | 376.1 | 0 | 241 | 0 | 384.4 | 0 | 0 | 0 | 390.6 | 0 | 249.4 | 0 | 374 | 404.2 | 227.5 | 407.3 | 0 | 234.8 | 0 | |
| 10 | 0 | 0 | 0 | 0 | 226.5 | 0 | 376.1 | 0 | 241 | 0 | 384.4 | 0 | 0 | 0 | 0 | 0 | 249.4 | 0 | 374 | 404.2 | 0 | 407.3 | 0 | 0 | 0 | |
| 11 | 0 | 0 | 0 | 0 | 226.5 | 0 | 376.1 | 0 | 241 | 0 | 384.4 | 0 | 0 | 0 | 0 | 0 | 249.4 | 0 | 374 | 404.2 | 0 | 407.3 | 0 | 0 | 0 | |
| 12 | 0 | 0 | 0 | 0 | 0 | 0 | 376.1 | 0 | 241 | 0 | 0 | 0 | 0 | 0 | 0 | 0 | 249.4 | 0 | 0 | 404.2 | 0 | 0 | 0 | 0 | 0 | |
| Customers | ||||||||||||||||||||||||||
| Time Periods | 26* | 27* | 28 | 29 | 30* | 31* | 32 | 33* | 34 | 35 | 36* | 37 | 38* | 39 | 40* | 41 | 42 | 43 | 44* | 45* | 46 | 47* | 48 | 49* | 50* | |
| 1 | 245.2 | 0 | 426 | 0 | 0 | 232.7 | 0 | 0 | 394.8 | 0 | 0 | 0 | 0 | 0 | 225.5 | 0 | 0 | 386.5 | 0 | 0 | 0 | 0 | 0 | 233.8 | 0 | |
| 2 | 245.2 | 0 | 426 | 0 | 0 | 0 | 0 | 0 | 394.8 | 0 | 0 | 0 | 0 | 0 | 225.5 | 0 | 0 | 386.5 | 0 | 0 | 0 | 0 | 0 | 233.8 | 0 | |
| 3 | 245.2 | 0 | 426 | 0 | 0 | 0 | 384.4 | 0 | 0 | 0 | 0 | 405.2 | 0 | 0 | 225.5 | 0 | 0 | 386.5 | 239 | 0 | 399 | 0 | 0 | 233.8 | 0 | |
| 4 | 245.2 | 0 | 426 | 0 | 236.9 | 0 | 384.4 | 239 | 0 | 0 | 0 | 405.2 | 0 | 374 | 0 | 0 | 0 | 386.5 | 239 | 233.8 | 399 | 251.4 | 0 | 233.8 | 0 | |
| 5 | 245.2 | 0 | 426 | 0 | 236.9 | 0 | 384.4 | 239 | 0 | 0 | 0 | 405.2 | 0 | 374 | 0 | 0 | 0 | 386.5 | 239 | 0 | 399 | 0 | 0 | 0 | 0 | |
| 6 | 245.2 | 0 | 426 | 378.2 | 236.9 | 0 | 384.4 | 239 | 0 | 0 | 0 | 405.2 | 0 | 374 | 0 | 0 | 0 | 386.5 | 239 | 0 | 399 | 0 | 0 | 0 | 0 | |
| 7 | 245.2 | 227.5 | 0 | 378.2 | 236.9 | 0 | 384.4 | 239 | 0 | 0 | 0 | 405.2 | 0 | 0 | 0 | 0 | 421.8 | 386.5 | 239 | 0 | 399 | 0 | 0 | 0 | 0 | |
| 8 | 245.2 | 227.5 | 0 | 378.2 | 236.9 | 0 | 0 | 0 | 0 | 0 | 0 | 405.2 | 247.3 | 0 | 0 | 410.4 | 0 | 386.5 | 239 | 0 | 399 | 0 | 0 | 0 | 0 | |
| 9 | 0 | 227.5 | 0 | 378.2 | 236.9 | 0 | 0 | 0 | 0 | 0 | 0 | 405.2 | 247.3 | 0 | 0 | 410.4 | 0 | 0 | 239 | 0 | 399 | 0 | 0 | 0 | 243.1 | |
| 10 | 0 | 227.5 | 0 | 378.2 | 236.9 | 0 | 0 | 0 | 0 | 0 | 0 | 0 | 247.3 | 0 | 0 | 410.4 | 0 | 0 | 0 | 0 | 399 | 0 | 419.7 | 0 | 243.1 | |
| 11 | 0 | 227.5 | 0 | 378.2 | 0 | 0 | 0 | 0 | 0 | 0 | 249.4 | 0 | 247.3 | 0 | 0 | 410.4 | 0 | 0 | 0 | 0 | 0 | 0 | 419.7 | 0 | 243.1 | |
| 12 | 0 | 227.5 | 0 | 0 | 0 | 0 | 0 | 0 | 0 | 415.6 | 249.4 | 0 | 247.3 | 0 | 0 | 410.4 | 0 | 0 | 0 | 0 | 0 | 0 | 419.7 | 0 | 243.1 | |
| Customers | |||||||||||||||||||||||||
|---|---|---|---|---|---|---|---|---|---|---|---|---|---|---|---|---|---|---|---|---|---|---|---|---|---|
| Service Providers | 1 | 2* | 3* | 4 | 5* | 6 | 7 | 8* | 9* | 10 | 11 | 12* | 13 | 14* | 15 | 16 | 17* | 18 | 19 | 20 | 21* | 22 | 23* | 24* | 25 |
| 1 | 0 | 76.45 | 75.75 | 24.66 | 85.8 | 36.93 | 59.08 | 23.09 | 41.02 | 32.39 | 92.76 | 75.81 | 98.93 | 77.4 | 59.06 | 53.58 | 64.49 | 51.21 | 41.67 | 28.33 | 79.55 | 81.96 | 60.83 | 57.24 | 25.21 |
| 2 | 76.67 | 0 | 149.79 | 54.2 | 162.49 | 45.09 | 133.91 | 72.32 | 114.54 | 95.24 | 170.03 | 150.87 | 110.74 | 152.44 | 133.95 | 128.47 | 13.16 | 100.46 | 86.4 | 74.12 | 154.74 | 110.31 | 101.21 | 90.9 | 83.09 |
| 3 | 74.73 | 148.98 | 0 | 98.46 | 15.65 | 109.46 | 20.52 | 82.89 | 73.87 | 60.1 | 24.15 | 11.4 | 155.94 | 36.81 | 23.25 | 33.86 | 137.02 | 74.42 | 80.25 | 82.24 | 37 | 95.98 | 83.84 | 90.66 | 85.57 |
| 4 | 24.82 | 54.27 | 99.44 | 0 | 109.35 | 19.71 | 82.37 | 25.82 | 59.59 | 49.5 | 116.61 | 99.27 | 86.9 | 100.37 | 82.36 | 76.4 | 42.31 | 61.5 | 46.95 | 31.92 | 103.15 | 86.67 | 66.84 | 60.53 | 32.89 |
| 5 | 85.63 | 161.95 | 15.23 | 109.01 | 0 | 121.44 | 29.01 | 98.12 | 78.6 | 75.33 | 9.32 | 11.96 | 165.56 | 37.22 | 31.36 | 41.97 | 149 | 89.65 | 95.48 | 97.47 | 33.49 | 112.43 | 99.07 | 105.89 | 95.12 |
| 6 | 37.03 | 45 | 110.15 | 19.74 | 121.31 | 0 | 94.27 | 32.54 | 76.82 | 55.6 | 128.57 | 111.23 | 102.23 | 112.8 | 94.31 | 88.83 | 33.04 | 60.82 | 47.8 | 34.51 | 115.1 | 81.54 | 66.76 | 57.44 | 52.54 |
| 7 | 58.76 | 133.92 | 21.88 | 81.97 | 30.15 | 94.4 | 0 | 74.16 | 56.05 | 55.17 | 36.66 | 20.16 | 138.26 | 31.62 | 7.12 | 15.93 | 121.96 | 72.68 | 75.45 | 73.56 | 31.81 | 101.09 | 82.1 | 87.1 | 68.25 |
| 8 | 25.05 | 72.09 | 84.34 | 25.87 | 98.35 | 32.51 | 74.2 | 0 | 65.54 | 24.08 | 106.85 | 89.2 | 112.69 | 95.35 | 75.74 | 71.53 | 60.13 | 36.19 | 21.64 | 7.17 | 97.65 | 62.54 | 41.53 | 36.4 | 47.85 |
| 9 | 41.25 | 116.22 | 74.95 | 59.38 | 78.57 | 76.91 | 56.15 | 63.82 | 0 | 62.91 | 81.74 | 69.88 | 95.34 | 47.17 | 53.88 | 41.12 | 102.38 | 85.05 | 82.4 | 69.06 | 50.99 | 116.3 | 95.54 | 95.8 | 33.47 |
| 10 | 32.24 | 94.96 | 61.53 | 49.55 | 75.54 | 55.44 | 55.13 | 24.06 | 63.2 | 0 | 84.04 | 69.65 | 130.46 | 84.9 | 61.75 | 61.08 | 83 | 24.99 | 23.17 | 23.41 | 86.66 | 56.17 | 34.82 | 36.31 | 56.06 |
| 11 | 92.94 | 170.2 | 23.9 | 116.63 | 8.99 | 129.06 | 36.58 | 106.79 | 81.83 | 84 | 0 | 19.39 | 170.83 | 39.76 | 35.93 | 46.54 | 156.62 | 100.67 | 104.15 | 106.14 | 36.04 | 121.1 | 108.01 | 115.8 | 102 |
| 12 | 75.98 | 151.31 | 12.11 | 99.36 | 12.09 | 111.79 | 19.36 | 89.42 | 69.89 | 69.57 | 19.17 | 0 | 154.82 | 29.47 | 20.66 | 31.27 | 139.35 | 83.89 | 89.72 | 88.77 | 29.66 | 106.12 | 93.31 | 100.13 | 85.47 |
| 13 | 98.77 | 110.77 | 157.32 | 86.78 | 165.84 | 102.04 | 138.6 | 112.53 | 95.07 | 130.29 | 170.91 | 154.71 | 0 | 135.63 | 136.33 | 127.39 | 106.98 | 148.21 | 133.66 | 118.63 | 139.45 | 173.38 | 153.55 | 147.24 | 75.07 |
| 14 | 78.06 | 152.75 | 37.49 | 99.28 | 36.9 | 113.23 | 31.54 | 95.4 | 46.72 | 84.96 | 39.83 | 29.55 | 135.47 | 0 | 30.48 | 25.67 | 140.79 | 104.03 | 106.08 | 98.53 | 4.9 | 130.27 | 113.45 | 118.48 | 78.21 |
| 15 | 59.29 | 134.16 | 24.17 | 82.46 | 31.67 | 94.64 | 7.08 | 75.53 | 53.83 | 61.68 | 36.04 | 20.77 | 136.33 | 30.55 | 0 | 13.3 | 122.2 | 79.68 | 81.96 | 78.19 | 30.74 | 108.07 | 89.1 | 93.61 | 68.06 |
| 16 | 53.97 | 128.64 | 34.72 | 76.39 | 42.22 | 89.12 | 15.94 | 71.31 | 41.13 | 60.87 | 46.59 | 31.32 | 127.73 | 25.4 | 13.3 | 0 | 116.68 | 80.59 | 81.91 | 74.44 | 27.55 | 110.13 | 90.01 | 93.61 | 61.11 |
| 17 | 65.11 | 12.86 | 138.23 | 42.58 | 149.39 | 33.53 | 122.35 | 60.76 | 102.92 | 83.68 | 156.65 | 139.31 | 107.45 | 140.88 | 122.39 | 116.91 | 0 | 88.9 | 75.88 | 62.59 | 143.18 | 104.71 | 94.84 | 85.3 | 75.01 |
| 18 | 50.9 | 100.41 | 75.84 | 61.99 | 89.85 | 60.89 | 73.05 | 36.71 | 84.96 | 24.79 | 101.08 | 83.96 | 148.45 | 104.3 | 80.09 | 80.48 | 88.45 | 0 | 18.25 | 31.16 | 104.58 | 32.93 | 11.58 | 17.68 | 74.73 |
| 19 | 41.14 | 85.71 | 81.39 | 46.91 | 95.4 | 47.55 | 75.24 | 21.65 | 81.63 | 23.29 | 103.9 | 89.51 | 133.73 | 105.92 | 81.86 | 81.7 | 75.11 | 17.65 | 0 | 16.08 | 106.77 | 43.23 | 21.06 | 17.44 | 63.77 |
| 20 | 28.83 | 73.34 | 83.67 | 31.83 | 97.68 | 34.2 | 73.54 | 7.24 | 69.32 | 23.41 | 106.18 | 88.53 | 118.65 | 98.21 | 78.38 | 74.39 | 61.76 | 30.9 | 16.35 | 0 | 100.51 | 56.07 | 36.24 | 29.93 | 51.46 |
| Customers | |||||||||||||||||||||||||
|---|---|---|---|---|---|---|---|---|---|---|---|---|---|---|---|---|---|---|---|---|---|---|---|---|---|
| Service Providers | 26* | 27* | 28 | 29 | 30* | 31* | 32 | 33* | 34 | 35 | 36* | 37 | 38* | 39 | 40* | 41 | 42 | 43 | 44* | 45* | 46 | 47* | 48 | 49* | 50* |
| 1 | 33.3 | 34.3 | 74.1 | 71.8 | 27.5 | 40.5 | 98.4 | 73.2 | 38.6 | 99.9 | 6.2 | 81.7 | 67.7 | 74.1 | 66.8 | 17.3 | 95.9 | 63.4 | 88.6 | 21.5 | 38.6 | 50.4 | 36 | 91 | 70.8 |
| 2 | 106.9 | 84.9 | 25.7 | 143 | 89 | 114.4 | 128.3 | 148.3 | 61.4 | 176.6 | 72.9 | 156.3 | 141.7 | 15.9 | 141.3 | 92.1 | 174.6 | 138.4 | 165.3 | 96.3 | 112.2 | 29.3 | 110.9 | 25.5 | 102.8 |
| 3 | 60.7 | 75.9 | 134.3 | 25.9 | 66.3 | 35.6 | 155.8 | 8.8 | 104.7 | 29.8 | 76.5 | 8.7 | 8.6 | 144.6 | 55.2 | 59 | 23 | 30.7 | 18.4 | 54.1 | 60.5 | 123 | 41.1 | 169.4 | 92.2 |
| 4 | 51.9 | 41.5 | 61.6 | 92.8 | 42.9 | 64.2 | 94.7 | 96.7 | 23.2 | 123.5 | 22.8 | 105.7 | 91.1 | 51.9 | 86.9 | 40.6 | 119.6 | 86.2 | 112.1 | 44.8 | 57.2 | 26.5 | 59.3 | 67.8 | 74.1 |
| 5 | 69.5 | 91.1 | 149.6 | 41 | 81.6 | 49.4 | 165.4 | 14 | 114.3 | 16.6 | 88.8 | 13.6 | 23.9 | 158.6 | 57.1 | 69.2 | 21.3 | 35.6 | 3.6 | 65.1 | 69 | 134.9 | 51 | 178.4 | 108.6 |
| 6 | 69.1 | 45.4 | 47.6 | 103.3 | 49.3 | 74.8 | 110.1 | 108.6 | 38.6 | 135.4 | 33.3 | 116.7 | 102.1 | 42.7 | 102.1 | 52.5 | 131 | 98.8 | 124.1 | 56.7 | 74.5 | 17.7 | 71.2 | 59.5 | 71 |
| 7 | 42.9 | 68.9 | 125.7 | 32.3 | 57.7 | 22.4 | 137.7 | 17.6 | 87.4 | 44.3 | 61.7 | 28.2 | 17.2 | 131.6 | 44.6 | 42.4 | 42.2 | 16.7 | 32.9 | 38.2 | 42.6 | 107.9 | 24.1 | 148.4 | 94 |
| 8 | 55.5 | 16 | 56.8 | 74.7 | 17.8 | 52.3 | 120.5 | 86.6 | 49 | 112.5 | 19.5 | 89.1 | 75.9 | 65.5 | 87.5 | 38 | 101.5 | 81.3 | 101.1 | 37.6 | 60.5 | 45.7 | 52.5 | 86.6 | 50 |
| 9 | 14.1 | 73 | 115 | 79 | 61.8 | 45.2 | 94.8 | 68.3 | 56.7 | 89.6 | 46.9 | 80.9 | 69.3 | 112 | 30 | 31.4 | 95.1 | 49.4 | 78.9 | 33.7 | 15.1 | 85.8 | 34.8 | 124.9 | 106.9 |
| 10 | 49.5 | 15.8 | 75.5 | 51.9 | 6.9 | 33.2 | 129.9 | 67.1 | 68 | 89.7 | 27.9 | 66.3 | 53.1 | 84.2 | 80.7 | 34 | 78.7 | 70.9 | 78.3 | 30.3 | 54.5 | 68.9 | 40.6 | 109.5 | 46.2 |
| 11 | 74.1 | 99.8 | 158.2 | 49.6 | 90.2 | 57.7 | 169 | 21.5 | 121.7 | 8.1 | 96.2 | 22.3 | 32.5 | 167.9 | 60.3 | 75.6 | 25.8 | 38.9 | 6.8 | 72 | 73.6 | 142.6 | 56.7 | 186.6 | 117.3 |
| 12 | 58.8 | 84.1 | 141.7 | 36 | 72.9 | 39.7 | 154.7 | 2.8 | 104.6 | 27 | 79.1 | 16.2 | 17.1 | 149 | 48.4 | 59.6 | 28.8 | 26.9 | 14.9 | 55.4 | 58.3 | 125.3 | 41.3 | 168.7 | 102.3 |
| 13 | 98.1 | 128.2 | 126.4 | 160.5 | 124.8 | 126.7 | 21.6 | 152.5 | 64 | 178.8 | 102.9 | 163.6 | 151.7 | 116.6 | 112.8 | 103.2 | 178.1 | 137.2 | 167.1 | 108.5 | 100.3 | 101.9 | 116.3 | 108.3 | 160.8 |
| 14 | 49.1 | 96.4 | 148.5 | 60.2 | 85.1 | 53.8 | 133.8 | 28.4 | 101.5 | 46.4 | 82.3 | 43.5 | 42 | 150.4 | 24.4 | 60.9 | 55.5 | 19.1 | 37.2 | 58.7 | 44.2 | 125.8 | 45.4 | 177.8 | 125.3 |
| 15 | 40.8 | 73.5 | 128.6 | 38.1 | 62.3 | 29.4 | 135.8 | 18.6 | 87.6 | 43.9 | 62.4 | 31.6 | 22.7 | 131.8 | 42.8 | 42.3 | 45 | 14.9 | 32.9 | 38.8 | 40.3 | 108.1 | 23.5 | 148.7 | 101 |
| 16 | 31.8 | 72.2 | 124.4 | 48.2 | 61 | 32.1 | 127.2 | 29.1 | 80.9 | 54.5 | 58.2 | 42.2 | 33 | 126.3 | 31.5 | 36.8 | 55.5 | 9.8 | 43.5 | 34.6 | 27.6 | 102.6 | 21.3 | 143.1 | 101.9 |
| 17 | 95.2 | 73.5 | 20.1 | 131.4 | 77.4 | 102.8 | 125 | 136.7 | 53.3 | 165.1 | 61.4 | 144.7 | 130.1 | 10.3 | 130.2 | 80.6 | 159.3 | 126.8 | 152.2 | 84.7 | 100.6 | 17.7 | 99.3 | 37.5 | 97.2 |
| 18 | 71.2 | 22.5 | 80 | 53.9 | 26.4 | 51.1 | 147.9 | 81.4 | 85.1 | 106.7 | 45.9 | 80.6 | 67.4 | 88.7 | 101.8 | 55.7 | 91.3 | 89.7 | 92.6 | 52.1 | 76.2 | 74.4 | 60.7 | 114.9 | 23.3 |
| 19 | 69.6 | 12.3 | 64.9 | 64.6 | 23.7 | 53.3 | 136.9 | 86.9 | 70.1 | 109.5 | 35.6 | 86.1 | 73 | 73.6 | 101.1 | 53.6 | 98.6 | 91.5 | 98.2 | 50.5 | 74.7 | 61 | 61.5 | 101.6 | 30.6 |
| 20 | 58.3 | 12.8 | 52.5 | 74 | 17.1 | 51.6 | 124.6 | 85.9 | 55 | 111.8 | 23.3 | 88.4 | 75.2 | 61.2 | 90.4 | 40.8 | 100.9 | 84.2 | 100.4 | 40.5 | 63.3 | 47.7 | 55.4 | 88.2 | 43.5 |
| Customers | |||||||||||||||||||||||||
|---|---|---|---|---|---|---|---|---|---|---|---|---|---|---|---|---|---|---|---|---|---|---|---|---|---|
| Service Providers | 1 | 2* | 3* | 4 | 5* | 6 | 7 | 8* | 9* | 10 | 11 | 12* | 13 | 14* | 15 | 16 | 17* | 18 | 19 | 20 | 21* | 22 | 23* | 24* | 25 |
| 1 | 0 | 89.17 | 88.35 | 28.76 | 100.08 | 43.08 | 68.91 | 26.93 | 47.85 | 37.78 | 108.2 | 88.43 | 115.39 | 90.28 | 68.89 | 62.5 | 75.22 | 59.73 | 48.6 | 33.04 | 92.79 | 95.6 | 70.95 | 66.76 | 29.4 |
| 2 | 89.43 | 0 | 174.72 | 63.22 | 189.53 | 52.59 | 156.19 | 84.35 | 133.6 | 111.09 | 198.33 | 175.98 | 129.17 | 177.81 | 156.24 | 149.85 | 15.35 | 117.18 | 100.78 | 86.45 | 180.49 | 128.67 | 118.05 | 106.03 | 96.92 |
| 3 | 87.17 | 173.77 | 0 | 114.84 | 18.25 | 127.67 | 23.93 | 96.68 | 86.16 | 70.1 | 28.17 | 13.3 | 181.89 | 42.94 | 27.12 | 39.49 | 159.82 | 86.8 | 93.6 | 95.92 | 43.16 | 111.95 | 97.79 | 105.75 | 99.81 |
| 4 | 28.95 | 63.3 | 115.99 | 0 | 127.55 | 22.99 | 96.08 | 30.12 | 69.51 | 57.74 | 136.01 | 115.79 | 101.36 | 117.07 | 96.06 | 89.11 | 49.35 | 71.73 | 54.76 | 37.23 | 120.31 | 101.09 | 77.96 | 70.6 | 38.36 |
| 5 | 99.88 | 188.9 | 17.76 | 127.15 | 0 | 141.65 | 33.84 | 114.45 | 91.68 | 87.86 | 10.87 | 13.95 | 193.11 | 43.41 | 36.58 | 48.95 | 173.8 | 104.57 | 111.37 | 113.69 | 39.06 | 131.14 | 115.56 | 123.51 | 110.95 |
| 6 | 43.19 | 52.49 | 128.48 | 23.02 | 141.5 | 0 | 109.96 | 37.95 | 89.6 | 64.85 | 149.97 | 129.74 | 119.24 | 131.57 | 110 | 103.61 | 38.54 | 70.94 | 55.75 | 40.25 | 134.25 | 95.11 | 77.87 | 67 | 61.28 |
| 7 | 68.54 | 156.21 | 25.52 | 95.61 | 35.17 | 110.11 | 0 | 86.5 | 65.38 | 64.35 | 42.76 | 23.51 | 161.27 | 36.88 | 8.3 | 18.58 | 142.26 | 84.77 | 88 | 85.8 | 37.1 | 117.91 | 95.76 | 101.59 | 79.61 |
| 8 | 29.22 | 84.09 | 98.37 | 30.17 | 114.72 | 37.92 | 86.55 | 0 | 76.45 | 28.09 | 124.63 | 104.04 | 131.44 | 111.22 | 88.34 | 83.43 | 70.14 | 42.21 | 25.24 | 8.36 | 113.9 | 72.95 | 48.44 | 42.46 | 55.81 |
| 9 | 48.11 | 135.56 | 87.42 | 69.26 | 91.64 | 89.71 | 65.49 | 74.44 | 0 | 73.38 | 95.34 | 81.51 | 111.2 | 55.02 | 62.85 | 47.96 | 119.42 | 99.2 | 96.11 | 80.55 | 59.47 | 135.65 | 111.44 | 111.74 | 39.04 |
| 10 | 37.6 | 110.76 | 71.77 | 57.8 | 88.11 | 64.67 | 64.3 | 28.06 | 73.72 | 0 | 98.02 | 81.24 | 152.17 | 99.03 | 72.03 | 71.24 | 96.81 | 29.15 | 27.03 | 27.31 | 101.08 | 65.52 | 40.61 | 42.35 | 65.39 |
| 11 | 108.41 | 198.52 | 27.88 | 136.04 | 10.49 | 150.54 | 42.67 | 124.56 | 95.45 | 97.98 | 0 | 22.62 | 199.26 | 46.38 | 41.91 | 54.28 | 182.68 | 117.42 | 121.48 | 123.8 | 42.04 | 141.25 | 125.98 | 135.07 | 118.97 |
| 12 | 88.62 | 176.49 | 14.13 | 115.89 | 14.1 | 130.39 | 22.58 | 104.3 | 81.52 | 81.15 | 22.36 | 0 | 180.58 | 34.37 | 24.1 | 36.47 | 162.54 | 97.85 | 104.65 | 103.54 | 34.6 | 123.78 | 108.84 | 116.79 | 99.69 |
| 13 | 115.21 | 129.2 | 183.5 | 101.22 | 193.44 | 119.02 | 161.66 | 131.25 | 110.89 | 151.97 | 199.35 | 180.45 | 0 | 158.2 | 159.02 | 148.59 | 124.78 | 172.87 | 155.9 | 138.37 | 162.65 | 202.23 | 179.1 | 171.74 | 87.56 |
| 14 | 91.05 | 178.17 | 43.73 | 115.8 | 43.04 | 132.07 | 36.79 | 111.27 | 54.49 | 99.1 | 46.46 | 34.47 | 158.01 | 0 | 35.55 | 29.94 | 164.22 | 121.34 | 123.73 | 114.93 | 5.72 | 151.95 | 132.33 | 138.2 | 91.22 |
| 15 | 69.16 | 156.49 | 28.19 | 96.18 | 36.94 | 110.39 | 8.26 | 88.1 | 62.79 | 71.94 | 42.04 | 24.23 | 159.02 | 35.63 | 0 | 15.51 | 142.54 | 92.94 | 95.6 | 91.2 | 35.86 | 126.05 | 103.93 | 109.19 | 79.39 |
| 16 | 62.95 | 150.05 | 40.5 | 89.1 | 49.25 | 103.95 | 18.59 | 83.18 | 47.97 | 71 | 54.34 | 36.53 | 148.98 | 29.63 | 15.51 | 0 | 136.1 | 94 | 95.54 | 86.83 | 32.13 | 128.46 | 104.99 | 109.19 | 71.28 |
| 17 | 75.95 | 15 | 161.23 | 49.67 | 174.25 | 39.11 | 142.71 | 70.87 | 120.05 | 97.6 | 182.72 | 162.49 | 125.33 | 164.32 | 142.76 | 136.36 | 0 | 103.69 | 88.51 | 73 | 167.01 | 122.13 | 110.62 | 99.49 | 87.49 |
| 18 | 59.37 | 117.12 | 88.46 | 72.31 | 104.8 | 71.02 | 85.21 | 42.82 | 99.1 | 28.92 | 117.9 | 97.93 | 173.15 | 121.66 | 93.42 | 93.87 | 103.17 | 0 | 21.29 | 36.35 | 121.98 | 38.41 | 13.51 | 20.62 | 87.17 |
| 19 | 47.99 | 99.97 | 94.93 | 54.72 | 111.27 | 55.46 | 87.76 | 25.25 | 95.21 | 27.17 | 121.19 | 104.4 | 155.98 | 123.55 | 95.48 | 95.29 | 87.61 | 20.59 | 0 | 18.76 | 124.54 | 50.42 | 24.56 | 20.34 | 74.38 |
| 20 | 33.63 | 85.54 | 97.59 | 37.13 | 113.93 | 39.89 | 85.78 | 8.44 | 80.85 | 27.31 | 123.85 | 103.26 | 138.39 | 114.55 | 91.42 | 86.77 | 72.04 | 36.04 | 19.07 | 0 | 117.23 | 65.4 | 42.27 | 34.91 | 60.02 |
| Customers | |||||||||||||||||||||||||
|---|---|---|---|---|---|---|---|---|---|---|---|---|---|---|---|---|---|---|---|---|---|---|---|---|---|
| Service Providers | 26* | 27* | 28 | 29 | 30* | 31* | 32 | 33* | 34 | 35 | 36* | 37 | 38* | 39 | 40* | 41 | 42 | 43 | 44* | 45* | 46 | 47* | 48 | 49* | 50* |
| 1 | 38.79 | 40.04 | 86.38 | 83.76 | 32.06 | 47.29 | 114.75 | 85.4 | 44.99 | 116.56 | 7.21 | 95.27 | 78.98 | 86.44 | 77.96 | 20.12 | 111.9 | 73.9 | 103.3 | 25.09 | 45.01 | 58.81 | 41.97 | 106.09 | 82.6 |
| 2 | 124.63 | 99.06 | 29.95 | 166.76 | 103.76 | 133.43 | 149.65 | 172.96 | 71.58 | 206.01 | 85.08 | 182.31 | 165.27 | 18.56 | 164.78 | 107.47 | 203.62 | 161.43 | 192.75 | 112.33 | 130.85 | 34.14 | 129.32 | 29.73 | 119.91 |
| 3 | 70.78 | 88.47 | 156.69 | 30.16 | 77.38 | 41.47 | 181.69 | 10.28 | 122.15 | 34.74 | 89.24 | 10.14 | 10.08 | 168.68 | 64.43 | 68.82 | 26.77 | 35.82 | 21.47 | 63.14 | 70.53 | 143.41 | 47.97 | 197.59 | 107.5 |
| 4 | 60.54 | 48.39 | 71.8 | 108.2 | 50.07 | 74.89 | 110.5 | 112.77 | 27.08 | 144.03 | 26.55 | 123.3 | 106.26 | 60.57 | 101.41 | 47.3 | 139.52 | 100.52 | 130.77 | 52.25 | 66.75 | 30.87 | 69.13 | 79.02 | 86.44 |
| 5 | 81.04 | 106.24 | 174.46 | 47.76 | 95.14 | 57.61 | 192.91 | 16.36 | 133.29 | 19.32 | 103.52 | 15.87 | 27.84 | 185.02 | 66.61 | 80.74 | 24.89 | 41.57 | 4.18 | 75.92 | 80.46 | 157.38 | 59.44 | 208.08 | 126.68 |
| 6 | 80.63 | 53 | 55.52 | 120.49 | 57.53 | 87.19 | 128.39 | 126.72 | 44.96 | 157.98 | 38.84 | 136.07 | 119.03 | 49.76 | 119.08 | 61.24 | 152.8 | 115.19 | 144.72 | 66.09 | 86.85 | 20.66 | 83.08 | 69.4 | 82.84 |
| 7 | 49.99 | 80.33 | 146.57 | 37.66 | 67.25 | 26.17 | 160.62 | 20.49 | 101.94 | 51.65 | 71.99 | 32.85 | 20.02 | 153.48 | 52.04 | 49.4 | 49.26 | 19.5 | 38.39 | 44.58 | 49.65 | 125.84 | 28.1 | 173.12 | 109.61 |
| 8 | 64.68 | 18.62 | 66.25 | 87.08 | 20.76 | 60.94 | 140.59 | 101.02 | 57.17 | 131.2 | 22.72 | 103.9 | 88.54 | 76.45 | 102.11 | 44.26 | 118.41 | 94.84 | 117.93 | 43.89 | 70.52 | 53.29 | 61.26 | 101 | 58.3 |
| 9 | 16.41 | 85.1 | 134.17 | 92.19 | 72.03 | 52.69 | 110.56 | 79.63 | 66.1 | 104.52 | 54.72 | 94.34 | 80.87 | 130.64 | 34.98 | 36.59 | 110.97 | 57.59 | 92.01 | 39.25 | 17.57 | 100.04 | 40.54 | 145.68 | 124.68 |
| 10 | 57.7 | 18.44 | 88.03 | 60.48 | 8.06 | 38.69 | 151.53 | 78.22 | 79.27 | 104.59 | 32.53 | 77.3 | 61.94 | 98.22 | 94.12 | 39.62 | 91.81 | 82.65 | 91.33 | 35.33 | 63.55 | 80.4 | 47.34 | 127.68 | 53.93 |
| 11 | 86.37 | 116.35 | 184.57 | 57.88 | 105.26 | 67.27 | 197.06 | 25.03 | 142 | 9.41 | 112.2 | 25.99 | 37.95 | 195.79 | 70.38 | 88.12 | 30.05 | 45.34 | 7.95 | 83.97 | 85.79 | 166.27 | 66.13 | 217.7 | 136.8 |
| 12 | 68.56 | 98.07 | 165.29 | 41.99 | 85 | 46.33 | 180.38 | 3.23 | 122.03 | 31.54 | 92.26 | 18.91 | 19.95 | 173.76 | 56.45 | 69.48 | 33.62 | 31.41 | 17.32 | 64.67 | 67.98 | 146.13 | 48.18 | 196.82 | 119.32 |
| 13 | 114.37 | 149.53 | 147.4 | 187.24 | 145.52 | 147.74 | 25.19 | 177.89 | 74.68 | 208.56 | 120.03 | 190.81 | 176.92 | 136 | 131.57 | 120.31 | 207.71 | 160 | 194.87 | 126.51 | 117.04 | 118.86 | 135.59 | 126.31 | 187.58 |
| 14 | 57.31 | 112.42 | 173.21 | 70.25 | 99.25 | 62.74 | 156.11 | 33.15 | 118.39 | 54.07 | 95.97 | 50.75 | 48.95 | 175.44 | 28.46 | 71.01 | 64.76 | 22.23 | 43.4 | 68.47 | 51.58 | 146.76 | 52.91 | 207.42 | 146.17 |
| 15 | 47.6 | 85.73 | 150.03 | 44.43 | 72.66 | 34.34 | 158.37 | 21.66 | 102.12 | 51.22 | 72.8 | 36.88 | 26.5 | 153.76 | 49.9 | 49.35 | 52.45 | 17.36 | 38.37 | 45.2 | 47.02 | 126.12 | 27.36 | 173.4 | 117.77 |
| 16 | 37.11 | 84.23 | 145.11 | 56.16 | 71.15 | 37.46 | 148.34 | 33.97 | 94.3 | 63.52 | 67.87 | 49.19 | 38.51 | 147.32 | 36.75 | 42.91 | 64.76 | 11.41 | 50.68 | 40.37 | 32.15 | 119.68 | 24.81 | 166.96 | 118.83 |
| 17 | 111.08 | 85.75 | 23.42 | 153.28 | 90.28 | 119.94 | 145.81 | 159.47 | 62.16 | 192.53 | 71.59 | 168.83 | 151.78 | 12.03 | 151.83 | 93.99 | 185.76 | 147.95 | 177.47 | 98.84 | 117.29 | 20.59 | 115.84 | 43.73 | 113.37 |
| 18 | 83.08 | 26.19 | 93.29 | 62.81 | 30.83 | 59.59 | 172.51 | 94.91 | 99.3 | 124.47 | 53.51 | 93.99 | 78.63 | 103.48 | 118.75 | 64.95 | 106.43 | 104.61 | 108.02 | 60.71 | 88.93 | 86.76 | 70.77 | 134.03 | 27.13 |
| 19 | 81.23 | 14.31 | 75.64 | 75.3 | 27.62 | 62.15 | 159.73 | 101.38 | 81.71 | 127.76 | 41.49 | 100.46 | 85.1 | 85.84 | 117.89 | 62.55 | 114.97 | 106.7 | 114.49 | 58.86 | 87.07 | 71.2 | 71.71 | 118.47 | 35.73 |
| 20 | 68.01 | 14.95 | 61.21 | 86.3 | 19.98 | 60.16 | 145.37 | 100.24 | 64.12 | 130.42 | 27.13 | 103.12 | 87.76 | 71.41 | 105.44 | 47.6 | 117.63 | 98.18 | 117.15 | 47.23 | 73.86 | 55.63 | 64.6 | 102.9 | 50.75 |

