All published articles of this journal are available on ScienceDirect.

Accuracy of Automatic Passenger Counting in Open Mass Transit Systems: Insights from Italy
Abstract
Background
Accurate knowledge of passenger volumes is critical for enhancing public transportation, particularly in Open (without barriers) Mass Transit (OMT) systems where traditional counting methods may be inadequate. Automatic Passenger Counting (APC) systems offer a reliable solution, yet their performance in OMT remains underexplored. Additionally, a lack of a comprehensive framework for evaluating APC accuracy has limited a full understanding of their effectiveness.
Objective
This study proposes an integrated framework to evaluate the accuracy of APC systems in OMT. The practical effectiveness of this framework is demonstrated through a real-world case study conducted on the Brescia Metro (Italy), showcasing how user-friendly outputs can highlight potential areas for improving the efficient management of APC systems.
Methods
The framework is divided into two blocks. Block 1 selects representative stations and collects passenger data through manual counts and APC systems. Pre-processing ensures the synchronisation of both data sources. Block 2 analyses APC performance at aggregated and disaggregated levels. The aggregated analysis uses several error metrics to assess overall accuracy, with confidence intervals identifying potential systematic errors. The disaggregated analysis examines station-specific performance.
Results
The Brescia Metro’s APC system demonstrated high reliability, with slight overestimations for both entering (+0.52%) and exiting (+1.41%). Errors were classified as random, indicating no need for corrective coefficients. Station-specific analyses revealed that simpler layouts and lower passenger volumes yielded higher accuracy. The performance metrics showed consistency with literature findings but highlighted unique error patterns influenced by open environments.
Conclusions
This study offers practical insights for transportation authorities (TAs), public transport companies (PTCs), and APC producers. It encourages TAs and PTCs to optimise service using real-time passenger flow data from APC. It also advises producers to customise APC systems for stations with complex layouts or higher passenger density. Future research should enhance APC accuracy using advanced analytical methods, integrate emerging technologies such as Wi-Fi and cellular tracking, include more complex case studies, and address data security concerns.
1. INTRODUCTION
Public transportation systems are vital components of urban mobility, requiring effective planning and management to ensure efficient and sustainable operations [1-4]. Accurate knowledge of passenger volumes is essential for both service providers and users [5, 6]
As for service providers, understanding the dynamics of demand enables the optimisation of fleet deployment, reduction of unnecessary operational costs, and enhancement of passenger satisfaction. For instance, implementing operational strategies such as short-turning and limited-stop services can minimise the number of transit vehicles required, thereby lowering costs and improving service efficiency [7].
As for users, real-time information on vehicle occupancy can influence travel decisions, encouraging greater use of public transportation while alleviating urban congestion and pollution. Providing citizens with accurate information on traffic conditions can encourage journeys at times of low congestion and increase the uptake of public transport [8]. Additionally, offering real-time information on vehicle occupancy has the potential to make public transport more attractive, contributing to fewer private vehicles on the road and leading to lower congestion levels and reduced pollution [9].
Estimating passenger volumes may be addressed by counting methods that can be categorised into manual and automatic ones [6]. Manual methods include ride-checks and point-checks (without passenger participation) or the analysis of ticket sales (with passenger participation). However, these methods have significant limitations. Observation-based approaches are time-consuming and resource-intensive, while ticket-based methods often underestimate volumes due to fare evasion or multiple boardings [10-12].
To address these limitations, Automatic Passenger Counting (APC) systems have become a focal point of interest within the Intelligent Transportation Systems (ITS) community. Since their introduction in the mid-1970s, many public transport agencies in the United States and Canada have adopted APC systems [13-16] with subsequent advancements and implementation in Europe. These systems provide a cost-effective and reliable alternative to manual counting methods.
Over time, a diverse array of APC systems has been developed, broadly categorised into traditional and innovative technologies. Traditional APC methods rely on technologies such as infrared sensors, pressure mats, and video recognition [17]. Recent advancements in methodological facets, including artificial intelligence (AI) and deep learning (DL), have spurred the development of innovative APC technologies such as Wi-Fi and cellular tracking systems [18].
The heterogeneity of APC technologies is evident in the literature. Table 1 summarises key studies on APC systems, including technologies, transport mode, number of vehicles tested, sample size, accuracy evaluation metrics, and results. Table 1 is briefly discussed by focusing on each APC technology separately.
| Authors, Year | Ref. | Location | APC Technology | Transport Mode | Vehicles Tested (#) | Sample size (Observations/Duration) | Accuracy Evaluation Metrics | Results |
|---|---|---|---|---|---|---|---|---|
| Strathman et al. (2005) | [19] | Oregon, USA | Infrared | Train | 1 | 144 (observations) | Mean differences between APC and manual counts; Confidence intervals | Underestimates boarding (-9%); overestimates alighting (+10%) |
| Chen et al. (2008) | [20] | Kaohsiung, Taiwan | Video | Bus | 1 | NA | Percentage of correctly identified counts | 92% Accuracy (laboratory) |
| Olivo et al. (2019) | [6] | Cagliari, Italy | Infrared | Bus | 1 | 950 (observations) | Confidence intervals, Mean absolute error; Root mean squared error, | 77% Accuracy; 96% accuracy with a tolerance of ±1 passengers. underestimates both boarding and alighting; systematic error for boarding. |
| Moser et al. (2019) | [21] | Sydney, Australia | Multiple (video, wi-fi, infrared, pressure) | Bus | 2 | NA | Percentage of correctly identified counts | Video: 57%; wi-fi: 16%-75%; infrared: 55% pressure: 83%; |
| Nitti et al. (2020) | [18] | Cagliari, Italy | Wi-fi | Bus | 1 | 21 (observations) | Total number of counts comparison | High accuracy; random errors |
| Haig et al. (2021) | [22] | Pittsburgh, USA | Cellular | Bus | 12 | 246 (observations) | Linear regression model | 79% Accuracy |
| Kim et al. (2022) | [23] | Taegu, South Korea | Video | Bus | 1 | 100 (observations) | Average precision | 99% Accuracy (ideal conditions) |
| Cavallero et al. (2023) | [24] | Turin, Italy | Pressure | Bus | 1 | 679 (observations) | Linear regression model, Confidence intervals, Relative error | 1% ÷ 4% (relative error) |
| Pronello & Garzón Ruiz (2023) | [25] | Turin, Italy | Video (commercial and self-developed) | Bus | 2 | 220 (hours) | Symmetric percentage absolute error | 53% ÷ 55% Accuracy (commercial); 72% ÷ 74% accuracy (self-developed) |
| Pronello et al. (2024) | [26] | Turin, Italy | Wi-fi | Bus | 1 Stop | 14 (hours) | Mean absolute error | Overestimates passenger numbers: 1.2 passengers mean absolute error |
| Barabino et al. (2024) | [27] | Cagliari, Italy | Cellular-app based | Bus | NA | 30 (days) | Mean absolute error; root mean squared error | 2.3 trips Mean absolute error |
Infrared-based systems rely on temperature variations to detect passenger movement and provide moderate accuracy. A research [19] evaluated an infrared-based APC system on trains and noted discrepancies, with underestimation of boarding and overestimation of alight attributed to passenger behaviour and installation differences. Similarly, a study [6] reported an overall 77% accuracy rate for an infrared system installed on a bus, though the system struggled with crowded conditions and exhibited a systematic underestimation of passenger boarding. These percentages increase significantly when allowing for a tolerance of ±1 passenger: the weighted averages show a 95% accuracy rate for boarding passengers and 97% for alighting passengers, respectively.
Pressure-based systems offer a distinct approach by estimating passenger numbers based on weight variations. These systems are frequently used in buses, as evidenced in a research [24], which observed excellent accuracy in estimating the total number of onboard passengers (with a relative error ranging from 1% to 4%). However, these systems are limited in their ability to differentiate between boarding and alighting passengers, reducing their suitability for applications requiring a detailed flow analysis.
Video-based systems, which utilise camera installations and advanced image recognition algorithms, represent another significant APC technology. Their potential is highlighted in various studies (e.g., [20, 25]). For example, the research of [20] demonstrated that video-based systems achieved a 92% accuracy rate under laboratory conditions, but performance decreased in real-world settings due to challenges such as variable lighting and passenger occlusions. A study [25] further compared commercial video systems with lower-cost alternatives, finding that the latter outperformed the former in terms of accuracy during field trials (72% ÷ 74% vs. 53% ÷ 55% accuracy). Recent advancements in deep learning, as explored in a research [23], suggest that facial recognition algorithms could further improve APC accuracy, achieving a 99% success rate in ideal conditions. However, these advancements remain largely untested in complex and crowded environments such as metro stations.
Emerging technologies such as Wi-Fi and cellular tracking systems represent innovative, indirect methods of passenger counting. They estimate passenger numbers by monitoring signals emitted by personal devices. Different studies [18, 22] demonstrated the promise of these methods, reporting accuracies of up to 79% and reliable tracking of passenger flow. However, the reliance on personal device data introduces challenges, including overestimation (e.g., passengers carrying multiple devices) or underestimation (e.g., passengers with no devices). Another research [25] examined the application of Wi-Fi-based APC systems at bus stops and observed overestimation biases, emphasising the need for algorithmic calibration to improve reliability.
Despite the advancements summarised in Table 1, some gaps should be addressed.
Firstly, to the best of the authors' knowledge, the accuracy of APC systems has been explored in a fragmented manner. A comprehensive framework that integrates procedures for selecting control nodes (e.g., stations), collecting data, performing data pre-processing, calculating the error between manual and APC-collected data, analysing error patterns, computing error metrics, and evaluating overall accuracy is still lacking.
Secondly, most research has focused on APC applications in buses and trains, leaving a significant gap in the study of Open Mass Transit (OMT) systems (e.g., subways, light-rail-transit). They pose unique challenges, including higher passenger volumes than not-mass transit ones (e.g., buses), complex station layouts, and the absence of entry and exit controls.
Thirdly, most studies evaluate APC systems installed in vehicles, overlooking station-based applications that can be more difficult to analyse considering multiple access/exit points (e.g., stairs, lifts, escalators).
This study seeks to fill these gaps by proposing an integrated framework for evaluating the accuracy of APC systems in OMT. The framework’s practical effectiveness is illustrated through a real-world case study on the Brescia Metro (Italy), a fully automated, open, light metro system in Northern Italy. The case study examines video-based APC technology combined with passive infrared sensors to count passengers at three strategically selected stations. By comparing APC data with manual counts, this research quantifies accuracy and identifies error characteristics, contributing new insights to the field of APC systems applied for OMT.
The remaining paper is structured as follows: Section 2 defines the methodological framework proposed in the study. Section 3 provides a detailed description of the Brescia Metro system and the APC technology used, presents the key findings, and contextualises them within the broader literature. Section 4 summarises the study’s contributions, highlights implications, and proposes directions for future research.
2. METHODOLOGY
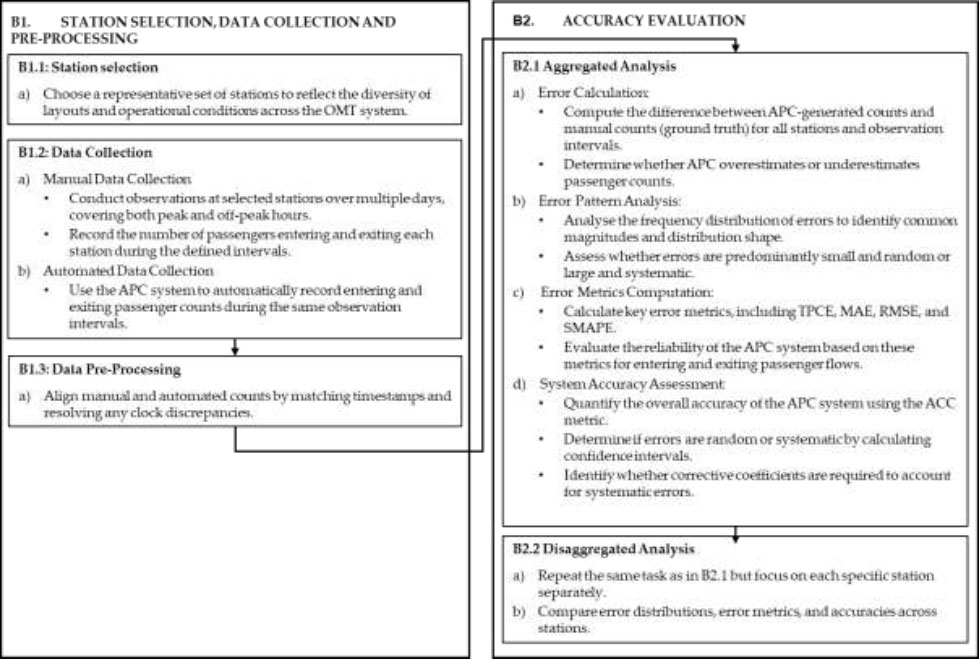
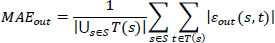
This section outlines the framework for evaluating the accuracy of APC systems in an OMT, as shown in the flowchart in Fig. (1). The framework is systematically organised into two primary blocks, each containing distinct sub-blocks that address specific aspects of data collection, processing, and analysis.
Block 1 involves selecting representative stations from the OMT network, collecting passenger count data through manual observations and automated systems, and pre-processing the data to ensure synchronisation. The selection process captures structural and operational diversity across the network, while data collection spans multiple times and days to reflect temporal variability. Pre-processing ensures alignment between manual and automated counts.
Block 2 focuses on analysing APC performance, both on aggregated and disaggregated levels. The aggregated analysis evaluates overall accuracy across stations and observation intervals using metrics such as Mean Absolute Error (MAE), Root Mean Squared Error (RMSE), and Root Mean Squared Error (RMSE) and Symmetric Mean Absolute Percentage Error (SMAPE), while confidence intervals help identify systematic and random errors. The disaggregated analysis examines station-specific performance, accounting for variations in structural and operational conditions, providing detailed insights, and highlighting localised challenges.
The content of each block is detailed in what follows. The list of variables throughout the manuscript is reported in the Appendix.
Flowchart of the proposed framework.
2.1. B1: Station Selection, Data Collection and Pre-processing
Block B1 consists of three sub-blocks. In Sub-Block 1.1, stations are selected based on their distinct configurations and passenger volumes to ensure a representative sample of the OMT network. In Sub-Block 1.2, passenger count data are collected manually and via automated systems at these stations, covering various times and days. Sub-Block 1.3 focuses on pre-processing the data by synchronising manual and automated counts and aligning timestamps to ensure data reliability.
Each Sub-Block operates as follows:
In Sub-Block 1.1, a set of stations that reflect the diversity of the entire OMT network is selected. From a theoretical perspective, data collection should encompass all stations within the OMT system. However, practical constraints such as high costs and significant time requirements may make this comprehensive approach tricky, particularly in large systems. Consequently, a selection process becomes necessary to address these challenges. This sub-block tackles this issue by carefully selecting stations that constitute a representative subset of the network.
Specifically, stations are chosen based on their distinct structural configurations and varying passenger volumes, ensuring they adequately characterise the main configurations across the OMT system. This selection process aims to capture the diversity of station layouts and operational conditions, forming a solid foundation for evaluating the APC system's performance across a broad spectrum of scenarios.
More formally, let S represent the set of stations selected for the study. The selection criteria ensure that S includes a representative mix of terminal stations, high-traffic hubs, and smaller, less crowded stops, thereby reflecting the system's overall variability. Moreover, by incorporating such diversity, the analysis can generalise its findings and generate insights applicable to the broader OMT network. Additionally, this approach helps identify specific challenges posed by different station characteristics, such as overlapping passenger flows, multiple access points, or structural complexities, enabling a more targeted evaluation of the APC system.
In Sub-Block 1.2, passenger count data are collected manually and through automated systems at the selected stations to evaluate APC accuracy. More formally, for each station s ϵ S, let T(s) be the set of observation intervals at station s, and t ϵ T(s) represents a generic observation interval.
As for manual data collection (task (a)), during each observation interval t ϵ T(s) for station s ϵ S, trained checkers manually record the number of passengers entering and exiting, denoted by Min(s, t) and Mout(s, t), respectively. The observations are conducted over multiple days, covering peak and off-peak hours to capture temporal variations in passenger behaviour.
Simultaneously, the APC system automatically records the number of passengers entering and exiting during each interval t ϵ T(s) for station s ϵ S, denoted by Ain(s, t) and Aout(s, t), respectively (task (b)).
In Sub-Block 1.3, manual pre-processing is conducted to synchronise manual and automated counts, ensuring temporal alignment between the two datasets. This process involves identifying the reference timestamps in both datasets and aligning them to account for any discrepancies. If the clocks used by the manual observers and the APC system differ, adjustments are made by applying a time-shift correction calculated based on observed offsets between the two sources. The synchronisation ensures that each manual observation interval corresponds precisely to the corresponding automated data, creating a consistent and reliable dataset for subsequent analysis.
2.2. B2: Accuracy Evaluation
Block B2 involves two sub-blocks dedicated to analysing APC performance. Sub-Block 2.1 (aggregated analysis) evaluates the accuracy of APC counts across all stations and observation intervals by calculating passenger count errors and employing metrics such as MAE, RMSE, and SMAPE. Confidence intervals are used to identify systematic and random errors, with corrective coefficients applied as needed. Sub-Block 2.2 (disaggregated analysis) shifts the focus to station-specific analysis, assessing APC performance at individual stations. This detailed approach accounts for variations in structural and operational conditions, enabling a comparative evaluation and identification of localised challenges.
Each Sub-Block operates as follows:
Focusing on the aggregated analysis (Sub-Block 2.1), it considers the overall dataset, encompassing all stations S and observation intervals, which is defined as UsϵST(s). This comprehensive evaluation provides an overall assessment of the APC system’s performance.
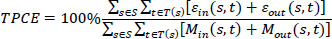
Firstly, the difference between APC-generated and manual counts is computed (task (a)). The latter are assumed to represent the ground truth1. More formally, let εin(s, t) and εout(s, t) be the passenger count error during each interval t ϵ T(s) for station s ϵ S, for entering and exiting, respectively. It is computed as follows [26-30]:
 |
(1) |
 |
(2) |
A positive difference returned by Eqs. (1 or 2) indicates that APC overestimates passengers; conversely. Vice versa, a negative difference indicates that APC underestimates passengers.
1No counting method guarantees 100% accuracy under all operational conditions, whether automatic or manual. However, in this study, manual counting is assumed to be error-free, even though this assumption might be debatable (e.g., [16]). To mitigate this issue, checkers were thoroughly trained, and one checker was assigned to each entry/exit points of the investigated station. At the end of each observation interval, the data were consolidated to provide the total number of entering and exiting passengers at each station. To summarise, manual counting was treated as the ground truth for this study.
Secondly, the relative frequency distribution of εin(s, t) and εout(s, t) is determined and analysed to qualitatively understand error patterns (task (b)). This analysis involves tabulating the frequency of errors across defined intervals to identify the most common error magnitudes and the overall distribution shape. By examining these patterns, it is possible to assess whether the errors are predominantly small and centred around zero, suggesting random noise, or whether they are larger and skewed with respect to zero, indicating systematic discrepancies. This distinction is essential for understanding whether the observed errors stem from inherent variability in passenger flows or biases in the APC system's measurement processes [31].
Thirdly, to evaluate error patterns quantitatively, several error metrics are employed (e.g [32, 33]) (task (c)). These are negatively oriented scores, i.e., the lower the error metrics, the better the counting performance. More formally, let:
• TPCE, TPCEin and TPCEout denote the Total Passenger Count Error for all movements, entering and exiting passengers, respectively.
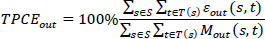
• MAEin and MAEout denote the Mean Absolute Error (MAE) on entering and exiting passenger counts, respectively.
• RMSEin and RMSEout denote the Root Mean Squared Error (RMSE) on entering and exiting passenger counts, respectively.
• SMAPEin and SMAPEout denote the Symmetric Mean Absolute Percentage Error (SMAPE) on entering and exiting passenger counts, respectively.
• µ(εin) and µ(εout) denote the mean of the count error, for entering and exiting passengers, respectively.
• σ(εin) and σ(εout) denote the standard deviation of the count error, for the passengers entering and exiting, respectively.
• z(α) denotes the value of a random variable following the standard normal distribution, related to the confidence level α (i.e., 1-α significance). In this study α=0.95. Therefore, z(α)=1.96.
• CIin and CIout denotes the confidence interval of the count error for entering and exiting passengers, respectively.
• βin and βout denotes the corrective coefficient for the entering and exiting passenger counts, respectively.
The TPCE measures the relative deviation between the total automated and manual counts over the entire dataset, considering all movements or entering and exiting passengers separately. It is defined as follows [28-30]
 |
(3) |
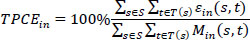 |
(4) |
 |
(5) |
The MAE quantifies the average magnitude of errors in the APC system’s counts without considering their direction. Since the MAE is a linear metric, it gives the same weight to each individual error in the sample. It is defined as follows for entering and exiting passengers separately [34-36]:
 |
(6) |
 |
(7) |
The RMSE is a non-linear metric emphasising larger errors by squaring the differences before averaging and then taking the square root. Therefore, the RMSE is remarkably effective when large errors are undesired. It is defined as follows for entering and exiting passengers, respectively [34-36]:
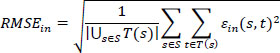 |
(8) |
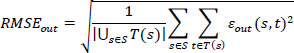 |
(9) |
The SMAPE evaluates the relative errors, providing a percentage measure. It is defined as follows for entering and exiting passengers, respectively (e.g [37, 38]):
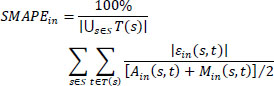 |
(10) |
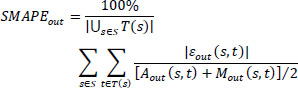 |
(11) |
Fourthly, the overall accuracy of the APC system is quantitatively assessed (task (d)). Accuracy can be defined in various ways depending on the context and the specific measurement objectives. In this study, it is computed as the complement to 100% of the SMAPE. More formally, let ACCin and ACCout denote the accuracy of passenger count for entering and exiting passengers, respectively. Hence, it is computed as follows [37]:
 |
(12) |
 |
(13) |
The accuracy is a positively oriented score, meaning that the higher the accuracy, the better the counting performance. This metric provides a straightforward and interpretable measure of the APC system's reliability for both entering and exiting passenger counts.
Hence, to quantitatively distinguish systematic errors from random errors, confidence intervals are computed for entering and exiting passengers, respectively, as follows [6, 39, 40]:
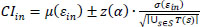 |
(14) |
 |
(15) |
Therefore, errors are classified as systematic if the confidence interval does not include zero, indicating consistent biases in the APC system's measurements and necessitating the application of a corrective coefficient. This corrective coefficient is defined as follows for entering and exiting passengers, respectively [28-30]:
 |
(16) |
 |
(17) |
Conversely, if the confidence interval included zero, errors are classified as random, indicating no significant systematic bias. In such cases, the APC system was considered relatively accurate, and corrective coefficients were deemed unnecessary. This classification helps identify the nature of the errors and guides whether adjustments to the APC system are required.
Next, focusing on the disaggregated analysis (Sub-Block 2.2), the performance of the APC system is analysed separately for each station s ϵ S to discover station-specific patterns by accounting for structural and operational variations. Station-specific error distributions, error metrics, accuracies, confidence intervals, and corrective coefficients are determined using the previous Eqs. from (1 to 17), restricting the calculations to the set T(s) of the specific station s ϵ S (task (a)). This approach enables a comparative analysis of APC system performance across different environments (task (b)). Observed patterns are associated with station characteristics, such as the presence of escalators and ramps, as well as the density of passenger movements.
3. RESULTS AND DISCUSSION
The Brescia Metro, an OMT system in Italy, serves as a case study to demonstrate the effectiveness of the proposed framework. A brief context overview is provided below, along with the implementation details for each block of the framework. The findings are parsed within the existing literature, highlighting consistencies and differences. The results are supported by tables to illustrate key metrics and trends.
3.1. Context
Brescia stands as one of Italy's foremost industrial and economic centres and ranks as the second-most populous city in its region [2, 41]. As of January 1, 2024, the city has a population of 198,259 residents, spans an area of 90.35 km2, and boasts a population density of approximately 2,194.34 inhabitants per square kilometre [42].
Additionally, Brescia serves as the capital of the province bearing the same name, home to over 1.2 million residents and a wide range of vital industrial, commercial, and social hubs. These factors collectively contribute to significant daily passenger traffic [43].
The Brescia Metro, an open light rail system, spans approximately 13.7 kilometres and includes 17 stations. The system is fully automated, offering a high-frequency service with headways ranging from four to six minutes [44].
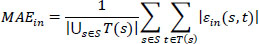
The APC system deployed in the Brescia Metro utilises passive infrared sensors integrated with video acquisition technologies (Fig. 2). These sensors detect temperature changes caused by passengers crossing entry and exit thresholds, while the video component enhances accuracy by resolving ambiguities in crowded or overlapping situations. Despite these technological advantages, environmental factors such as lighting variations, obstructions, and congestion may introduce errors, necessitating a robust evaluation methodology.
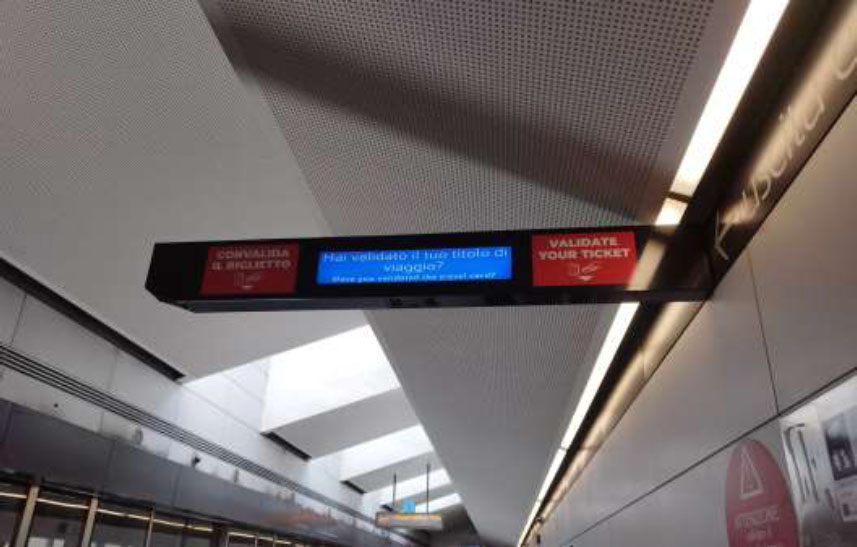
Photographic representation of the APC system deployed in the Brescia Metro.
3.2. B1: Station Selection, Data Collection and Pre-processing
Due to budget and time constraints, it was not feasible to collect data across all 17 stations of the Brescia Metro. Instead, a subset of stations (S) was selected (Sub-Block 1.1). Specifically, the study targeted three stations, referred to as A, B, and C, to comply with confidentiality policies. These stations were chosen based on their distinct configurations and varying passenger volumes, representing the main configurations found across the Brescia Metro system.
Station A features a shared access point serving both travel directions. The access includes two separate staircases and one escalator, all leading to a single platform. This station has three APC portals: one for each staircase and one for the escalator, providing comprehensive monitoring of both entering and exiting passenger flows.
Station B also has a shared access point for both travel directions but is equipped with a single APC portal. This portal monitors all entering flows but provides only partial coverage for exiting flows, as there are no portals on the escalators leading away from the platform.
Station C, in contrast, has independent access points for each travel direction, with separate APC portals for the stairs and elevators. This configuration enables complete monitoring of both entering and exiting flows.
Regarding operational characteristics, Stations A, B, and C represent high, medium, and low passenger volumes, respectively. This diversity ensures a comprehensive dataset and enables a robust evaluation of the APC system's performance across varying scenarios.
Passenger flows were recorded both manually by checkers (task (a)) and automatically by the APC system (task(b)) across a total of 674 observation intervals (T(s)), each lasting five minutes (Sub-Block 1.2). The choice of a five-minute interval was a balance between ensuring sufficient data granularity and avoiding excessive noise that could arise from using too short intervals. These observation intervals were collected between February and April 2024, globally providing over 55 hours of data.
Manual pre-processing showed good alignment between the manual and APC counts, which was ensured by accurately synchronising the checkers and APC clocks to the same reference time (Sub-Block 1.2). As a result, negligible time-shift corrections were required.
3.3. B2: Accuracy Evaluation
3.3.1. Aggregated Data Analysis
Focusing on the aggregated analysis (Sub-Block 2.1), the APC system demonstrated high reliability in grouped passenger counts, with a slight overestimation observed in both entering and exiting passengers. Table 2 summarises the descriptive statistics for manual and APC data.
| Variable | Symbol | Unit | Number of Observation Intervals | Mean | Std. Dev. | Min. | Max. | Sum |
|---|---|---|---|---|---|---|---|---|
| Manual entering count | Min(s, t) | pass | 360 | 10.59 | 11.70 | 0 | 56 | 3811 |
| Manual exiting count | Mout(s, t) | pass | 314 | 7.22 | 9.27 | 0 | 56 | 2266 |
| APC entering count | Ain(s, t) | pass | 360 | 10.64 | 11.32 | 0 | 63 | 3831 |
| APC exiting count | Aout(s, t) | pass | 314 | 7.32 | 8.86 | 0 | 55 | 2298 |
Overall, the APC system demonstrates a slight overestimation for both entering and exiting passenger flows, with the overestimation being more pronounced for exiting passengers. This pattern diverges from the findings of [6], where the APC system exhibited a consistent underestimation bias across both flows on buses. Conversely, the overestimation of exiting passengers observed in this study aligns with the results of [19], who tested an infrared APC system on trains. However [19], reported a systematic underestimation of entering passengers, marking a notable difference in error patterns between the two systems. This divergence underscores the importance of contextual factors, such as transit system characteristics, in influencing APC performance.
According to task (a), the count errors were computed (Eqs. (1 and 2)), and the relative frequency distributions for entering and exiting passengers were determined (task (b)), revealing key aspects of the APC system's performance (Table 3).
Both distributions are centred around zero, with 40% of entering errors and 43.31% of exiting errors aligning perfectly with manual counts. This strong central tendency indicates that the system frequently achieves accurate results, particularly for exiting flows.
Small errors, within the range of −1 to +1, dominate the distribution, accounting for 64.44% of entering errors and 73.89% of exiting errors. These findings highlight the system’s general reliability, as most discrepancies are minor. Exiting flows show a higher proportion of small errors, suggesting smoother detection at exits than entries.
| Error | Entering | Exiting |
|---|---|---|
| <-10 | 0.56% | 0.64% |
| -10 | 0.28% | 0.32% |
| -9 | 0.00% | 0.32% |
| -8 | 0.56% | 0.00% |
| -7 | 0.00% | 0.00% |
| -6 | 0.56% | 0.32% |
| -5 | 0.56% | 0.32% |
| -4 | 1.67% | 1.59% |
| -3 | 3.89% | 2.23% |
| -2 | 7.78% | 6.05% |
| -1 | 13.89% | 13.69% |
| 0 | 40.00% | 43.31% |
| 1 | 10.56% | 16.88% |
| 2 | 9.72% | 7.64% |
| 3 | 4.17% | 2.87% |
| 4 | 1.94% | 1.27% |
| 5 | 1.67% | 0.64% |
| 6 | 1.39% | 0.32% |
| 7 | 0.56% | 0.32% |
| 8 | 0.00% | 0.00% |
| 9 | 0.28% | 0.32% |
| 10 | 0.00% | 0.00% |
| >10 | 0.00% | 0.96% |
| Tot | 100.00% | 100.00% |
Larger errors, exceeding ±3, occur less frequently, comprising 10.00% of entering errors and 7.32% of exiting errors. Extreme errors greater than ±10 are rare, occurring in less than 1.3% of cases, underscoring the APC system's robustness.
The observed error patterns align with the aggregated analysis, which showed that both entering and exiting flows were slightly overestimated, with the bias being more pronounced for exiting passengers. This is reflected in the relative frequency distribution, where exiting errors are more concentrated around zero but also exhibit a slightly higher proportion of positive deviations (31,21% for exiting vs 30.28% for entering). Overall, the error distribution confirms that the APC system performs reliably, with most discrepancies being minor and random, while the occasional occurrence of larger entering errors highlights potential areas for improvement.
| Variable | Symbol | Unit | Value |
|---|---|---|---|
| Total passenger count error for all movements | TPCE | % | +0.86 |
| Total passenger count error for entering | TPCEin | % | +0.52 |
| Total passenger count error for exiting | TPCEout | % | +1.41 |
| Mean absolute error for entering | MAEin | pass | +1.41 |
| Mean absolute error for exiting | MAEout | pass | +1.32 |
| Root mean squared error for entering | RMSEin | pass | +2.33 |
| Root mean squared error for exiting | RMSEout | pass | +2.86 |
| Symmetric mean absolute percentage error for entering | SMAPEin | % | +13.29 |
| Symmetric mean absolute percentage error for exiting | SMAPEout | % | +18.14 |
| Accuracy on passenger count for entering | ACCin | % | +86.71 |
| Accuracy on passenger count for exiting | ACCout | % | +81.86 |
| Confidence interval of the error for entering | CIin | pass | [-0.186;0.297] |
| Confidence interval of the error for exiting | CIout | pass | [-0.186;0.297] |
| Corrective coefficient for entering | βin | - | NA |
| Corrective coefficient for exiting | βout | - | NA |
Next, error metrics, accuracies, confidence intervals, and corrective coefficients were computed according to tasks from (b) to (d) (Eqs. from (3 to 15)). The results are provided in Table 4.
Focusing on individual error metrics, the TPCE reveals that the Brescia Metro APC system achieves lower relative counting errors than other APC systems reported in the literature [19, 24]. This suggests that the system reliably captures passenger flows under real-world conditions.
The MAE indicates an average absolute error slightly above one passenger per observation interval for both entering and exiting flows. This result is consistent with the performance of alternative APC technologies, as reported by different studies [25, 27]. However, the RMSE for both entering and exiting passengers is significantly higher than that observed by in a previous research [6]. This discrepancy may be attributed to the higher passenger volumes recorded in the Brescia Metro, which diminish the relative impact of the error compared to systems operating in lower-density conditions.
The difference between RMSE and MAE is more pronounced for exiting than entering passengers (i.e., 1.55 vs 0.92, respectively), indicating that larger errors occur more frequently in exit observations. This trend is further reflected in the SMAPE, which is higher for leaving than incoming streams. As a result, the accuracy for entering passengers exceeds that for exiting passengers by approximately 5%. Nevertheless, the overall accuracy of the APC system remains above average compared to other on-field APC evaluations in the literature [6, 25, 45]. The system's performance is surpassed only by experiments conducted in controlled environments [20, 23].
The confidence interval analysis indicates that both intervals include zero, contrary to the findings of the study [6], where the confidence bounds for entering passengers were entirely below zero. In the Brescia Metro, the inclusion of zero classifies the errors as random, negating the necessity for corrective coefficients. Consequently, the Brescia Metro APC system can be considered relatively accurate and suitable for deployment without significant calibration adjustments.
3.3.2. Disaggregated Data Analysis
The disaggregated analysis (Sub-Block 2.2) investigates the performance of the APC system at each station individually, focusing on error frequency distributions, error metrics, accuracies, and confidence intervals. Table 5 summarises the manual and APC data with some descriptive statistics, Table 6 provides the relative frequency distributions of the counting error, while Table 7 presents the error metrics and other relevant parameters (task (a)).
| Variable | Symbol | Unit | Number of Observation Intervals | Mean | Std. Dev. | ||||||
|---|---|---|---|---|---|---|---|---|---|---|---|
| Station | A | B | C | A | B | C | A | B | C | ||
| Manual entering count | Min(s, t) | pass | 150 | 107 | 103 | 11.57 | 14.91 | 4.67 | 15.54 | 6.60 | 5.27 |
| Manual exiting count | Mout(s, t) | pass | 104 | 107 | 103 | 11.46 | 3.67 | 6.61 | 11.56 | 3.82 | 9.04 |
| APC entering count | Ain(s, t) | pass | 150 | 107 | 103 | 11.67 | 14.84 | 4.78 | 14.98 | 6.07 | 5.51 |
| APC exiting count | Aout(s, t) | pass | 104 | 107 | 103 | 11.87 | 3.72 | 6.47 | 11.01 | 3.65 | 8.32 |
| Variable | Symbol | Unit | Min. | Max. | Sum | ||||||
| Station | A | B | C | A | B | C | A | B | C | ||
| Manual entering count | Min(s, t) | pass | 0 | 4 | 0 | 56 | 51 | 19 | 1735 | 1595 | 481 |
| Manual exiting count | Mout(s, t) | pass | 0 | 0 | 0 | 56 | 18 | 41 | 1192 | 393 | 681 |
| APC entering count | Ain(s, t) | pass | 0 | 5 | 0 | 63 | 48 | 21 | 1751 | 1588 | 492 |
| APC exiting count | Aout(s, t) | pass | 0 | 0 | 0 | 55 | 17 | 42 | 1234 | 398 | 666 |
| Error | Entering | Exiting | ||||
|---|---|---|---|---|---|---|
| Station | A | B | C | A | B | C |
| <-10 | 1.33% | 0.00% | 0.00% | 1.92% | 0.00% | 0.00% |
| -10 | 0.67% | 0.00% | 0.00% | 0.96% | 0.00% | 0.00% |
| -9 | 0.00% | 0.00% | 0.00% | 0.00% | 0.00% | 0.97% |
| -8 | 1.33% | 0.00% | 0.00% | 0.00% | 0.00% | 0.00% |
| -7 | 0.00% | 0.00% | 0.00% | 0.00% | 0.00% | 0.00% |
| -6 | 1.33% | 0.00% | 0.00% | 0.00% | 0.93% | 0.00% |
| -5 | 0.67% | 0.93% | 0.00% | 0.96% | 0.00% | 0.00% |
| -4 | 2.67% | 1.87% | 0.00% | 3.85% | 0.00% | 0.97% |
| -3 | 5.33% | 5.61% | 0.00% | 0.96% | 1.87% | 3.88% |
| -2 | 5.33% | 12.15% | 6.80% | 10.58% | 1.87% | 5.83% |
| -1 | 8.67% | 14.95% | 20.39% | 11.54% | 17.76% | 11.65% |
| 0 | 34.67% | 37.38% | 50.49% | 23.08% | 52.34% | 54.37% |
| 1 | 10.00% | 10.28% | 11.65% | 19.23% | 16.82% | 14.56% |
| 2 | 14.00% | 8.41% | 4.85% | 10.58% | 7.48% | 4.85% |
| 3 | 5.33% | 3.74% | 2.91% | 5.77% | 0.00% | 2.91% |
| 4 | 2.67% | 1.87% | 0.97% | 3.85% | 0.00% | 0.00% |
| 5 | 2.67% | 0.93% | 0.97% | 1.92% | 0.00% | 0.00% |
| 6 | 1.33% | 1.87% | 0.97% | 0.00% | 0.93% | 0.00% |
| 7 | 1.33% | 0.00% | 0.00% | 0.96% | 0.00% | 0.00% |
| 8 | 0.00% | 0.00% | 0.00% | 0.00% | 0.00% | 0.00% |
| 9 | 0.67% | 0.00% | 0.00% | 0.96% | 0.00% | 0.00% |
| 10 | 0.00% | 0.00% | 0.00% | 0.00% | 0.00% | 0.00% |
| >10 | 0.00% | 0.00% | 0.00% | 2.88% | 0.00% | 0.00% |
| Tot | 100.00% | 100.00% | 100.00% | 100.00% | 100.00% | 100.00% |
| Variable | Symbol | Unit | Value | ||
|---|---|---|---|---|---|
| Station | A | B | B | ||
| Total passenger count error for all movements | TPCE | % | +1.98 | -0.10 | -0.34 |
| Total passenger count error for entering | TPCEin | % | +0.92 | -0.44 | +2.29 |
| Total passenger count error for exiting | TPCEout | % | +3.52 | +1.27 | -2.20 |
| Mean absolute error for entering | MAEin | pass | +1.92 | +1.30 | +0.79 |
| Mean absolute error for exiting | MAEout | pass | +2.46 | +0.70 | +0.81 |
| Root mean squared error for entering | RMSEin | pass | +3.04 | +1.91 | +1.34 |
| Root mean squared error for exiting | EMSEout | pass | +4.58 | +1.25 | +1.50 |
| Symmetric mean absolute percentage error for entering | SMAPEin | % | +16.52 | +8.73 | +16.65 |
| Symmetric mean absolute percentage error for exiting | SMAPEout | % | +21.10 | +18.96 | +12.32 |
| Accuracy on passenger count for entering | ACCin | % | +83.48 | +91.27 | +83.35 |
| Accuracy on passenger count for exiting | ACCout | % | +78.90 | +81.04 | +87.68 |
| Confidence interval of the error for entering | CIin | pass | [-0.380;0.594] | [-0.380;0.594] | [-0.152;0.366] |
| Confidence interval of the error for exiting | CIout | pass | [-0.476;1.284] | [-0.191;0.284] | [-0.435;0.144] |
| Corrective coefficient for entering | βin | - | NA | NA | NA |
| Corrective coefficient for exiting | βout | - | NA | NA | NA |
3.3.3. Station A
This station, the busiest one in the study, was monitored over 150 observation intervals for entering passengers and 104 intervals for exiting passengers. This asymmetry in observations arises from the presence of escalators that are exclusively used for entry, which affects the data collection process. The data were gathered on February 15, 2024, from 9:00 AM to 4:00 PM.
The relative error frequency distribution at this station reveals significant patterns. For entering passengers, 34.67% of errors fell at zero, indicating alignment with manual counts, while 53.33% were within the range of −1 to +1, suggesting high reliability for small discrepancies. However, errors exceeding ±3 accounted for 16.67%, highlighting the not neglectable presence of larger deviations. For exiting passengers, zero-error frequency was lower (23.08%), although 53.85% of errors fall within the −1 to +1 range. Larger errors, particularly those exceeding ±3, were more frequent for alighting flows (18.27%), reflecting greater challenges in counting accuracy.
This station exhibited the highest TPCE among the three, consistently overestimating both entering and exiting passenger flows. The discrepancies were particularly pronounced for exiting passengers, as evidenced by higher error metrics such as MAE and RMSE. These larger errors can be attributed to the station's structural complexity and high passenger volumes, where overlapping movements and rapid exits from trains create challenges for APC systems. Unlike entering, where the entry process to the platform is more gradual, exiting occurs quickly when trains arrive, exacerbating the counting difficulty.
Moreover, the pronounced difference between RMSE and MAE further indicates a higher frequency of larger errors for exiting passengers. This trend is reflected in the lower SMAPE and greater accuracy for entering compared to exiting flows. Despite these discrepancies, confidence intervals for both entering and exiting flows included zero, confirming that the errors were random and did not necessitate corrective coefficients.
These findings align with the broader literature, where high-density environments amplify APC system errors, particularly for exiting passengers [19]. However, the observed accuracy remains consistent with industry standards for on-field APC deployments.
3.3.4. Station B
This station, characterised by medium passenger volumes, was observed over 107 intervals for both entering and exiting passenger flows. The data were collected on February 16, 2024, and April 15, 2024, from 8:00 AM to 5:00 PM.
The relative error frequency distribution at B station shows greater alignment with manual counts. For entering passengers, 37.38% of errors were zero, and 62.62% fell within the −1 to +1 range, reflecting high accuracy for small deviations. Larger errors (exceeding ±3) were notably less frequent than A station, accounting for only 7.48%. Similarly, for exiting passengers, 52.34% of errors were zero, with 86.92% inside the −1 to +1 range and only 1.87% exceeding ±3.
Coherently, the APC system demonstrated robust performance at this station, with minimal errors compared to the aggregated data. The global TPCE showed a slight underestimation, with entering flows underestimated and exiting flows slightly overestimated. Error metrics such as MAE and RMSE were significantly lower than those observed at A station, corroborating smaller and less variable errors.
This reduced error magnitude reflects the simpler passenger flow dynamics and lower volumes at B station. This resulted in great accuracy, especially for entering passengers, which was the highest across the dataset. Both confidence intervals for entering and exiting flows included zero, confirming the random nature of the errors and negating the need for corrective coefficients.
3.3.5. Station C
Station C, with the lowest passenger volumes, was observed over 103 intervals for entering and exiting passenger flows. Data were collected on February 13, 2024, from 8:30 AM to 5:00 PM.
The error frequency distribution at station C underscores the reliability of the APC system in low-density environments. For entering passengers, 50.49% of errors were zero, with 82.52% within the −1 to +1 range. Larger errors (exceeding ±3) were the rarest among all stations, occurring in only 2.91% of observations. Similarly, for exiting passengers, 54.37% of errors were zero, with 80.58% within the −1 to +1 range and only 1.94% exceeding ±3, indicating a high concentration of minor discrepancies. Notably, this station exhibited the highest proportion of zero-error observations for both entering and exiting flows, underscoring its reliability.
At C station, the APC system exhibited robust performance, with a slightly negative TPCE, reflecting a slight underestimation of total passenger flows. While entering flows were slightly overestimated, exiting flows were underestimated. The MAE and RMSE values for entering flows were the lowest among the three stations, indicating smaller absolute errors compared to the A and B stations, respectively. The observed accuracy was relatively high for both entering and exiting flows, reflecting the system's effectiveness in low-density environments.
These results highlight the benefits of simpler passenger flow patterns and reduced passenger densities in minimising APC system errors. Confidence intervals for both entering and exiting flows included zero, classifying the errors as random and eliminating the need for corrective coefficients. The lack of systematic biases further supports the APC system’s reliability at this station.
3.3.6. Summary of Disaggregated Analysis
The disaggregated analysis of the APC system's performance across different stations revealed notable variations influenced by station-specific factors. Station A, with multiple access points, exhibited the highest errors, particularly for alighting flows. This was attributed to its complex layout and high passenger density, leading to overlapping passenger flows and simultaneous entering and exiting passengers. Conversely, Station C, characterised by low passenger volumes and independent access points for each travel direction, offered the simplest test case, resulting in reduced errors and higher reliability. Station B, with medium passenger volumes and average structural complexity, served as an intermediate case, demonstrating moderate accuracy levels. These findings underscore the significant impact of station design and passenger density on APC system performance. Stations with simpler layouts and lower passenger volumes tend to provide more accurate results, while those with higher complexities or overlapping passenger flows present additional challenges. Therefore, site-specific conditions such as station architecture, escalators or ramps, and passenger density substantially influence accuracy.
Nevertheless, the confidence interval analysis confirmed that the observed errors were random across all stations, supporting the overall robustness of the APC.
CONCLUSION
Automatic Passenger Counting (APC) systems are essential tools for estimating passenger volumes in public transportation. However, being automated systems, APCs can be affected by measurement errors that must be carefully evaluated and mitigated to ensure data reliability and accuracy. Understanding the nature and extent of these errors is critical for improving APC performance and adapting these systems to the specific challenges of diverse transit environments.
Previous research has extensively examined APC applications in buses and trains, but there remains a significant gap in the study of Open-mass Transit (OMT) systems because no real-world study was still available to the best of the authors’ knowledge. Nevertheless, these systems present substantial challenges, including complex station layouts, high passenger flows, and heterogeneous movement patterns, which necessitate tailored APC solutions capable of delivering reliable passenger flow data.
The main contributions of this paper include:
• Presenting a comprehensive framework integrating procedures for selecting stations, collecting data, performing pre-processing steps to synchronise the data, calculating the error between manual and APC-collected data, analysing error patterns, computing error metrics, and evaluating overall accuracy.
• Demonstrating the practical effectiveness of this framework through a real-world case study conducted in OMT, showcasing how user-friendly outputs can highlight potential areas for improving the efficient management of APC systems.
When accurate, APC-collected data provide valuable insights into passenger volumes at each station. The user-friendly representation of this data enables transit managers to identify where adjustments to APC systems are needed, enhancing operational efficiency and service quality.
The findings show that the APC system performs accurately when aggregating passenger counts, with slight overestimations, especially for exiting passengers. Confidence interval analysis revealed that the errors were random and not systematic, indicating no need for calibration adjustments. The station-specific analysis highlighted performance variability, with simpler stations yielding more accurate results, while more complex stations with higher passenger volumes faced additional challenges. These results suggest that factors like station design, escalators, ramps, and passenger density can significantly affect accuracy.
This study has several practical implications for both transportation authorities (TAs) / public transport companies (PTCs) and producers. Indeed, it can be used to:
• Enhance operational efficiency and support long-term planning: The findings on APC counting accuracy suggest that TAs and PTCs can optimise resource allocation based on real-time passenger flow data. Expanding APC systems across the network allows for improved service frequency and capacity planning, particularly in high-demand areas. Real-time data, transmitted via fast networks like 5G, facilitates immediate adjustments to service frequency, reducing overcrowding and enhancing passenger satisfaction. The insights also support planning for new transit routes or infrastructure expansion, helping to predict potential congestion and aligning development with actual demand.
• Tailor APC systems for station-specific performance improvement: The study found that simpler stations with lower passenger volumes showed higher APC accuracy. This suggests that producers should customise APC systems for different station types, ensuring reliable performance in stations with complex layouts or higher passenger density. Adjustments to the system can help maintain accuracy in varying operational conditions, ensuring its effectiveness across diverse transit environments.
While this study provides a meaningful contribution to the understanding of APC system performance in OMT, several open questions remain. The scope of the analysis was confined to three stations, selected to represent a range of configurations and passenger volumes. While these stations offer valuable insights, they may not capture the full diversity of operational conditions throughout the Brescia Metro network. Additionally, data collection was restricted to specific periods, potentially overlooking seasonal or temporal variations in passenger behaviour, such as changes in commuting patterns or special events (e.g [46, 47]). Environmental factors, including lighting variations and passenger crowding, may have also affected system performance, particularly in crowded or poorly illuminated areas.
These open questions suggest a roadmap for future research. First, improving the accuracy of APC systems should be a key focus, with advanced analytical methods like machine learning playing a vital role in modelling and predicting error patterns for better system calibration (e.g., [48]). This would help address passenger flow variations driven by temporal, seasonal, or event-driven factors, reducing inaccuracies and improving performance.
A second area for development is integrating emerging technologies for more comprehensive passenger flow monitoring in multi-modal transit networks. Combining APC data with Wi-Fi and cellular tracking could improve scalability and flexibility, enabling real-time tracking in diverse environments (e.g [18, 49]). This approach could enhance the capture of complex passenger movement patterns and optimise resource allocation.
Expanding future research to include more varied and complex case studies would help demonstrate the methods' breadth. Including stations with intricate layouts, such as interchanges between multiple lines, and extending analyses over longer periods to capture more passenger flow variability and environmental factors would help validate the APC system across diverse conditions and highlight its adaptability.
Finally, future research must address data security, privacy, and computational efficiency challenges. As APC systems depend on real-time data and network communication, they are vulnerable to risks, as seen in 5G-enabled systems (e.g [50-54]). Recent advances in authentication, privacy, and blockchain technologies could inform APC system designs, ensuring secure data processing in dynamic transit environments.
Ultimately, addressing these areas in future research will not only improve the accuracy and reliability of APC systems but also contribute to the broader goals of optimising public transportation and fostering sustainable urban mobility. By enabling more accurate data collection and analysis, these systems can support informed decision-making, better resource allocation, and enhanced passenger experiences and service quality [55]. All of these factors will drive the continued advancement of public transit systems worldwide.
AUTHORS’ CONTRIBUTIONS
The authors confirm their contribution to the paper as follows: B.B., L.R., R.V.: Manuscript draft. All authors reviewed the results and approved the final version of the manuscript.
LIST OF ABBREVIATIONS
| AI | = Artificial Intelligence |
| APC | = Automatic Passenger Counting |
| DL | = Deep Learning |
| ITS | = Intelligent Transportation Systems |
| MAE | = Mean Absolute Error |
| OMT | = Open Mass Transit |
| PTCs | = Public Transport Companies |
| RMSE | = Root Mean Squared Error |
| SMAPE | = Symmetric Mean Absolute Percentage Error |
| TAs | = Transportation Authorities |
| TPCE | = Total Passenger Count Error |
AVAILABILITY OF DATA AND MATERIALS
All data used in the study are proprietary or confidential in nature and may only be provided with restrictions.
CONFLICT OF INTEREST
Dr. Roberto Ventura is the Associate Editorial Board Member of the journal The Open Transportation Journal.
ACKNOWLEDGEMENTS
The authors sincerely thank Brescia Mobilità, the local public transport company, for their invaluable organisational support and for providing the APC data used in this study. It is essential to note that any viewpoints, findings, conclusions, or recommendations presented in this material are solely those of the authors and do not necessarily represent the perspectives of Brescia Mobilità. Any remaining errors or inaccuracies are the sole responsibility of the authors.
APPENDIX
| Symbol | Description | Units |
|---|---|---|
| S | Set of stations | (Station) |
| T(s) | Set of observation intervals at station s | (Interval) |
| Min(s, t) | Number of passengers entering for station s ∈ S during t ∈ T(s) collected by manual checkers | (Pass) |
| Mout(s, t) | Number of passengers exiting for station s ∈ S during t ∈ T(s) collected by manual checkers | (Pass) |
| Ain(s, t) | Number of passengers entering for station s ∈ S during t ∈ T(s) collected by APC | (Pass) |
| Aout(s, t) | Number of passengers exiting for station s ∈ S during t ∈ T(s) collected by APC | (Pass) |
 |
Overall dataset of analysis | (Interval) |
| εin(s, t) | Count error during each interval t ∈ T(s) for station s ∈ S for entering passengers | (Pass) |
| εout(s, t) | Count error during each interval t ∈ T(s) for station s ∈ S for exiting passengers | (Pass) |
| TPCE | Total passenger count error for all movements | (%) |
| TPCEin | Total passenger count error for entering passengers | (%) |
| TPCEout | Total passenger count error for exiting passengers | (%) |
| MAEin | Mean absolute error for entering passengers | (Pass) |
| MAEout | Mean absolute error for exiting passengers | (Pass) |
| RMSEin | Root mean squared error on count for entering passengers | (Pass) |
| RMSEout | Root mean squared error on count for exiting passengers | (Pass) |
| SMAPEin | Symmetric mean absolute percentage error on count for entering passengers | (%) |
| SMAPEout | Symmetric mean absolute percentage error on count for exiting passengers | (%) |
| ACCin | Accuracy on passenger count for entering passengers | (%) |
| ACCout | Accuracy on passenger count for exiting passengers | (%) |
| µ(εin) | Mean of the count error for entering passengers | (Pass) |
| µ(εout) | Mean of the count error for exiting passengers | (Pass) |
| σ(εin) | Standard deviation of the count error for entering passengers | (Pass) |
| σ(εout) | Standard deviation of the count error for exiting passengers | (Pass) |
| z(α) | Value of a random variable following the standard normal distribution, related to the confidence level α | (-) |
| CIin | Confidence interval of the count error for entering passengers | (-) |
| CIout | Confidence interval of the count error for exiting passengers | (-) |
| βin | Corrective coefficient for the count for entering passengers | (-) |
| βout | Corrective coefficient for the count for exiting passengers | (-) |

