All published articles of this journal are available on ScienceDirect.

Investigating the Impact of Public Transport Usage Behaviors on Air Pollution after COVID-19
Abstract
Introduction
The COVID-19 pandemic has significantly disrupted urban life, including long-lasting changes in public transportation usage patterns. This study investigates how behavioral shifts in public transport ridership after the pandemic have influenced urban air quality.
Materials and Methods
The research analyzed data from eight major European cities: Paris, Berlin, Athens, Rome, Lisbon, Madrid, Istanbul, and London. A Public Transport Usage Index (PTUI) was developed based on five key behavioral factors affecting public transport use post-COVID. The relationship between this index and air quality was statistically examined by calculating the correlation between PTUI and the post-pandemic Air Quality Index (AQI).
Results
A strong negative correlation (r = -0.9304) was identified between the PTUI and AQI, indicating that increased public transport use is associated with improved air quality. All cities showed this trend, except Berlin, where the pattern deviated. Notably, cities with higher PTUI scores experienced more significant reductions in pollution indicators such as PM2.5 and NO2.
Discussion
These results underscore the role of sustainable public transport usage in mitigating urban air pollution. The findings align with existing literature emphasizing modal shift as a key strategy in urban environmental improvement. However, the study is limited by potential variations in data reporting standards across cities and by short-term observational scope.
Conclusion
This study demonstrates that post-pandemic behavioral changes in public transport usage have had a measurable impact on urban air quality. The findings offer valuable insight for urban planners and policymakers seeking to design resilient, health-conscious transportation systems that support long-term environmental sustainability.
1. INTRODUCTION
Public transportation is one of the most preferred modes of travel in urban areas. Public transportation systems are designed based on factors such as the structure of cities, transportation network, transportation type, passenger profile and service level. The efficiency of the designed public transportation systems is directly related to the investments made in this transportation system. People's preference for public transportation in a city varies depending on the level of investment in the system. When convenient transportation facilities are provided, individuals are more likely to prefer public transportation over private cars. This shift can lead to improvements in several areas, including traffic congestion, air and noise pollution, and fuel and energy consumption [1-4].
There are many factors that affect people's preference for public transportation. One of the most important among these factors is transportation safety. Individuals seek to travel safely by public transport without facing traffic accidents or in-vehicle safety concerns. Certain types of public transportation offer enhanced safety compared to private vehicles, making public transit a more attractive option [5-9].
Another important factor that encourages individuals to use public transportation is economic transportation opportunities. Public transportation vehicles offer much more economical transportation than transportation by individual vehicles. In many countries, in order to encourage public transportation, policymakers organize various campaigns to make public transportation more affordable [10-12].
In addition to these factors, the fact that transportation can be provided quickly and practically increases the likelihood of public transportation systems being preferred. Especially in big cities, traffic congestion is quite high due to the density of individual automobiles. This traffic congestion causes delays in reaching where people want to go. However, in some public transportation systems, the provision of fast and punctual transportation opportunities, thanks to the road sections specially allocated to these vehicles, enables people to turn to public transportation [13, 14].
Another important factor affecting the preference for public transportation is epidemics. Although this situation occurs very rarely, it can significantly affect public transportation. For example, the COVID-19 pandemic, which emerged towards the end of 2019, affected the whole world, and many restrictions occurred in 2020 and 2021. These restrictions are especially concentrated in social and indoor areas. Many changes were also made in the use of public transportation within a short period. In order to maintain social distancing in public vehicles, some passenger seats have been left empty, or vehicles have taken very few passengers. As a result of these restrictions, the tendency towards individual modes of transportation increased. However, even though the restrictions were later lifted completely, changes in the preference for public transportation have become permanent for a significant portion of people [15-19].
There are several studies in the literature that examine the impact of the COVID-19 pandemic on public transportation systems. In one of these studies, Sahraei et al. [20] examined 12 different cities to reveal how curfew affected public transportation during COVID-19. They calculated how much the air quality indices changed before and after the curfew in these cities. As a result of the study, it was found that the percentages of air pollutants in these cities decreased significantly.
Tirachini and Cats [21] talked about the economic and social impacts of the COVID-19 pandemic on public transportation systems. They revealed that restrictions on public transportation systems, especially during curfew periods, negatively affected this transportation sector. As a result of the study, they stated that some recommendations to improve public health in public transportation systems offer an important perspective for policymakers.
Dong et al. [22] mentioned that public transportation users' perspectives on this mode of transportation changed during the pandemic process. It was revealed that the measures taken during the pandemic prevented the rapid spread of infectious diseases, and this situation was welcomed by public transportation users. The research also revealed that implementing safety measures for passengers is essential to prevent a decline in public transportation ridership.
In another study in this field, Vickerman [23] stated that the COVID-19 pandemic has severely affected public transportation systems, highlighting the need for financial support for service providers. He also stated that the future of public transportation systems is seriously threatened, especially as people continue to work from home. For this purpose, he argued that in order to increase the efficiency of public transportation systems, the current system should be reviewed, and some arrangements should be made.
In order to examine the impact of COVID-19 on future public transportation use, Downey et al. [24] conducted a survey of 994 people. A significant portion of the survey participants stated that they would prefer to use public transportation systems less after the pandemic. The study revealed that factors such as the risk of COVID-19 infection, household size, travel preferences, and region significantly influence public transportation choices.
When examining existing studies in the literature, it is evident that the COVID-19 pandemic has significantly influenced individuals' transportation preferences. Restrictions on public transportation during the pandemic led many to adopt alternative modes of travel, and over time, these changes became permanent for a considerable portion of the population. Conversely, in certain cities, the enhanced appeal of public transportation systems post-pandemic caused some individuals to shift from personal motor vehicles to public transport. These shifts in transportation behavior likely impacted urban air quality, yet their specific effects remain underexplored. This study aims to fill this gap by investigating how changes in public transportation usage after COVID-19 have influenced air quality in cities. Unlike existing research, this work uniquely focuses on the environmental implications of post-pandemic public transport usage trends. The findings provide valuable insights into the intersection of urban mobility and environmental sustainability, advancing our understanding of the pandemic's long-term effects on urban ecosystems.
2. MATERIALS AND METHODS
2.1. Case Study
The cities with the highest population density in eight different European countries were chosen as the study area. These cities are London in the United Kingdom, Paris in France, Berlin in Germany, Athens in Greece, Rome in Italy, Lisbon in Portugal, Madrid in Spain and Istanbul in Turkey. Among the common characteristics of these cities is the availability of air quality index data for the PM2.5 pollutant type, both before and after COVID-19. Another common feature in these cities is the availability of data on the extent to which the COVID-19 pandemic has affected the frequency of public transportation use. Table 1 shows the information about the cities preferred as the study area.
| No. | Country | City | Population (Million) | Latitude/longitude |
|---|---|---|---|---|
| 1 | France | Paris | 12.174 | 48.51° N / 2.20° E |
| 2 | Germany | Berlin | 3.577 | 52.31° N / 13.24° E |
| 3 | Greece | Athens | 3.154 | 37.58° N / 23.42° E |
| 4 | Italy | Roma | 4.316 | 41.53° N / 12.30° E |
| 5 | Portugal | Lizbon | 3.001 | 38.43° N / 9.70° E |
| 6 | Spain | Madrid | 6.783 | 40.24° N / 3.42° E |
| 7 | Türkiye | Istanbul | 15.848 | 41.01° N / 28.94° E |
| 8 | United Kingdom | London | 9.748 | 51.30° N / 0.07° E |
Paris, one of the cities in the study area, is the capital and most populous city of France. The city is one of Europe's centers of finance, fashion, art, science, trade and diplomacy. Paris has a mild climate and moderate rainfall due to its location. Urban transportation is provided by rail and road. The underground metro and tram network for rail transportation is quite developed. Buses are used for road transportation. The city center is divided into various districts, and an infrastructure system has been created to provide access to all districts by public transportation systems.
Berlin is the capital and largest city of Germany. In 1990, the city, which developed as a result of the unification after the fall of the Berlin Wall, has become a center of science and culture over time. The average annual temperature in the city is about 9 degrees. The annual rainfall is not too much and is homogeneously distributed over the months. Although the rivers in the city center have limited the transportation network, the tram line is quite extensive. In addition to the tram, metro and bus transportation are frequently used in urban public transportation systems.
Athens, the capital of Greece, is one of the largest cities in the region. It is considered one of the centers of Western civilization. Since the city is located on the seacoast, maritime, industrial and economic activities are highly developed. The city has a semi-arid and mild climate. The temperature does not fall below 0 degrees Celsius during the year. Trams, electric trains and buses are used for public transportation in the city. Thanks to the port of Piraeus, the transportation network between the port and inland areas has developed.
Rome, the capital of Italy, is the most populous city in the country. The city has been the center of many civilizations since ancient times. For this reason, it has developed especially in the fields of history and tourism. The city has a Mediterranean climate, and the average annual temperature is around 21 degrees. It receives the most precipitation in the fall season. Metro and buses are used as public transportation in the city. However, since the metro network is quite limited, bus use is more common.
Lisbon is the capital and largest city of Portugal. Lisbon is one of the hottest cities in Europe and has a Mediterranean climate. Although snowfall is very rare, it rains more in November and December. Economy, industrialization and cultural activities are highly developed in the city. The city has a well-developed public transportation network with bus, tram and metro networks. In addition, nostalgic trams and funicular transportation are also available in some areas.
Madrid, the capital and the most populous city of Spain, is also one of the most populous cities in the European Union. It stands out especially in politics, education, fashion, culture and art. The average temperature in the city is 15 degrees, and the annual rainfall is low. The city's transportation network is highly developed, and it is one of the cities with the longest metro systems in Europe.
Istanbul is the most populous city in Europe and one of the most populous cities in the world. Its geopolitical position comes to the fore as it acts as a bridge connecting the continents of Europe and Asia. A mixture of Mediterranean and Black Sea climates is observed in the city. The average annual temperature is 14 degrees, and it receives the most precipitation in the winter months. The city has a well-developed rail, road and maritime transportation network.
London, the capital of the United Kingdom and England, is also the most populous city in the country. In addition to being one of the world's largest financial centers, it also stands out in terms of history and tourism. In addition, the port of London makes it an important trade center. The average annual temperature in the city is 11 degrees, and it receives average precipitation throughout the year. The city's transportation infrastructure is very developed, and the world's oldest subway is in this city. The map of the study area is shown in Fig. (1).
2.2. Method
The amount of particulate matter (PM2.5) in the air was taken into account in order to determine the impact of public transport usage behaviors on air pollution after COVID-19 in the study area cities. Since PM2.5 is suspended in the air, it can cause serious health problems in people who breathe it. According to the report prepared by the World Health Organization, more than 7 million people die annually in the world due to air pollution [26]. The flow diagram of the study process is shown in Fig. (2).
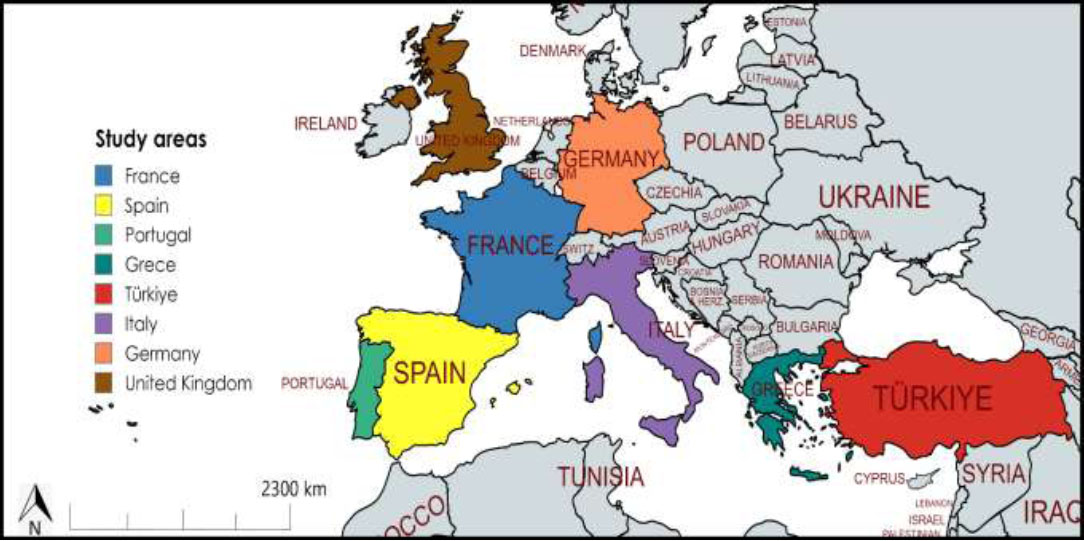
Study areas [25].
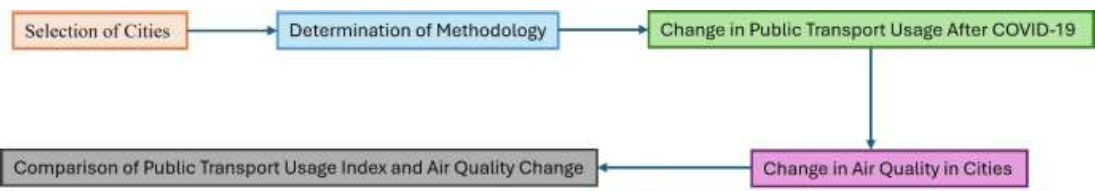
The flow diagram of the study.
Air pollution measurements for each city are obtained from world air pollution platforms [27]. Air pollution levels bring about various health problems. Fig. (3) shows the air pollution levels for PM2.5, the health problems that may occur and the measures that can be taken.
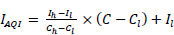
Various equations are used to calculate the air quality index value in a region. Eqs. (1 and 2), in which these calculations are used, are given below.
 |
(1) |
 |
(2) |
Where IAQI = the Individual Air Quality Index, n=the pollution project (PM2.5), Ih and Il = AQI limits, Ch and Cl = the pollutant concentration limits, C = the input value, the pollutant concentration. Table 2 shows the concentration limits for PM2.5 air pollutants.
| AQI Value of the Index | PM2.5 Concentration (μg/m3) | Air Pollution Level |
|---|---|---|
| 0–50 | 0–12 | Level 1 |
| 51–100 | 12.1–35.4 | Level 2 |
| 101–150 | 35.5–55.4 | Level 3 |
| 151–200 | 55.5–150.4 | Level 4 |
| 201–300 | 150.5–250.4 | Level 5 |
| 301 and Higher | 250.5–Higher | Level 6 |
3. RESULTS
3.1. Public Transportation Usage
Public transportation policies in cities affect the entire transportation structure of the city. As the importance given to public transportation systems in a city and the quality of
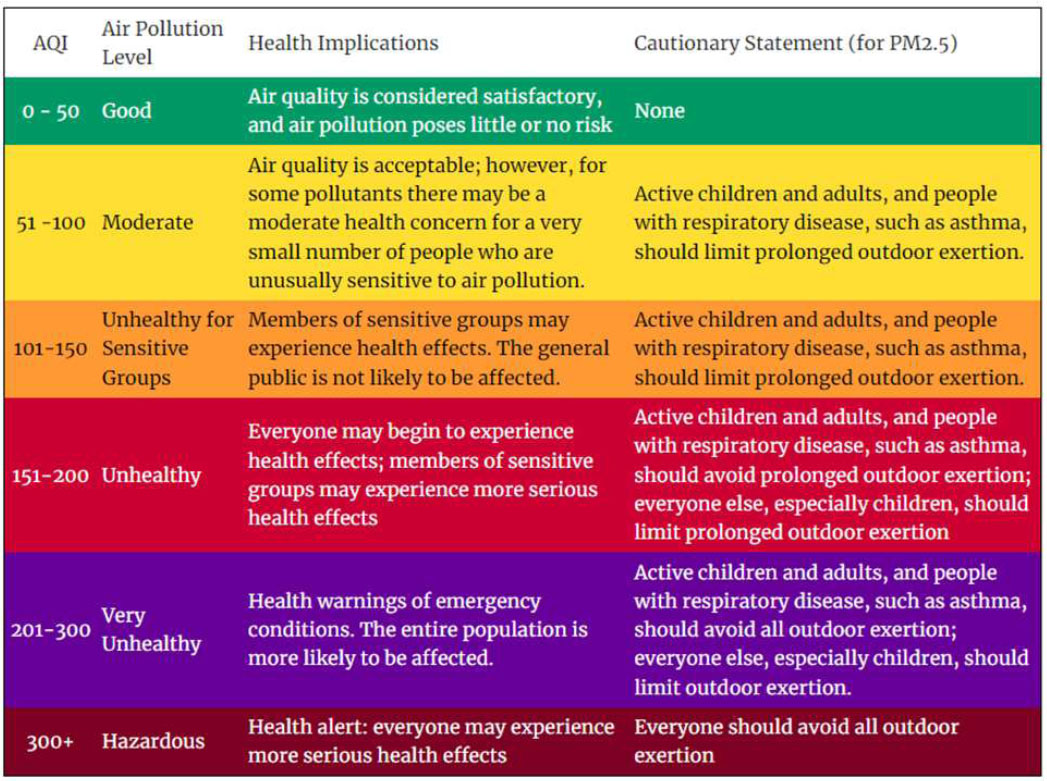
Warning and health impact statement for air quality index (aqi) related to particulate matter (PM2.5) [28].
service provided to users increase, the preferability for this mode of transportation increases. Therefore, people may prefer public transportation more instead of using individual vehicles. At this stage of the study, the public transportation structure of the cities in the study area was examined.
In Paris, public transportation systems are designed according to the concept of cheap and efficient service. Tickets provided for urban transportation are valid for every type of transportation. Metro and tram systems have been actively used in public transportation for many years. The Paris metro system is known as the second busiest metro system in Europe. Although urban bus systems are a little more complicated than metro lines, stop, direction and location information can be easily learned via a mobile application. For this reason, public transportation buses are also widely used in the city [30].
Berlin's public transportation system is among the most advanced in the world. Its well-connected network allows access to nearly every part of the city. There are three different bus systems in the city. These are double-decker buses that run very frequently, regular buses and night buses. The Berlin tram, one of the oldest trams in the world, operates 24 hours a day. Although the metro is more limited than the tram, it has both underground and overground lines [31, 32].
The metro, also known as the electric train in Athens, consists of three main lines. Metro lines connect the city center to the outskirts, the port and the airport. The tram serves mainly the coastal areas and the harbor area. In addition to regular buses, trolleybuses, which are electrically powered buses, also operate in the city. Buses generally run parallel to the metro lines. Since there is an integrated ticketing system with all public transportation systems in the city, the use of public transportation is widespread [33, 34].
Most of the public transportation in Rome is provided by buses. Access to every point of the city is possible with many bus lines. There are also bus lines specially designed for tourists. Due to the historical structure of the city, metro lines are very limited. If tunnel excavations are carried out for the subways, it is aimed not to damage these historical structures, as there is a possibility of encountering archaeological remains [35, 36].
Metro, tram and bus systems are frequently used in public transportation in Lisbon. In addition to these, there is also a ferry transportation system. There are 4 different lines with a length of approximately 50 kilometers in metro transportation. Trams are generally used for touristic purposes. Small and old-type trams with wagons attract a lot of attention. Some of these trams operate outside of rush hours. Buses are the most widely used type of public transportation, and there are bus lines operating in two different systems, day and night [37, 38].
The most effective public transportation system used in urban transportation in Madrid is the metro. The city has a metro network of approximately 300 kilometers on 12 lines. Buses are also highly preferred in public transportation. Bus service is provided at a level that can be found every 15 minutes in general at the stops. In addition to these, the 4-line light rail system has been in use since the 19th century. Train transportation is also provided with 9 different lines within the city [39, 40].
Istanbul has a versatile public transportation system, depending on the population density. Public transportation services are provided by metro, tram, metrobus, bus, funicular, ferry and sea buses. Road and rail transportation services are provided by the Bosphorus bridges connecting the two sides of the city, while ferries are also available over the sea. The metro network of approximately 200 kilometers also provides an important public transportation service in the city [41, 42].
Among the public transportation systems in the city of London, the metro, which has been serving since 1890, is very popular. It is used by approximately 1.5 billion passengers annually. Bus transportation in the city’s public transit system is served by approximately 10,000 vehicles. The city also has a modern tram network called Tramlink. In addition to these, the London cable car is another type of public transportation that is generally used for touristic purposes [43, 44].
| Variable Number | How has COVID-19 Affected the Frequency of your Public Transportation Usage? |
|---|---|
| 1 | I no longer use public transportation. |
| 2 | I use public transportation less frequently than before |
| 3 | It did not affect the frequency with which I use public transportation. |
| 4 | I use public transportation more. |
| 5 | I have switched to other modes of transportation. |
When the cities in the study area are evaluated together, all of them are among the largest cities within the borders of the country they are located in. For this reason, the transportation infrastructures of the cities are quite developed. In some cities, in addition to road transportation, rail and maritime transportation are also preferred in public transportation. However, significant changes have been observed in people's preference for public transportation after COVID-19. There were five different situations for the change in the frequency of public transportation use among individuals. These changes are shown in Table 3.
3.2. Air Quality Index
Air quality index is a value obtained by the ratios of various chemical substances in the air instantaneously measured by air measuring devices. This value changes constantly. For this reason, it is typically reported on a daily, monthly, or annual basis to provide general information about the air quality in a given region. During measurements, very high values may occasionally be observed. However, a consistently high air quality index over the long term poses serious risks to human health.
Measurements for PM2.5, which is one of the most frequently used criteria among air pollutants and provides clearer ideas, were utilized. Fig. (4a) London and Madrid. Fig. (4b) shows annual PM2.5 measurements. Fig. (5) shows the air quality indices of the cities in the study area before and after the COVID-19 pandemic.
3.3. Relation between Public Transportation Usage and Air Quality Index
It was aimed to evaluate these two situations together to examine the impact of changes in public transport usage behavior on air quality after the COVID-19 outbreak in cities. To determine the Public Transportation Usage Index (PTUI), a formulation was developed using five variables and the corresponding coefficients identified through regression analysis. The formulation of the public transportation usage index (PTUI) is shown in Eq. (3).
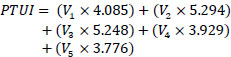 |
(3) |
The correlation coefficient was calculated for each city to reveal the relationship between the public transportation utilization index and the air quality index. The relationship between these two variables is shown in Table 4.
The data in the table shows the relationship between public transport user behavior and air quality change after COVID-19 for 8 different cities. In Berlin, the AQI value increased after COVID-19 (from 9.7 to 12.6), and thus air pollution increased. In contrast, cities such as Rome, Istanbul, Paris, Lisbon, Lisbon, Madrid, London and Athens have seen a decrease in AQI values, meaning that air quality has improved in these cities.
4. DISCUSSION
When Public Transport Utilization Index (PTUI) values are analyzed, there are small differences between cities. The highest PTUI value was recorded in Istanbul and Athens (505.4), while the lowest was recorded in Lisbon (494.5). The correlation coefficient (0.9304), calculated using data from all cities, indicates a strong positive correlation between changes in public transport usage behavior and air quality.

Annual air quality measurement values in London (a) and Madrid (b) before and after COVID-19 [28].
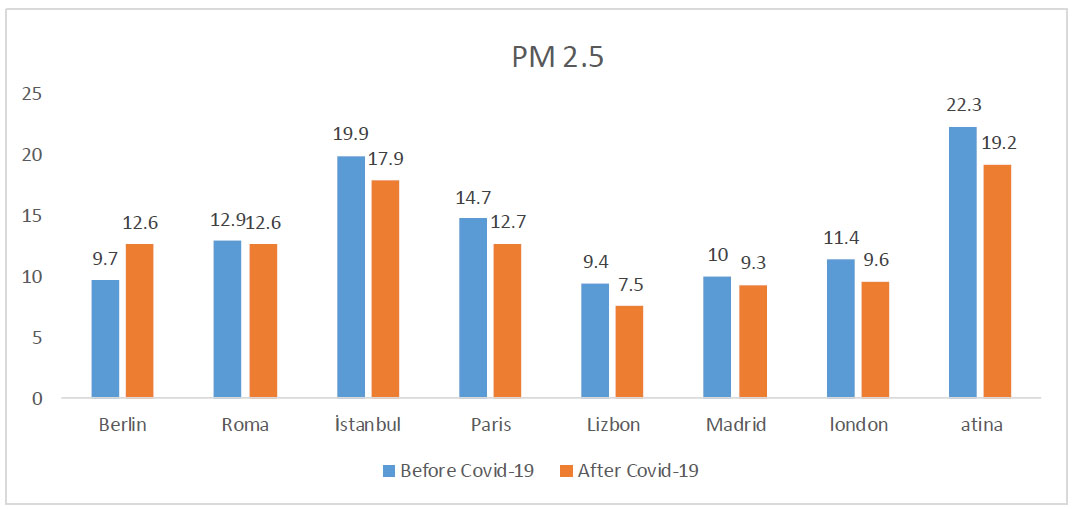
Air quality indices of cities in the study area before and after the COVID-19 pandemic.
| Cities | AQI | Variables | PTUI | Corr. Coef. |
|||||
|---|---|---|---|---|---|---|---|---|---|
| Before COVID-19 | After COVID-19 | V1 | V2 | V3 | V4 | V5 | |||
| Berlin | 9.7 | 12.6 | 6.1 | 23.5 | 55.3 | 12.5 | 2.7 | 498.9 | 0.9304 |
| Roma | 12.9 | 12.6 | 3.1 | 16.6 | 66 | 8.7 | 5.7 | 502.6 | |
| Istanbul | 19.9 | 17.9 | 1.8 | 15.3 | 69.9 | 9.6 | 3.3 | 505.4 | |
| Paris | 14.7 | 12.7 | 5 | 21.4 | 60.2 | 10.7 | 2.6 | 501.5 | |
| Lizbon | 9.4 | 7.5 | 1.3 | 13 | 64.2 | 14.7 | 6.8 | 494.5 | |
| Madrid | 10 | 9.3 | 1.5 | 12.2 | 66.8 | 16.8 | 2.7 | 497.5 | |
| London | 11.4 | 9.6 | 3.9 | 27.2 | 52.4 | 14.2 | 2.3 | 499.4 | |
| Atina | 22.3 | 19.2 | 3.1 | 24.9 | 59.5 | 9.2 | 3.3 | 505.4 | |
When the effect of the variables is analyzed, it can be observed that cities where the variables “I no longer use public transport” (V1) and “I use public transport less than before” (V2) are low (e.g., Lisbon and Madrid) show a more significant improvement in AQI values. The variable “I use public transportation more” (V4) has the highest value in Madrid (16.8).
Overall, it can be said that changes in public transportation use can have complex effects on air quality. The high positive correlation coefficient indicates that, as a general trend, in cities where the use of public transportation decreases, the tendency towards motorized vehicles increases, thus increasing air pollution. However, when evaluated on a city-specific basis, some cities that have increased the use of public transportation (e.g., Madrid) have seen a decrease in AQI values. In addition, cities with a high shift to other modes of transportation (V5) (e.g., Lisbon) have seen an improvement in AQI values. In this case, it can be said that there is a shift towards micromobility transportation instead of public transportation. Considering all the results obtained throughout the study, it is determined that changes in public transport usage behavior have a significant impact on air pollution in cities. In cities where the use of public transportation tends to decrease, it is very important to encourage micro mobility vehicles and pedestrian transportation, which are more environmentally friendly means of transportation, instead of motor vehicles.
The transition to electric and hybrid vehicles is crucial to reducing air pollution from public transportation. The use of alternative fuels, especially CNG and hydrogen fuel cells, can significantly reduce emissions. Intelligent transportation systems can minimize unnecessary stop-start movements by optimizing routes and stops. Exhaust filtration technologies can be made mandatory to reduce the environmental damage caused by diesel vehicles. In addition, the need for motorized transport can be reduced by promoting bicycle and pedestrian-friendly transportation policies. These measures can both improve air quality and support sustainable transportation solutions.
CONCLUSION
In this study, the effects of behavioral changes of public transport users on air quality after the COVID-19 pandemic were investigated. One of the notable lifestyle changes observed globally following the pandemic is a shift in public transportation usage. The study analyzed data from eight major European cities (Berlin, Rome, Istanbul, Paris, Lisbon, Madrid, London and Athens). A Public Transport Usage Index (PTUI) was calculated based on five different behavioral changes identified for public transport users, and the correlation coefficient between this index and the post-COVID-19 Air Quality Index (AQI) was 0.9304. Overall, the findings show that changes in public transport use have a significant impact on air quality. In all cities except Berlin, changes in public transport use were found to improve air quality.
The study shows that policies that encourage the use of public transport generally have the potential to improve air quality. However, these policies need to be planned in detail, taking into account the specific conditions of cities and the characteristics of public transport systems. Urban planners and policymakers should consider the findings of this study when developing sustainable transportation policies. Such policies are important for improving air quality and promoting the effective use of public transportation. The findings of this study can serve as an important reference for future studies on how cities develop sustainable transportation policies. Effective implementation of such policies is critical for both improving air quality and increasing the use of public transportation.
AUTHORS’ CONTRIBUTIONS
The authors confirm contribution to the paper as follows: E.K.: Writing - original draft preparation; T.S.: Writing - reviewing and editing. All authors have read and agreed to the published version of the manuscript.
LIST OF ABBREVIATIONS
| AQI | = Air Quality Index |
| PM | = Particulate Matter |
| PTUI | = Public Transportation Usage Index |
AVAILABILITY OF DATA AND MATERIALS
The data supporting the findings of the article is available in the [World's Air Pollution: Real-time Air Quality Index] at [https://waqi.info/], reference number [28].
ACKNOWLEDGEMENTS
Declared none.

