All published articles of this journal are available on ScienceDirect.

A Dynamic Sustainable Optimization Model for A Transportation System of Bottled Water
Authors Info & Affiliations
Abstract
Introduction/Objective
The need for sustainable logistics in the bottled water distribution sector is growing rapidly. This study addresses this issue by developing a multi-objective optimization model that creates a balance between travel distance and carbon dioxide emissions. The aim is to create and design efficient delivery routes while utilizing intelligent vehicle allocation to reduce environmental impact.
Methods
A mixed-integer linear programming model is proposed, integrated with K-means clustering and real-time traffic data imported from Google Maps API. Two different case studies were examined: one employed a heterogeneous fleet consisting of large, medium, and small-sized vehicles, and the other one employed a homogeneous fleet consisting of small vehicles with various emission rates. The two cases were analyzed according to three weighing scenarios: equal priority (50%–50%), distance-prioritized (80%–20%), and emissions-prioritized (20%–80%).
Results
In the first case, the model selected the same fleet composition in all scenarios. The total objective function values were 467.30, 546.15, and 388.42. In the second case, the model assigned the heaviest loads and longest routes to lower-emission vehicles, resulting in objective values of 65.34, 99.49, and 31.20, with stable route assignments and optimized load utilization.
Discussion
The model showed strong adaptability across fleet structures and operational priorities. It was able to reduce emissions without compromising operational efficiency, which shows its practical value for logistics planning. The utilization of real-time traffic and emission-based routing enhances its environmental applicability further.
Conclusion
The proposed approach supports sustainable route planning and fleet utilization. According to the various scenarios and vehicle configurations used to test the robustness of the model, it can be used on a broader scale in logistic systems with environmental constraints.
1. INTRODUCTION
In regions with harsh climates and scarce freshwater resources, it can be challenging to maintain a dependable transportation system for drinking water [1]. Bottled water has become an effective solution to meet daily needs, but the industry now faces great pressure to operate in a manner that reduces its environmental footprint. One company in this sector is actively working to improve its transportation operations by lowering costs, increasing distribution efficiency, and cutting down on carbon emissions resulting from delivery activities. A proven method of achieving these goals is through green logistics strategies—particularly route optimization, which helps minimize emissions while maintaining service quality [2, 3].
Transportation logistics account for a large share of the environmental impact on the bottled water industry. Products are required to be transported across wide geographic areas, which leads to the generation of significant amounts of emissions [4]. When logistics systems are insufficient, they increase operational costs, contribute to unnecessary fuel use, and increase greenhouse gas emissions. Since consumers are showing stronger preference for sustainable practices in addition to tighter environmental regulations, businesses are pressured to re-evaluate their supply chains. For companies in this sector, making transportation more sustainable is not just a regulatory requirement, but it is also a strategic move to remain competitive.
Reducing transportation-related carbon emissions is a highly important topic that is widely recognized in supply chain research. However, there is a lack of integrated models that deal with dynamic traffic conditions, demand clustering using artificial intelligence, and vehicle routing optimization in practical settings. Such models are needed in the bottled water sector, where distribution plays a central role in both cost and emissions. In this paper, a dynamic and data-driven optimization model is developed, in which real-time traffic data, customer demand clustering using the K-means algorithm, and a multi-objective vehicle routing framework are integrated to minimize both travel distance and carbon emissions.
2. LITERATURE REVIEW
One of the most critical problems in modern transportation systems is the control of carbon emissions generated by delivery operations. Green logistics has emerged as a main focus area in both academia and industry, seeking to balance cost efficiency with environmental sustainability. For example, Aldoukhi and Guptal [5-8] developed several closed-loop supply chain models that employed carbon emissions as a main decision criterion, particularly within transportation activities in industry. Abbasi and Choukolaei [9] presented a comprehensive review of green supply chain network designs, emphasizing the role of carbon policy in optimizing the structure of networks.
Other scholars have focused on other strategies of emission-reduction. Bouman et al. [10] reviewed state-of-the-art techniques and policy measures aimed at reducing CO2 emissions in both logistics and shipping sectors. With regard to intelligent transportation systems, Zhao et al. [11] found a high correlation between the utilization of smart transportation infrastructure and lower levels of emissions in China. Shen et al. [12] studied the correlation between international trade and transportation emissions. The study highlighted the need for localized strategies to control emissions. Ağbulut [13] used machine learning to forecast transportation-related emissions in Turkey and stressed the value of predictive analytics in policy formulation.
Several studies in the literature have discussed sustainable extensions of the Vehicle Routing Problem (VRP) to incorporate environmental concerns in addition to logistical efficiency. Bektaş and Laporte [14] introduced the Pollution-Routing Problem, which accounts for the correlation between fuel consumption, emissions, and vehicle load, laying the foundation for environmentally aware routing models. Erdoğan and Miller-Hooks [15] proposed a green VRP model that integrated emissions as a route optimization criterion, while Jabir et al. [16] provided a detailed review of sustainability-oriented VRP formulations and solution approaches. A more recent review by Asghari et al. [17] and Ghorbani et al. [18] offered comprehensive surveys on green VRP literature, categorizing models according to vehicle type, objective functions, and constrains. The findings emphasize alternative fuel vehicles, emission constrains, and hybrid solution methods. Additionally, Abdullahi et al. [19] presented a stochastic sustainable VRP that considers demand uncertainty and travel time variability and addresses the dynamic nature of urban distribution. These studies emphasize the importance of integrating sustainability indicators into routing models, though many still rely on static conditions or overlook real-time traffic and spatial demand clustering—key components addressed in the present study.
Recent studies have shown the potential of artificial intelligence and clustering techniques in improving routing and demand management. Ma et al. [20] proposed a hybrid approach that combines the K-means algorithm with ant colony optimization for logistics distribution. The approach showed notable improvements in route efficiency and computational performance. Lei et al. [21] created a clustering-based heuristic for solving the capacitated vehicle routing problem (CVRP), in which the spatial grouping of customer locations aided in reducing problem complexity. Similarly, Yu et al. [22] integrated K-means clustering with a genetic algorithm to solve dynamic VRPs under time constraints, his work revealed faster convergence and better adaptability to real-time changes.
These approaches highlight the importance of demand clustering as a preliminary step to solve routing problems, although most models either use static customer data or overlook integration with live traffic information. The current study incorporates real-time travel distances and K-means clustering to dynamically segment customer demand points, offering a more operationally relevant solution.
In addition to the classical mathematical programming approaches, a range of metaheuristic and AI-based algorithms have been applied to sustainable logistics problems. Among these, Ant Colony Optimization (ACO) has received significant attention due to its flexibility in solving complex, nonlinear, and dynamic routing scenarios. For example, a recent study by Al-Khudairi et al. [23] introduced a stochastic network routing mechanism optimized via an ACO framework to enhance sustainability in logistics operations, demonstrating reduced travel distance and lower carbon emissions compared to traditional models. ACO algorithms are particularly effective in adapting to fluctuating traffic and demand patterns, making them suitable for real-time logistics and urban distribution problems. Other dynamic routing models have incorporated emissions and fuel consumption constraints into the objective function to balance cost, distance, and environmental factors. Al-Tayar & Alisa [23] outlined various scenarios for identifying the optimal routing solution in a stochastic network environment and considered both fixed (static) and changing (dynamic) network parameters by utilizing the Ant Colony Optimization (ACO) metaheuristic to discover the most efficient path between the designated source and target nodes. Aldás et al. [24] investigated the relationship between industrial production, current expenditure, and CO2 emissions by using a methodology that comprised variable description, correlation analysis, and a multiple regression model. Their analysis showed a substantial environmental impact: two million tons of pollutants are released annually as a result of the manufacturing sector's reliance on fossil fuels and overall economic activity. Heti et al. [25] offered an overview of the engineering approaches currently being used to address important global concerns, particularly the mitigation of climate change, sophisticated energy storage systems, sustainable architecture, and the spread of renewable energy sources.
Despite the wide research in green logistics, sustainable routing, and AI-enhanced clustering techniques, there remains a lack of integrated, real-world models that combine these elements. Most existing studies rely on static datasets that assume uniform delivery scenarios, or overlook real-time traffic conditions, which limits operational applicability in urban distribution networks. Demand clustering has proven effective in reducing problem complexity; nonetheless, few studies have explored its combination with real-time traffic data and heterogeneous fleet constraints within a unified optimization framework. This study addresses these limitations by developing a data-driven, multi-objective routing model that uses real-time travel distances, AI-based clustering, and carbon emission reduction for a bottled water company that operates in a high-demand urban environment.
Our proposed model aligns with growing pressures from regulators and customers to adopt sustainable practices. The methodology we used offers a strategic advantage by ensuring service reliability while actively reducing the environmental impact of operations for bottled water companies operating in Saudi Arabia.
3. METHODOLOGY
This study utilizes a data-driven approach to optimize the transportation system for bottled water delivery, accounting for real-time traffic fluctuations. The process starts with the collection of geographic coordinates and daily demand quantities for all customer delivery points within a specific area. The data are sourced from the company’s records. In order to ensure accuracy in distance measurement and travel time estimation, the Google Maps Distance Matrix API is used. This API provides pairwise travel distances and times between all customer locations as well as between each location and the central depot. The API captures live traffic conditions, congestion patterns, and road restrictions -unlike static distance tables- which allows the model to reflect dynamic travel times during the actual planning horizon. Therefore, the proposed dynamic programming considered the traffic on the road in real-time.
The demand points are pre-processed using a clustering technique to reduce the problem complexity and create geographically compact delivery zones while following the distance calculation. Specifically, the K-means algorithm is employed to group customers based on their spatial proximity to one another. The number of clusters is determined by the number and capacity of available vehicles so that each cluster can be feasibly serviced by a single truck to reduce computational effort in the optimization stage and ensure that routes within each cluster are geographically coherent. Figure 1 illustrates how the clustering structure adjusts dynamically depending on the number of customer demand points considered, ensuring that similar delivery nodes are grouped together.
After defining the clusters, each cluster’s data (customer demand, distances, and coordinates) is fed into a capacitated Vehicle Routing Problem (CVRP) model designed for multi-objective optimization. The model is designed to integrate two competing objectives: (i) minimizing total travel distance, and (ii) minimizing carbon emissions generated by each truck size during delivery operations. In order to balance these objectives, a weighted parameter is used, enabling scenario analysis under different environmental and economic priorities. The model further incorporates practical constraints such as vehicle capacity limits, mandatory visits to all demand points, route continuity (eliminating subtours), and depot start-and-end requirements. The problem is formulated as a mixed-integer linear program (MILP), and the clustering and route optimization were implemented in Python using the Scikit-learn library for K-means. The resulting output provides the optimal assignment of trucks to clusters, the delivery sequence within each cluster, and the expected travel distance and carbon emissions under dynamic traffic conditions.
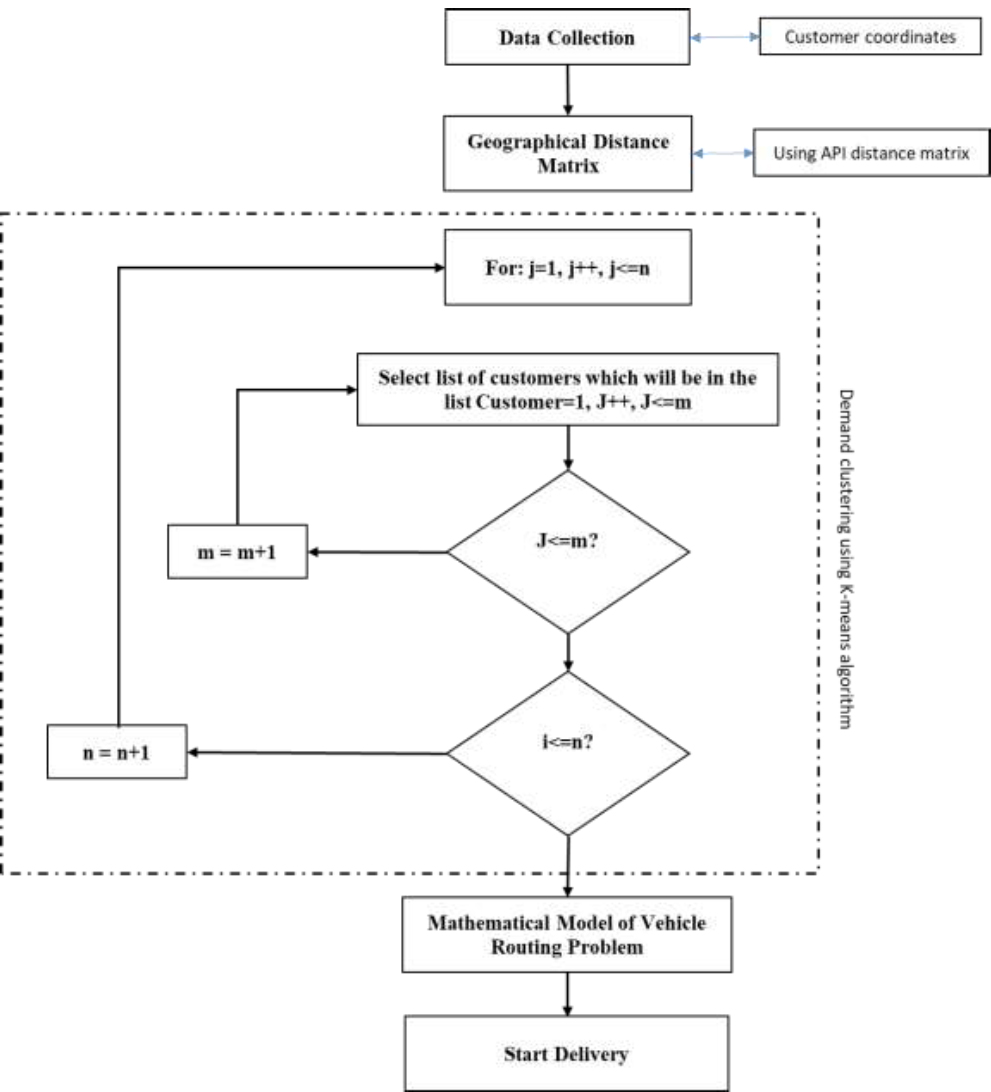
Summary of the methodology.
3.1. Mathematical Model
Model notation
The following notation is used for the model's mathematical formulation.
Sets:
i, j: set of customers {1, 2, 3 … }
t: set of trucks {small-size, mid-size, large-size, … }.
Parameters:
DIi,j: Distance between customer i and j.
Et: amount of carbon emitted by truck t (CO2grams/kg).
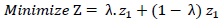
λ: factor controls the trade-off between the objective functions.
DEi: Demand of customer i.
Ct: Capacity of truck t.
Variables:
 : 1 if tuck t travels from customer i to j, 0 otherwise.
For each customer j
For each truck t
For each truck t
For each customer i,j, and truck t
For each customer i and truck t
For each customer i and j, and truck t

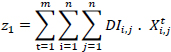
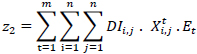
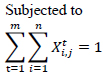
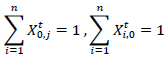
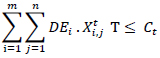
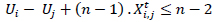
Objective function (1) minimizes the travelling distance from customer i to j, while objective function (2) minimizes the total emission for truck t on a route to satisfy the demand of all customers i & j. The weighted composite objective function is represented in (3). The weighted composite objective function minimizes both the travel distance and the carbon emission resulting from transportation activities. Equation (4) is a constraint that is to strictly visit each customer demand point to be visited once by one truck t, while constraint (5) ensures that each truck t starts and ends at the depot. Constraint (6) sets the capacity limitation of each truck t, which can not exceed all the customers' demands visited in a route. Constraint (7) ensures one connected route per truck t without disconnected cycles (subtours) among customers i & j. For each truck t in constraint (8), it leaves the customer demand point i after its arrival to ensure the flow. The truck t selection between customer demand points i & j is a binary variable as represented in constraint (9).
4. NUMERICAL EXAMPLE
The proposed model is validated through an illustrated example. Riyadh city is the capital of the Kingdom of Saudi Arabia, with an area of 1550 m2 and about 8 million people live there. The population of the city is forecasted and targeted to increase by 2030 to reach more than 10 million people. Data were collected from a bottled water company located in Riyadh city. The customer demand points are 50, and the company operates 9 trucks. Three large-size trucks with a capacity of each is 720 boxes, three midsize trucks with a capacity of each is 480 boxes, and three small-size trucks with a capacity of each is 270 boxes. Each truck size emits the same amount of carbon, meaning that all the large-size trucks emit the same amount of carbon, and this is consistent across all trucks of the same size. It is assumed that supplied products are to satisfy the next day's projected demand.
5. RESULTS
5.1. Case I: Different Vehicle Sizes with different Capacities
The optimization model was tested on a dataset consisting of 50 customer demand points across Riyadh, served by a fleet of nine heterogeneous trucks— comprising large, mid-size, and small-sized vehicles. The analysis was conducted under three different weighting scenarios in order to reflect various strategic priorities between minimizing travel distance and reducing carbon emissions:
• Scenario 1: Equal importance given to both objectives (50% distance, 50% emissions).
• Scenario 2: Greater emphasis on minimizing travel distance (80% distance, 20% emissions).
• Scenario 3: Greater emphasis on reducing emissions (20% distance, 80% emissions).
For each scenario, the customer locations were clustered into six groups using the K-means algorithm, with each cluster being assigned to one truck. The optimization model was then run independently for each cluster, producing route assignments and operational statistics including load utilization, total distance traveled, and carbon emissions per truck.
The model selected the same fleet composition for all three scenarios: two large trucks, two mid-sized trucks, and two small trucks. This suggests that the vehicle allocation strategy is robust to changes in objective priorities and is a reflection of the natural clustering of demand density and volume.
While the truck assignments remained unchanged, the total weighted objective function, which balances emissions and distance, differed significantly across the scenarios:
• Scenario 1 (balanced): Objective value = 467.30
• Scenario 2 (distance-prioritized): Objective value = 546.15
• Scenario 3 (emissions-prioritized): Objective value = 388.42
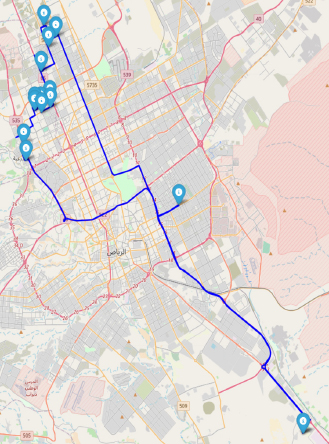
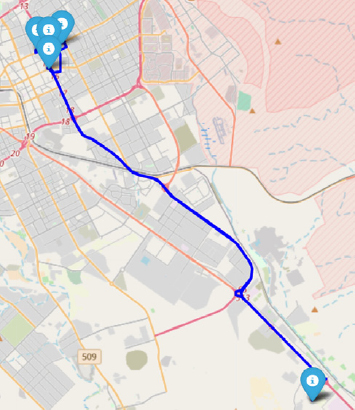
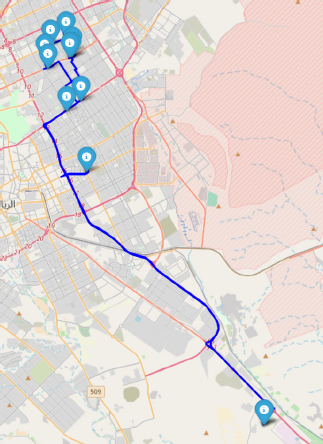
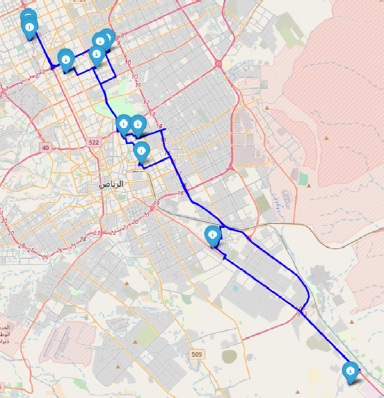
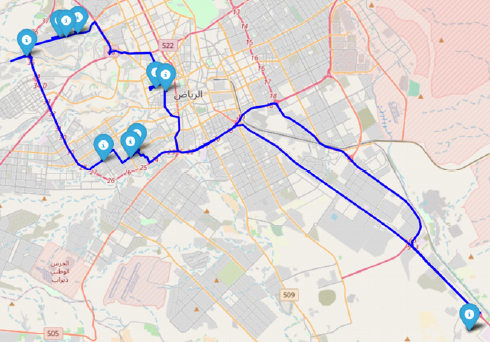
Tables 1 to 3 summarize the performance of each truck under the three scenarios, showing key metrics such as load vs. capacity, total traveled distance, and carbon emissions. While vehicle assignment remains consistent, the distribution of loads and the resulting emissions reflected the strategic trade-offs between operational efficiency and environmental impact. Figures 2 to 7 illustrate the optimized delivery routes for each truck. The route maps show minimal overlap and well-defined travel paths, which validate the efficiency of the clustering and routing methodology. Route structures were consistent across scenarios, further supporting the model’s routing stability.
5.2. Case II: Fixed Vehicle Sizes with Fixed Capacity
The model was run for another city, considering four small vehicles and their equal capacities (60 units per truck) and carbon emissions of 0.08, 0.05, 0.09, and 0.07, respectively. Based on the model generated for the allocation of trucks, trucks were assigned to the customers as shown in Table 4.
• Scenario 1 (balanced): Objective value = 65.34
• Scenario 2 (distance-prioritized): Objective value = 99.49
• Scenario 3 (emissions-prioritized): Objective value = 31.20
Table 4 demonstrates the model’s capacity to account for heterogeneity in environmental performance, even within a fleet of structurally similar vehicles.
| Scenario 1 | Capacity (box) | Load (box) | Travelled Distance (km) | Carbon dioxide Emitted (kg of CO2) |
|---|---|---|---|---|
| Truck 1- large size | 720 | 720 | 143.04 | 85.82 |
| Truck 2- large size | 720 | 702 | 118.18 | 70.91 |
| Truck 1- mid-size | 480 | 471 | 97.12 | 53.42 |
| Truck 2- mid-size | 480 | 474 | 109.95 | 60.47 |
| Truck 1-small size | 270 | 242 | 73.5 | 36.75 |
| Truck 2-small size | 270 | 125 | 56.95 | 28.48 |
| Scenario 2 | Capacity (box) | Load (box) | Travelled Distance (km) | Carbon dioxide Emitted (kg of CO2) |
|---|---|---|---|---|
| Truck 1- large size | 720 | 720 | 143.04 | 85.82 |
| Truck 2- large size | 720 | 702 | 118.18 | 70.91 |
| Truck 1- mid-size | 480 | 471 | 97.12 | 53.42 |
| Truck 2- mid-size | 480 | 474 | 109.95 | 60.47 |
| Truck 1-small size | 270 | 242 | 73.5 | 36.75 |
| Truck 2-small size | 270 | 125 | 56.95 | 28.48 |
| Scenario 3 | Capacity (box) | Load (box) | Travelled Distance (km) | Carbon dioxide Emitted (kg of CO2) |
|---|---|---|---|---|
| Truck 1- large size | 720 | 720 | 143.04 | 85.82 |
| Truck 2- large size | 720 | 702 | 118.18 | 70.91 |
| Truck 1- mid-size | 480 | 471 | 97.12 | 53.42 |
| Truck 2- mid-size | 480 | 474 | 109.95 | 60.47 |
| Truck 1-small size | 270 | 242 | 73.5 | 36.75 |
| Truck 2-small size | 270 | 125 | 56.95 | 28.48 |
| Scenario 1 | Capacity (box) | Load (box) | Travelled Distance (km) | Carbon dioxide Emitted (kg of CO2) |
|---|---|---|---|---|
| Truck 1-small size | 60 | 50 | 37.75 | 3.02 |
| Truck 2-small size | 60 | 56 | 52.59 | 2.63 |
| Truck 3-small size | 60 | 48 | 27.37 | 2.46 |
| Truck 4-small size | 60 | 43 | 4.54 | 0.32 |
Large-size truck-1 route.
Large-size truck-2 route.
Mid-size truck-1 route.
Mid-size truck-2 route.
Small-size truck-1 route.
Small-size truck-2 route.
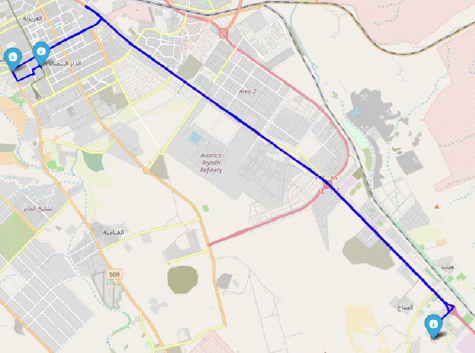
Figures 8 to 11 illustrate the optimized delivery routes for each truck and the comparison between demand and truck capacity as shown in Fig. (12). Route structures were consistent across all scenarios. The model managed to reduce emissions by assigning trucks with higher-emission rates to shorter routes (e.g., Truck 4 in Fig. 11), and trucks with lower-emission rates (e.g., Truck 2 in Fig. 9) to longer and heavier routes.
These route maps demonstrate the model's ability to integrate environmental performance metrics into spatial routing decisions within a homogeneous fleet structure.
Figure 12 shows the optimization model’s balancing technique, where trucks with lower emission factors (e.g., Truck 2) are more heavily utilized, while higher-emission vehicles (e.g., Truck 4) are less utilized.
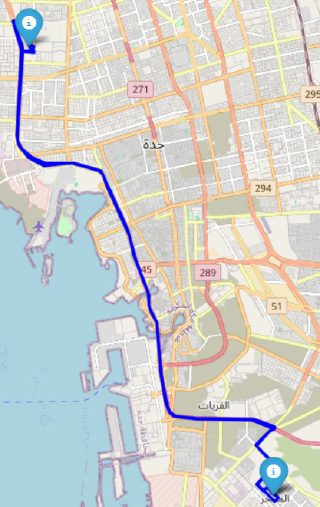
Small-size truck-1 route.
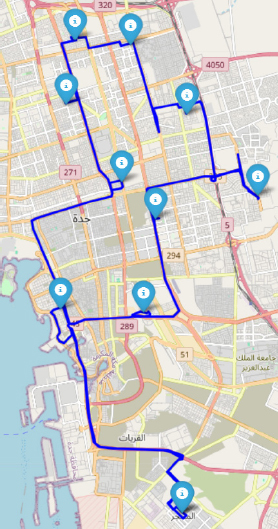
Small-size truck-1 route.
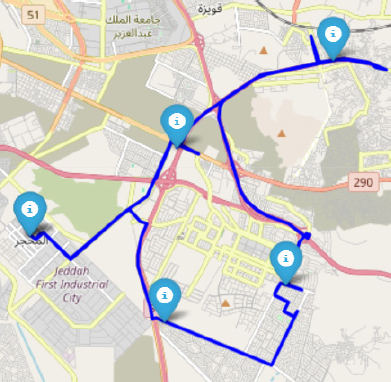
Small-size truck-1 route.
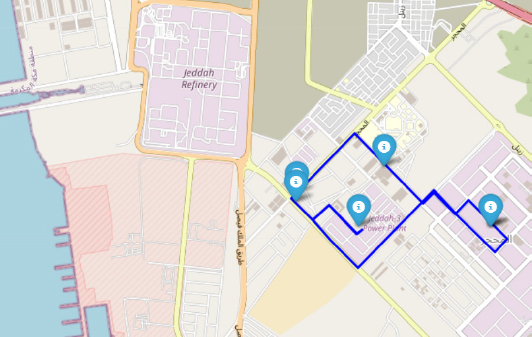
Small-size truck-1 route.
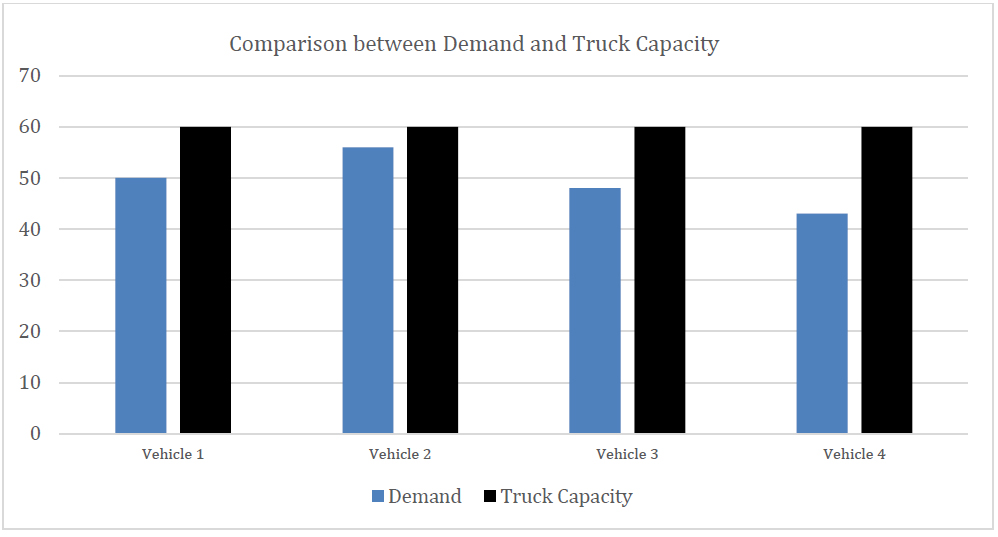
Comparison between demand and truck capacity.
6. DISCUSSION
The results demonstrated several insights regarding sustainable transportation planning. First, the consistency of truck assignment across all three scenarios indicates that the model’s clustering and routing process is robust to any changes in strategic objectives, which suggests that the inherent distribution of demand and geographical clustering affect fleet structure even when emission reduction is prioritized over distance or vice versa.
Second, while vehicle deployment remained constant, the composite performance objective and carbon outputs varied significantly. For example, Scenario 3, which prioritized emissions, achieved the lowest total emissions at 335.85 kg but resulted in slightly longer routes. Scenario 2, which prioritized shorter travel distances, resulted in higher emissions (408.85 kg).
Moreover, detailed truck-level data showed that vehicle utilization aligns with both size and route distance. For example, in Scenario 1, large Truck 1 operated at full capacity and traveled 143.04 km, emitting 85.82 kg of CO2. These results highlight the importance of balancing loads and the selection of vehicle types in order to optimize sustainability objectives.
Another key observation is the importance of AI-based clustering of spatially close points of customer demands. The clustering allows for more efficient route generation even in a dynamic urban setting such as Riyadh, which contributes to the overall model’s consistency and scalability.
Finally, the utilization of real-time distance data allows the model to reflect urban traffic congestion and travel variability, which is often missing in traditional static VRP models. This makes the proposed approach more applicable to real-world logistics planning under sustainability constraints.
In addition to the primary numerical analysis conducted for the Riyadh case (case I), the model was tested on a second dataset (Case II). The second case involved a homogeneous fleet of small-sized trucks operating under fixed capacities, and was based on a different urban setting and customer demand structures. This case further demonstrated the model’s flexibility. While Case I featured a heterogeneous fleet and showed consistent truck assignments across all three weighting scenarios, Case II involved variable emission rates across identical vehicles and revealed subtle differences in routing and load balancing. Despite these differences, the model maintained stable routing behavior and continued to minimize the composite objective effectively in all scenarios.
It is important to note that both cases confirmed the expected trade-offs between environmental and operational goals. Emissions-focused scenarios consistently yielded reduced carbon outputs, whereas distance-focused configurations resulted in shorter routes. These observed trends reinforce the robustness of the model in handling diverse optimization priorities. The inclusion of Case II strengthened the empirical support for the model’s adaptability, validating its applicability to different logistics structures and sustainability requirements.
In addition to the primary numerical analysis conducted for the Riyadh case (Case I), the model was also tested on a second dataset involving a homogeneous fleet of small-sized trucks operating under fixed capacities (Case II). This additional case, based on a different urban setting and customer demand structure, further demonstrated the model’s flexibility. While Case I featured a heterogeneous fleet and showed consistent truck assignments across all three weighting scenarios, Case II involved variable emission rates across identical vehicles and revealed more nuanced differences in routing and load balancing. Despite these differences, the model maintained stable routing behavior and continued to minimize the composite objective effectively in all scenarios.
Both cases confirmed the expected trade-offs between environmental and operational goals. Emissions-prioritized scenarios consistently produced lower carbon outputs, while distance-prioritized configurations achieved shorter routes. These patterns reinforce the robustness of the model in handling different optimization priorities. The inclusion of Case II strengthened the empirical support for the model’s adaptability, validating its applicability to different logistics structures and sustainability requirements.
7. LIMITATIONS
The method assumes all trucks of the same size emit a similar amount of carbon.
CONCLUSION AND FUTURE WORK
This study presents an optimization framework that supports sustainable routing strategies for the distribution of bottled water. The model is promising in structure and performance; however, it is limited by several assumptions, such as static fleet availability, uniform emission factors, and the amount of fixed daily demands, which may affect generalizability.
In order to validate the applicability of the proposed model, two test cases were evaluated: one with a heterogeneous fleet of varying truck capacities (Case 1) and another with a homogenous fleet of small vehicles (Case II). Both cases were examined according to three objective-weighing scenarios. The model showed an ability to adapt to different operational structures and strategic priorities. The results confirmed the robustness of the proposed model and that of the clustering and routing method. The results also reinforced the suitability for real-world transportation systems.
For future work, the methodology can possibly be upscaled to larger networks, and in order to enhance operational relevance, multiple depots, variable traffic patterns, and fuel types can be incorporated. With growing demand for environmentally conscious logistics, such frameworks can guide decision-making in transportation systems of bottled water and beyond.
AUTHORS’ CONTRIBUTIONS
The authors confirm contribution to the paper as follows: M.A.: Contributed as the research supervisor and was responsible for the conception and design of the study, drafting of the manuscript, and final approval of the version to be published; O.A.: Handled drafting the methodology, building the model, and obtaining and revising the results; B.A., A.A., K.A., and A.A.: were involved in data collection, analysis, and interpretation of the data, as well as drafting of the manuscript.
LIST OF ABBREVIATIONS
| VRP | = Vehicle Routing Problem |
| CVRP | = Capacitated Vehicle Routing Problem |
| ACO | = Ant Colony Optimization |
| MILP | = Mixed-Integer Linear Program |
CONSENT FOR PUBLICATION
All authors have read and approved the final version of the manuscript and consent to its submission for publication.
AVAILABILITY OF DATA AND MATERIALS
The data and supportive information are available within the article.
FUNDING
This research did not receive any specific grant from funding agencies in the public, commercial, or not-for-profit sectors.
CONFLICT OF INTEREST
The authors declare that they have no known competing financial interests or personal relationships that could have appeared to influence the work reported in this paper.
ACKNOWLEDGEMENTS
The authors are grateful to the reviewers for their valuable feedback and to Al Yamamah University for providing a supportive research environment.

