All published articles of this journal are available on ScienceDirect.

Determining Indicators for Future Mobility and Regional Connectivity in Indonesia’s Nusantara Capital City: A Systematic Review
 iD
Suryo Hapsoro Tri Utomo1
Muhammad Zudhy Irawan1
iD
iD
Suryo Hapsoro Tri Utomo1
Muhammad Zudhy Irawan1
iD
Authors Info & Affiliations
Abstract
Introduction
This systematic review identifies Key Performance Indicators (KPIs) for evaluating future mobility and transportation connectivity in Indonesia’s new capital, Ibu Kota Nusantara (IKN). The study focuses on the initial development phase of the Core Government Area, emphasizing the integration of multimodal systems and “smart forest city” concepts.
Methods
A systematic literature review was conducted to synthesize indicators across two dimensions: technological drivers (autonomous vehicles, electrification, and Mobility-as-a-Service/MaaS) and physical enablers (public transport and active micromobility). Using a Socio-Technical and CLIOS framework, 36 peer-reviewed studies were synthesized to determine critical mobility metrics.
Results
The study identified 62 KPIs; among technological drivers, policy readiness and ICT integration were the most prevalent research focuses. In the physical enablers dimension, public transport efficiency and pedestrian-cyclist connectivity emerged as the highest-weighted indicators for capital city connectivity.
Discussion
These findings suggest that for IKN to meet its ambitious public transport targets, policy focus must shift from general fiscal incentives toward localized, fleet-based strategies that prioritize multimodal seamlessness over private vehicle ownership.
Conclusion
Achieving IKN’s vision of a modern, responsive capital depends on the rigorous application of these KPIs to bridge the gap between future mobility technology and physical urban infrastructure.
1. INTRODUCTION
President Joko Widodo announced Indonesia’s capital relocation on August 16, 2019, moving to North Penajam Paser Regency, East Kalimantan. The relocation was prompted by the demographic imbalance in Java’s population, the decreasing environmental capacity of Jakarta, resource scarcity and accessibility problems, and the decline of the city’s environment and installed infrastructure [1]. Jakarta has suffered 35-50 cm of land subsidence during the last decade, from 2007 to 2017 [2]. The new Ibu Kota Nusantara (Nusantara Capital City, IKN) will be constructed and developed while observing the arrangements of a “forest city,” “sponge city,” and “smart city,” while applying the principles of Transit-Oriented Development (TOD) and future mobility to enhance sustainable accessibility. The focus of this study will be on the first development phase in the Core Government Area, which consists of allocated zones for governmental, educational, and health care functions. The Core Government Area is illustrated in Fig. (1). Zoning plans outlined for Indonesia's new capital represent the expected staged development for the Core Government Area. Within the zoning plan, the zone is further divided into three sub-planning zones, which serve their own specific purpose. The zoning plan, with outlined expected time frames, purposefully focuses on government buildings and infrastructure in the first stages, to then mesh the educational, residential, and healthcare elements. This is intended to provide a sustainable IKN to support the long term.
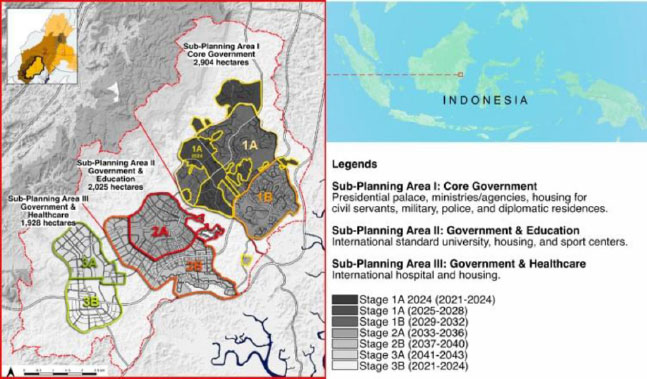
Zoning plan for the phased development of the core government area.
IKN is positioned to be Indonesia’s new capital largely due to Jakarta’s mobility and connectivity issues. Jakarta still has to deal with problems of high vehicle population, high traffic congestion, poorly integrated public transportation, air pollution, and socio-economic disparities. The overdependence on private vehicles has resulted in chronic congestion and poor air quality [3]. While the introduction of the Mass Rapid Transit (MRT) system has been a positive step, the poorly designed last-mile systems have greatly limited the system's effectiveness in relieving congestion [3]. Additionally, poor urban planning has resulted in a deficit of green urban spaces, poorly designed drainage systems, and other infrastructure, raising urban disaster risk [4]. The problems of sprawl and regionalism in this country necessitate a capital with a more effective system to control sprawl, as well as the construction of more effectively connected (integrated) systems between cities. Socioeconomic disparity also impacts the ability to move around. Inadequate transportation systems isolate poor people geographically from employment opportunities and service providers, which adds to inequality [5]. The government is relocating the national capital to allow for the decentralization of economic growth, while focusing on developing flexible improvements to the infrastructure of each region [5].
The goal of creating a connected and mobile community in IKN represents another step for Indonesia toward developing the new capital into an advanced and sustainable city. At the same time, the relocation from Jakarta aims to help alleviate population density and environmental problems [6, 7]. The vision of IKN is a “smart city” with transportation and connectivity solutions that are sustainable and contemporary [8, 9]. Improving mobility and reducing congestion primarily hinges on the provision of public transport. Ensuring accessibility and quality of life in the urban center will be boosted by the planned sustainable transit systems, which encompass Autonomous Vehicles (AVs), electrification, and Mobility-as-a-Service (MaaS) [8]. The IKN strategy to achieve low emissions includes integrating urban growth with environmental conservation via the “forest city” concept that will be implemented by electric ship use in addition to creating large green belts [10], which is part of an integrated vision. This vision has been implemented through the development of a Sustainable Urban Mobility Plan (SUMP) that shifts the city's focus from vehicle-centric planning to pedestrian, cyclist, and public transportation-oriented planning [11]. Additionally, the implementation of intelligent waste management will further contribute to the quality of the urban environment [12]. To ensure that growth is sustainable, strong policies will need to exist that link the construction of new infrastructure with the protection of the environment. The long-term sustainability of IKN will depend on how well it balances land-use changes and its ecological footprint [6].
Tracking Key Performance Indicators (KPIs) allows a city to ensure that all mobility initiatives support its long-term vision or strategy. In addition to offering a common way to measure the effectiveness of policies for transportation as well as investments in transportation infrastructure, KPIs provide a quantifiable standard by which to measure the success of a city's transportation policies and investment decisions. The inclusion of stakeholders in developing KPIs also provides the ability to create realistic assessments of a city’s mobility; using the input of users of the transportation system, urban planners, and government officials establishes a sense of shared responsibility among stakeholders, increases transparency, builds public trust, and increases the likelihood of public engagement [13]. Developing KPIs as part of smart city initiatives can also increase the efficiency of managing urban mobility through the use of real-time analytics and automated adjustments to urban systems [14]. Additionally, KPIs are valuable in assessing the impact of another important component of progress, the sustainability of urban transportation, in terms of energy consumption, emission reductions, and other quantitative impacts of initiatives designed to promote sustainable mobility [15]. As cities place a greater emphasis on sustainability, KPIs will continue to be helpful in directing transportation infrastructure investments and policy investments toward a more efficient and environmentally friendly transportation system [16, 17].
A behavior change in the use of sustainable transportation has been recognized as valuable. Rodríguez-Rad et al. [18] stated that young people (university students) will be more likely to utilize more sustainable forms of transportation when they are aware of and appreciate the economic and environmental consequences of their transportation choices. Similarly, Aguilera-García et al. [19] also state that demographic changes and stagnant urban mobility patterns will force cities to develop strategies to alleviate congestion and pollution.
The SUMP is a common way to organize how to create urban transportation systems. According to Kalakou et al. [20], it is important to build the ability of local authorities to implement projects on sustainable mobility. Müller-Eie & Kosmidis [21] indicate that it is necessary to plan strategically with respect to smart cities. In the long run, such frameworks will help support urban sustainability as indicated by the SDGs [22]. The policies created will influence the balance of urban mobility. According to Colombo & Dijk [23], there are two main ways to reduce the carbon footprint of urban mobility: increasing the use of public and active transportation and increasing the use of clean vehicle technologies. Hrelja et al. [24] indicate that participatory planning has the potential to meet the wide range of urban planning needs of stakeholders, especially in areas of urban sprawl with low density, which have unique challenges. To bridge these planning goals with operational execution, the level of technology included in planned cities serves as a critical enabler. Specifically, Intelligent Transportation Systems (ITS) provide the necessary technical framework, incorporating components such as smart infrastructure, real-time analytics, and electric vehicle integration [25, 26]. By leveraging these technologies, ITS improves transportation efficiency, optimizes public transit systems, and reduces congestion, thereby directly supporting the environmental sustainability targets of the broader mobility framework.
Research in many areas concerning IKN, including sustainability, infrastructure, governance, and environmental impacts, has analyzed development in nearly every aspect of IKN. Most notably, studies have shown how IKN was planned as a “forest city” and as such will include smart, sustainable urban planning, strong support for renewable energy and low-carbon development, along with integrated infrastructure [9, 10, 27]. Some studies highlighted the need for complexity in different fields and the use of interdisciplinarity to help address urban development issues at IKN [28]. As for infrastructure, since IKN is being developed over an expansive 256,142-hectare area of land that includes residential, public, and transportation development, studies have been conducted concerning infrastructure; it has been suggested that the use of Building Information Modeling (BIM) and Geographic Information Systems (GIS) could provide enhanced planning and implementation [28]. Studies have also examined the projected employment and community well-being improvements from the employment created by IKN [6, 8]. In addition, studies have identified some of the challenges that IKN faces regarding financing, governance, and the environment. Studies focusing on the sustainability of IKN discussed budgetary issues, climate change, biodiversity, and the governance of water resources [29, 30]. Additionally, there are still debates among both the public and policymakers concerning whether or not IKN is feasible [9, 31].
Although there has been much discussion about the overall sustainability of IKN, an important knowledge gap remains concerning the systematic quantification of its performance in terms of mobility. In addition to numerous studies that have addressed the feasibility of building a “forest city” in relation to IKN's “future mobility” vision [9, 10, 27, 28], a fundamental shortcoming still exists regarding a well-defined, evidence-based framework for establishing KPIs for bridging the gap between high-tech “future mobility” aspirations and the physical connectivity needed for a planned administrative capital. This study fills the existing knowledge gap through the use of a Socio-Technical and CLIOS framework for synthesizing a set of KPIs derived from a global systematic literature review. The novelty of this study lies in the development of the first evidence-based KPI framework specifically engineered to bridge the gap between high-tech “future mobility” aspirations and the physical connectivity requirements of Indonesia’s new administrative capital. Therefore, the goal of this systematic review is to develop a multi-dimensional measurement tool that will assess how autonomous systems are integrated into, multimodal connectivity options exist in, and active transportation modes can be used within the IKN environment.
2. LITERATURE REVIEW
2.1. Nusantara Capital City
By relocating the capital to IKN in East Kalimantan, the Indonesian government can meet its strategic objectives by creating an up-to-date, sustainable governmental center. The overall conceptual framework for the planning of the new capital is based on the “smart and sustainable forest city” model with an integration of urban space and natural space. The first stage of the development phase will focus on the Core Government Area and the design of innovative technologies for sustainable development and implementation.
The integrated transportation network will be designed so that it includes highways, sidewalks, bicycle paths, and public transport. In addition, the integrated transportation systems are also being planned for the future with electric vehicles and AVs, and the MaaS concept, and this will focus greatly on ease of travel and accessibility. The capital city establishment plan highlights the seamless integration of multimodal transport systems to allow movement from one area to another within and outside the IKN. Developing clear indicators to assess the extent to which the city has integrated futuristic mobility and connectivity ideas will ensure IKN achieves the vision of a world-class smart, sustainable city. For integrated transportation policies to achieve resolved mobility goals that are safe, efficient, IKN-focused, and aligned, these indicators will need to be defined.
2.2. Future Mobility
Advancements in AVs are prioritized in the context of future mobility, considering their ability to provide safety and efficiency improvements in the transportation sector [32, 33]. Such vehicles are capable of driving themselves, identifying lanes and obstacles, and coordinating with other vehicles and transport infrastructure [34]. Although there are still some development and legislation challenges to be addressed, AV technology will most likely be able to minimize the number of road accidents in the future [35].
Another innovative idea on future mobility with the potential to change transportation is MaaS, which enables users to plan and pay for several transport options within a single platform. Users can access real-time networks, receive suggested travel routes, and plan tailored journeys for a wide array of travel needs. MaaS promotes and supports travel integration with unified payment systems that span multiple transport systems.
However, the success of such a platform in IKN depends on the underlying hardware; specifically, the integration of electric public transport and private Electric Vehicles (EVs), which minimizes emissions and improves urban environmental quality [36]. In line with Directive 2014/94/EU, the European Union has established the goal of having one charging station for every ten EVs at airports, stations, and public parking areas. This policy is coupled with emission reduction targets at the national level and subsidies for the purchase of emission-friendly vehicles [37].
The operational efficiency of both MaaS and EV networks is further driven by Information and Communication Technologies (ICT). ICT further advances access to information and the provision of public Wi-Fi access, which is a “smart” city-built development [38]. The adoption of ICT has been shown to increase the flexibility of mobility, which in turn aids in reducing traffic congestion, air pollution, noise levels, and accidents [39]. In addition, ICT aids the provision of real-time traffic updates, which are key in modern transport policy and travel management [40].
In IKN, this integration must evolve beyond simple payment processing into an intelligent system powered by Artificial Intelligence (AI). As noted by Nofal [41], the application of deep learning in traffic forecasting can achieve near-total accuracy, making it a crucial tool for realizing IKN’s “10-minute city” mandate through predictive travel management.
Ultimately, the deployment of these technologies relies on coordinated government policies and infrastructure investment [42]. Enhancing mobility will need intermodal integration and the deployment of MaaS. Incentives for EVs are also provided by the government, such as specific toll access and exemptions from odd-even traffic rules. However, a primary challenge remains the cost-driven decline in public transit usage. Addressing this requires a policy framework that ensures the intermodal integration of MaaS is not only technologically advanced but also economically accessible.
2.3. Capital City Connectivity
The Nusantara Smart City Blueprint (2023) describes IKN as “connected, active, and accessible” and has planned for 80% of trips to be completed via public transport within 10 minutes through integrated public transit systems. This includes public transport systems through land, rail, and river networks that are designed to connect the National Activity Center and its rim areas. To support IKN's vision as an environmentally sustainable, multimodal public transport system, public transport will be equipped with GPS and real-time tracking, smart cards, automated systems, and a 300-m multifunction stop.
Research has frequently relied on the travel time ratio to assess the competitive nature of public transport against private vehicles, noticing that public transport takes longer due to walking, switching transport modes, and other considerations. Besides the development of public transport, infrastructure for private vehicle mobility is also being constructed. This is aimed at maintaining a balance between public and private transport because it is believed to be important for flexible and convenient mobility. Technologies such as Automated Number Plate Recognition (ANPR) and automated parking systems are being used to increase the efficiency of private transportation.
However, this focus on vehicular efficiency is strategically designed to complement, rather than overshadow, IKN's commitment to a healthy and pedestrian-centric urban environment [43]. IKN will be incorporated into a “green and blue” zone, which will allow people to harmoniously adhere to an active and healthy lifestyle while prioritizing walking, accessibility, and areas free of vehicles [44]. The future city will aim to be net-zero carbon by 2045 and will use 100% renewable energy. Government offices will be interconnected with pedestrian bridges to promote eco-friendly mobility.
The success of IKN's pedestrian system will depend upon much more than simply developing the physical network; Excitement factors need to be incorporated in order to promote changes in behavior. Distefano & Leonardi [45] further support this idea by indicating that while the width of sidewalks (a basic factor) can help determine whether or not an obstacle exists, what actually drives walking intention is whether demographic-specific safety is provided. Lastly, Ahmed et al. [46] indicate that coherence (i.e., maintaining a continuous link among all parts of the network) is the most commonly overlooked yet most important KPI for determining if active transportation is used as the primary means of transportation versus simply a secondary recreational activity.
3. METHODS
This study uses a systematic literature review to determine the relevant KPIs on future mobility and the connectivity of capital cities. Figure 2 shows how the systematic search was performed with the PRISMA 2020 guidelines. At first, there were 5,022 records found using Scopus (n = 62) and Google Scholar (n = 4,960). Duplicate records, non-English records, and the application of a relevance-based screening for Google Scholar results were then removed from the dataset. Following this, 360 records were assessed for relevance. The number of records screened was reduced by assessing all 153 article abstracts that had been previously reviewed. A total of 117 articles were eliminated because they were either non-article documents or the topic was not relevant to the study. In addition, 117 articles lacked sufficient quantitative KPIs to be included in the final analysis and quality evaluation. Thus, after all screenings and evaluations were completed, there were 36 peer-reviewed journal articles used as part of the final analysis and quality evaluation.
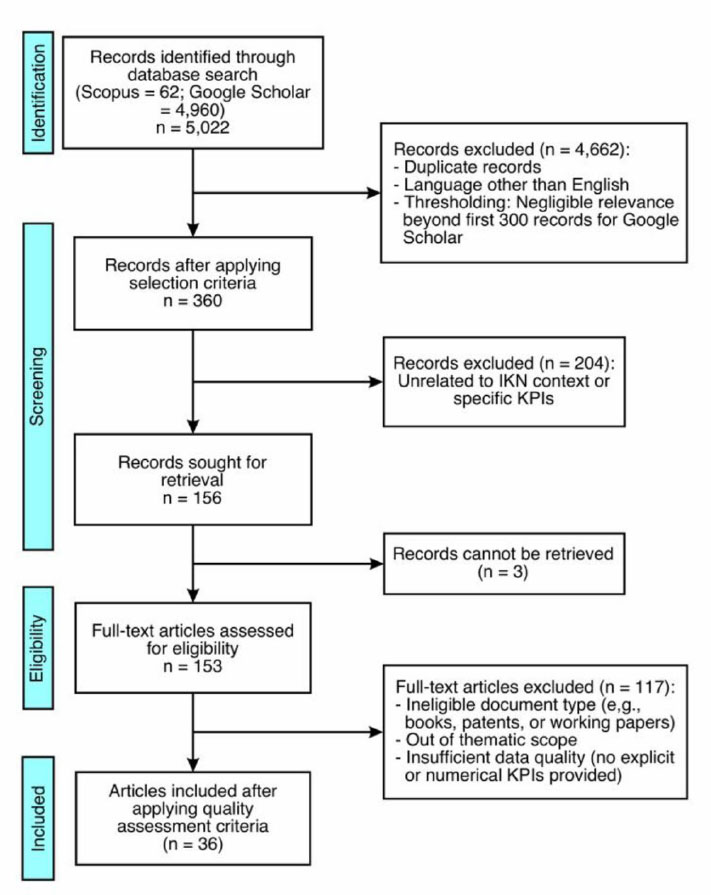
PRISMA flow diagram.
Note: ((“Autonomous Vehicle” OR “Sustainable Transport” OR “Vehicle Electrification” OR “Mobility as a Service” OR “MaaS” OR “Smart Transport” OR “ICT”) AND (“Capital City” OR “Nusantara” OR “IKN” OR “Urban Connectivity” OR “Walkability”) AND (“KPI” OR “Key Performance Indicator” OR “Transport Indicator” OR “Metric”))
Scopus and Google Scholar were chosen to maximize literature saturation with respect to regional specificity. Scopus was identified as the principal database because it has an extensive range of urban planning and engineering literature, which means that the addition of other curated databases will primarily produce redundant results. Google Scholar was essential to provide access to the large amount of emerging literature related to Indonesia’s IKN since IKN is a new development. Therefore, Google Scholar provides an opportunity to include recent local literature for Indonesia's region, including open-access publications and preliminary findings that have not had time to be included in traditional databases due to the normal publication lag.
A structured Boolean query was used in the literature search to achieve a wide coverage of all records related to the research topic across the selected databases (Scopus and Google Scholar). This Boolean search string was formulated based on the three primary thematic areas identified for this study: (1) target technologies and concepts; (2) urban context; and (3) evaluative metrics.
The string was searched against the title, abstract, and keyword fields of publications from 2014 through 2024. Additionally, the study’s inclusion criteria encompassed only peer-reviewed journal articles and conference papers that dealt with transport indicators. For instance, all papers that were non-English, unrelated to smart city transport, and duplicate records were removed. The literature was then examined on the basis of citation analysis, and the indicators were used to discern the relevance and degree of attention in the field of study. The number of times each indicator occurred in the data helped to determine which indicators to select. To be selected as an indicator, it had to occur at least two times; to avoid idiosyncratic or isolated variables, we did not include indicators that appeared less than twice [47].
To avoid selection bias, two independent reviewers reviewed all titles and abstracts using the inclusion or exclusion criteria in Stage 1. The same independent reviewers assessed full-text articles independently in Stage 2. If there were differences of opinion concerning whether to include a particular article, they discussed them until they came to a consensus.
4. RESULTS AND DISCUSSION
4.1. General Characteristics of Literature
Table 1 presents characteristics of the included studies. To summarize this research, we used the Socio-Technical Framework to organize the identified indicators. The Socio-Technical Framework provides a lens through which we can view infrastructure in addition to being seen as simply technical artifacts; it is viewed as a social ecosystem, where both design choice and use are co-produced by interests and social relationships [48]. We have categorized these indicators using the CLIOS framework [49] as having two interdependent dimensions: technological drivers (future mobility) and physical enablers (capital city connectivity). By applying this dual lens, we will be able to illustrate how there is an interaction between the “hardware” of the physical system and the “software” of governance and social structures. The first grouping, indicators of future mobility, captures the socio-technical ensemble of technology, actors, and tasks [50], including AVs, sustainable transport and electrification, MaaS, integration of ICT, and policy considerations. The second grouping, indicators of capital city connectivity, examines the socio-material systems [51] of the physical domain, focusing on public transport, private vehicles, and pedestrian and cyclist connectivity.
| Author(s) | Core Mobility Indicator | Specific KPI/Metric | Linkage (Technological vs. Physical) | Geographic Context |
|---|---|---|---|---|
| Garikapati & Shetiya [52] | Autonomous vehicles and AI integration | Software Package Size (MB/GB per Level); Level of Autonomy (SAE J3016); Processing Power (FLOPS requirements); Fuel Efficiency (truck-specific optimization). | Technological Driver: AI algorithms (Deep Learning/Reinforcement Learning) as the “brain” that enables physical vehicle autonomy and route optimization. | Global industry landscape |
| Abu-Raddaha et al. [53] | Autonomous vehicles and smart infrastructure sensing | Average Precision (AP): 43% improvement; Distance Detection: 194% increase for far hazards; IoU Thresholds: 0.5 to 0.95. | Technological Driver: Deep Learning (YOLOv5) & Perspective Transformation. Physical Enabler: Road condition monitoring (Pothole detection). | Technical/experimental context |
| Giannaros et al. [54] | Autonomous vehicles security and ICT integration | Mitigation Status (Fully/Partially/Uncovered); Threat Classification (CIA Triad: Confidentiality, Integrity, Availability); Attack Type (ML/DNN adversarial attacks). | Technological Driver: Blockchain & Resilient Encryption. Physical Enabler: V2X (Vehicle-to-Everything) communication with road infrastructure. | Global/future trends |
| Lodhia et al. [55] | Electrification and sustainable transport policy | Financial Incentives: A$21,000/vehicle; Charging Infrastructure: 5,800 fast stations (1 unit per 151 km); Uptake Target: National purchase targets. | Technological Driver: Public fleet electrification & purchase targets. Physical Enabler: National fast-charging network (A$1.2B investment). | Developed country context (Australia) |
| Tan et al. [56] | Transportation electrification and shared mobility | Price Competitiveness (EV vs ICE); Charging Infrastructure Density (Public vs Private); Renewable Energy Mix in the grid (%). | Technological Driver: Battery manufacturing & EV-enabled technologies. Physical Enabler: Renewable energy generation & sharing programs (MaaS). | Global (including Indonesia, Thailand, Malaysia) |
| Alonso-Cepeda et al. [57] | Grid integration and energy storage (V2G) | Grid Overload Risk (Level 2 charging impact); RES Penetration % (Renewable Energy Support); CO2 Emission Neutrality (Euro 7 standards). | Technological Driver: EV battery as a storage mechanism. Physical Enabler: Electrical distribution network stability & active demand management. | Global/EU focus (Meta-analysis) |
| Obrador Rey et al. [58] | Battery sustainability and eco-efficiency | Seven Eco-Efficiency Principles; State of Health/Charge (SoX) accuracy; Battery Weight vs. Efficiency ratio. | Technological Driver: Physics-based Reduced-Order Models (P2D-ROM) in BMS. Physical Enabler: V2G strategies and Circular Economy directives. | Global/sustainability standards |
| Aba & Esztergár-Kiss [59] | MaaS and regional maturity | MaaS Readiness Index (MRI); Technological maturity; Business model viability; Coopetition index. | Technological Driver: Routing, booking, payment, and ticketing integration. Physical Enabler: Local mobility opportunities and stakeholder environment. | Regional pilot comparison (six European regions) |
| Jittrapirom et al. [60] | MaaS and service integration | Functional KPIs: Real-time info, trip planning, booking, and e-ticketing availability; Platform Aggregator presence; Mode diversity. | Technological Driver: E-payment, GPS, and personal agenda synchronization. Physical Enabler: Integration of diverse modes (Public, DRT, Shared). | Global review of pilot schemes |
| Cisterna et al. [61] | MaaS ecosystem and behavioral modeling | Actor Interaction Index (Customer, MSP, Gov, Broker); Agent-based Simulation metrics; Business Agreement Impact. | Technological Driver: Discrete choice modeling & agent-based microsimulation. Physical Enabler: Multi-modal transport supply & supply dynamic response. | Global/theoretical framework |
| Kurniati et al. [62] | MaaS implementation and governance | Availability of Funds; Regulation and Policy strength; Stakeholder Familiarization (40% unawareness rate). | Technological Driver: Digital literacy and internet usage potential. Physical Enabler: Integration of public transportation as the fundamental mode. | Indonesia (Joglosemar: Jogja, Solo, Semarang) |
| Tafidis & Bandeira [63] | Sustainable mobility ICT platform (CISMOB) | External Cost Savings (CO2, noise, accidents, air pollution); Infrastructure Efficiency ratio; Vulnerability Mapping. | Technological Driver: Sensor technology, sensor-based data monitoring, and ICT-driven simulation scenarios. Physical Enabler: Road network management and transport infrastructure optimization. | European Regional Cooperation (CISMOB project) |
| Pavlović [64] | Traffic safety and institutional governance | Professional Engagement Rate (Traffic engineers in planning); Legislation Clarity Index (Safety definitions in ground law); Economic Impact of bad planning. | Technological Driver: Safety strategies and technical documentation standards. Physical Enabler: Infrastructure design through expert-led planning documentation. | Local community/national (Serbia) |
| Sobrino & Romero [65] | Cooperative Intelligent Transport Systems (C-ITS) | Safety KPIs (Accident reduction); Traffic Efficiency (Average speed/travel time); Environmental impact (Emission savings). | Technological Driver: V2V and V2I communication (C-Roads Platform). Physical Enabler: Strategic road infrastructure equipped with RSUs (Roadside Units). | Regional pilot (Andalusian Mediterranean, Spain) |
| Tahmasseby [66] | Integrated smart mobility and TDM | Vehicle Kilometers Traveled (VKT) reduction; Multimodal integration (LRT, Water Taxis, Active Modes); Parking Management (Pre-reservation rates). | Technological Driver: ICT-enabled real-time traffic signal control and journey planning. Physical Enabler: Land use plan and active-mode arrangements in urban avenues. | Newly built smart city (Lusail, Qatar) |
| Mekky & Collins [67] | Policy-driven EV adoption | EV Registration per 100k population; Grid Emission Intensity (CO2/MWh); Rebate vs. Tax Credit effectiveness. | Technological Driver: Low-GHG energy sources (Renewable/Nuclear mix). Physical Enabler: Public charging infrastructure and urban public road share. | United States (panel data of 50 states) |
| Liu et al. [68] | EV policy combinations and market diffusion | Long-term vs. Short-term Elasticity Coefficients; Variance Decomposition of incentives; Gasoline Price impact. | Technological Driver: Public procurement (demonstration) and purchase tax exemptions. Physical Enabler: Charging network density and “Right of Way” privileges. | China (Monthly data analysis 2012–2020) |
| Konstantinou et al. [69] | Fiscal sustainability and revenue modeling | Annual EV Recovery Fee ($241–$342 for cars); VMT Fee ($/mile); Pay-as-you-charge Fee ($/kWh). | Technological Driver: Battery EV market penetration (EVMP) by class. Physical Enabler: Highway maintenance funding and road network preservation. | United States (Indiana case study, 2021–2035) |
| Li et al. [70] | Carbon regulation and consumer intent | Policy Effectiveness Coefficient (PCT vs. CT); Incentive Hierarchy (No purchase restriction > PCT/CT > Tax exemption). | Technological Driver: Battery Electric Vehicle (BEV) performance attributes (Range, Charging time). Physical Enabler: Carbon market mechanisms and charging discount infrastructure. | Nanjing, China (choice experiment) |
| Aboul-Atta & Elmaraghy [71] | Metro system performance and efficiency | Network Arterial Density; Punctuality & Speed; Environmental/Urban Expansion Synergy. | Technological Driver: Security and technical safety factors. Physical Enabler: Planning, environmental, and infrastructure arterial routes. | Global benchmarking (29 countries including China, Japan, UK, USA) |
| Kennedy et al. [72] | ESG transparency and greenwashing risk | Disclosure Guidance Compliance; Verifiable Evidence Ratio; Litigation/Reputational Risk index. | Technological Driver: Precise ESG reporting and data-backed sustainability claims. Physical Enabler: Objective and verifiable environmental practices. | South Africa/global (referencing UK, Japan, Germany) |
| Friman et al. [73] | Perceived accessibility and service quality | Functionality Index; Safety Perception Score (Information + Comfort); Perceived Accessibility (PAC) Scale. | Technological Driver: Real-time information and digital comfort features. Physical Enabler: Functional infrastructure and safe station design. | Northern European cities (Sweden, Norway, Denmark, Finland) |
| Rivero Gutiérrez et al. [74] | Multicriteria Fleet Evaluation (AHP-MCDM) | Economic Viability Index; Environmental Sustainability Score; Alternative Engine Efficiency (CNG vs. Electric). | Technological Driver: Plug-in Electric Vehicle (PEV) and CNG engine tech. Physical Enabler: Public road transport infrastructure and urban air quality management. | Madrid, Spain (2020 Data) |
| Afrin & Yodo [75] | Road traffic congestion measures | Level of Service (LoS); Congestion Indices; Travel Time Index (TTI); Speed Reduction Factor. | Technological Driver: Real-time traffic trackers and probabilistic prediction models. Physical Enabler: Road segment structure and resilient traffic management systems. | Global survey (applied to historical datasets) |
| Hosseinian & Mirzahossein [76] | Autonomous vehicle network efficiency and safety integration | Traffic Flow Optimization; Conflict Resolution rate; Road Capacity Utilization (distance maintenance). | Technological Driver: Advanced sensing and decision-making capabilities. Physical Enabler: Existing traffic systems and infrastructure adaptations. | Global literature review |
| Esperilla-Niño-de-Guzmán et al. [77] | Public–private partnerships in road infrastructure and sustainability | Financial Management Efficiency; Privatization Index; SDG Alignment (Goal 17); Cost-Pricing System accuracy. | Technological Driver: Financial modeling and sustainable construction technologies. Physical Enabler: Road construction, maintenance, and operational concessions. | Global bibliometric review (Scopus 1993–2022) |
| Nofal [41] | Predictive traffic management and time series analysis | Prediction Accuracy (98–99%); Traffic Status Classification (Low/Mild/High); Forecast Horizon (6-hour window). | Technological Driver: ML algorithms (Neural Networks, Gradient Boosting, SVM). Physical Enabler: Urban street network and historical traffic flow data. | Capital city (Amman, Jordan) |
| Sadaf et al. [78] | Autonomous vehicle ecosystem and digital trust | Threat Modeling Accuracy; Zero-Trust Architecture adoption rate; Digital Forensics readiness; Over-the-Air (OTA) update success rate. | Technological Driver: AI, Cloud Computing, and Blockchain-based security. Physical Enabler: Infrastructure sensors and solar power charging integration. | Global survey and technological review |
| Shi [79] | Connected infrastructure and resilience | Vehicle-to-Everything (V2X) penetration; Spatial/Temporal Data Coverage; Level of Service (LoS) enhancement. | Technological Driver: IoT, 5G, Edge Computing, and AI-driven decision support. Physical Enabler: Multi-functional, adaptive highway infrastructure and sensor-embedded pavements. | Global perspective (focus on cold-climate resilience) |
| Ahmed et al. [46] | Urban bikeability and infrastructure design | Bicycle Infrastructure Index (BII); Five Design Principles (Safety, Comfort, Attractiveness, Directness, Coherence). | Technological Driver: Digital mapping and weighting models (AHP, Linear Combination). Physical Enabler: Bike lanes, greenery/trees, parking facilities, and intersection density. | Global systematic review (15 primary studies) |
| Distefano & Leonardi [45] | Pedestrian satisfaction and walkability | Basic vs. Performance vs. Excitement Factors; Sidewalk Continuity Index; Obstacle-Free Path Rate. | Technological Driver: Demographic-sensitive urban modeling (Three-Factor Theory). Physical Enabler: Sidewalk width, surface condition, and intersection crossing ease. | European Union/Catania, Italy |
| Du et al. [80] | Vulnerable road user crash frequency and severity | Crash Frequency (RPNB model); Severity Odds (Binary Logit); On-road Cycleway Density. | Technological Driver: Integrated crash datasets and predictive macro/micro modeling. Physical Enabler: Urban arterial roads, light rail proximity, and green space intersection design. | Australian Capital Territory (ACT), Australia |
| Alawadi et al. [81] | Neighborhood integration and network centrality | Pedestrian Route Directness (PRD); Betweenness Centrality; Global vs. Local Integration ratio. | Technological Driver: Space syntax and graph-theoretic centrality analysis. Physical Enabler: Neighborhood Planning Units (NPUs), street-alley networks, and service cores. | Abu Dhabi, UAE (12 NPU network designs) |
| Pearce et al. [82] | Pedestrian vs. street network accessibility | Network Detour Ratio; Catchment Area Comparison; Dedicated Pedestrian Linkage (DPL) index. | Technological Driver: GIS-based network analysis comparing multi-modal layers. Physical Enabler: Pedestrian-only bridges, shortcuts, and “off-street” path connectivity. | Asian Cities (Osaka, Japan and Hong Kong) |
| Mastora et al. [83] | User conflict and interaction structure | Perceived Safety Score at crossings; Aggressive Behavior Index; Infrastructure Reliability perception. | Technological Driver: Latent variable and path modeling of user attitudes. Physical Enabler: Pedestrian crossings on bicycle lanes, surface coloring, and signage. | Thessaloniki, Greece (4.0 km seafront shared space) |
| Nikiforiadis et al. [84] | Shared Space Level of Service (LOS) | Quantitative-Qualitative Triangulation; Perceived Comfort/Safety vs. Physical Capacity; Context-Specific LOS adjustment. | Technological Driver: Multi-variable mathematical modeling and user perception quantification. Physical Enabler: Shared sidewalks, lighting, signage, and separation from motorized traffic. | Serres, Greece (urban shared paths) |
4.2. Future Mobility
4.2.1. KPIs for Autonomous Vehicles (AVs)
While literature on the international stage focuses on safety standards for and operational efficiency of AVs (Table 2) [52-54], the implementation of the same KPIs in the IKN context will require an adaptation of generic definitions. To obtain reliable technology, IKN must integrate its cybersecurity into local telecommunication infrastructures and comply with Indonesia's National Cyber and Crypto Agency (BSSN) protocols. Additionally, regulatory compliance (indicator No. 4, Table 2) has a unique barrier to overcome; current Indonesian traffic laws (UU No. 22/2009) do not yet address “driverless” entities as such. Consequently, the deployment of AVs in the Core Government Area requires a special lex specialist within the IKN authority's regulatory environment to close this gap. In contrast to other general conclusions [54] regarding the economic feasibility of AVs in the IKN zone, it is not simply about assessing the costs associated with deploying AVs, but rather a strategic imperative for the state to eliminate a major component of the civil service transportation subsidy that represents a significant burden on the state budget.
| No. | Indicators | References | Total |
|---|---|---|---|
| 1. | Safety standards and protocols | [52-54] | 3 |
| 2. | Technology reliability (cybersecurity measures) | [52-54] | 3 |
| 3. | Operational efficiency (fuel and route optimization) | [52-54] | 3 |
| 4. | Regulatory compliance and testing protocols | [52, 53] | 2 |
| 6. | Environmental impact | [52, 54] | 2 |
| 7. | Economic feasibility (cost-benefit analysis) | [52, 54] | 2 |
4.2.2. KPIs for Sustainable Transportation and Electrification
There is considerable alignment between the high levels of indicator data for reducing greenhouse gases through renewable energy sourcing (Table 3) and IKN’s commitment to being “net zero.” Nonetheless, to apply this to IKN requires an evaluation of Indonesia’s national energy sources. Though research has suggested that Shared Autonomous Electric Vehicles (SAEVs) are inherently environmentally sustainable [55-57], there is a need to evaluate the real-world environmental implications of SAEVs within East Kalimantan, based on the IKN Green Power Plant project. If a 100% switch from coal-fired electricity generation to planned renewable energy (i.e., solar and hydroelectric) does not occur, then the KPI for the “reduction of greenhouse gas emissions” will be at best superficial; it will fail to consider the upstream CO2 emissions embedded within Indonesia’s national electric grid (PLN).
| No. | Indicators | References | Total |
|---|---|---|---|
| 1. | Environment | ||
| Energy consumption of the SAEV fleet during operation. | [55-57] | 3 | |
| Reduction of greenhouse gas emissions and pollutants. | [55-58] | 4 | |
| Percentage of energy sourced from renewables. | [55-57] | 3 | |
| Environmental impact of the SAEV fleet. | [56, 57] | 2 | |
| 2. | Social | ||
| Accessibility: Availability of SAEV services. | [56, 58] | 2 | |
| Safety: Improvement in road safety. | [56, 58] | 2 | |
| User satisfaction: Level of user satisfaction with SAEV services. | [55, 56] | 2 | |
| Equity: Fair distribution of SAEV services. | [56, 58] | 2 | |
| 3. | Economic | ||
| Cost efficiency: Cost savings. | [55-58] | 4 | |
| Economic sustainability: Financial sustainability of SAEV operations. | [55, 56, 58] | 3 | |
| Job creation: Number of jobs generated through SAEV development and operations. | [56, 58] | 2 | |
| Impact on public transport: Effects of SAEV on existing public transport services. | [56, 57] | 2 | |
| 4. | Operational and Technical | ||
| Reliability: Reliability of SAEV services. | [55, 56, 58] | 3 | |
| Service efficiency: Efficiency of SAEV operations. | [55, 56, 58] | 3 | |
| Technology readiness: Readiness level of SAEV technology. | [55-58] | 4 | |
| Data security: Security of data collected and utilized by SAEVs. | [56, 58] | 2 | |
| Interoperability: Compatibility of SAEV technology. | [56-58] | 3 | |
| Innovation: Level of innovation in SAEV development. | [56, 58] | 2 | |
Transportation planners can benefit from using both system-wide strategies and spatial decision-making techniques. As an example, GIS and multi-criteria methods have been used extensively for site selection and infrastructure development [85]. Infrastructure availability, price, and user attitudes also affect the adoption of electric vehicles in developing nations like Indonesia [86]. Electrifying transportation will be a major factor in reducing CO2 emissions when it occurs in places with high travel volumes such as tourist areas [87], which suggests that future mobility systems are becoming increasingly complicated and dependent on large amounts of data. This increasing complexity demands more sophisticated intelligent methods such as those based on AI, to effectively merge physical infrastructure, user behavior, and sustainability objectives.
There are substantial real-world obstacles related to the equitable distribution of SAEV services from a social viewpoint, specifically related to the topography of the area designated as the Core Government Area. The SAEV service delivery areas will be unlike the highly structured and relatively flat city grid designs, which have been referenced in many European studies [58]. IKN’s “forest city” design will include elevation variations with multiple government cluster locations. This means that while the accessibility KPI will measure how easily SAEV fleets can access the zones due to tropical rainfall or steep slopes, SAEV fleet accessibility cannot be a hollow or non-representative social equity policy term; it must represent actual physical accessibility for all public employees and residents regardless of where they reside.
The economic KPIs, specifically “impact on public transport,” highlight an important institutional conflict in Indonesia. Although AV fleets may provide cost efficiency, they need to integrate with the current national strategy for public transportation. There is also a potential for the autonomous vehicle fleet to cannibalize ridership from the Bus Rapid Transit (BRT) and Light Rail Transit (LRT) services being built into IKN. Therefore, in order to apply these KPIs appropriately based on context, it would require a multimodal integration rating for SAEVs so that SAEVs can function as a first-mile solution, connecting at the 300-meter multifunction stations, rather than a private-tier service competing against the public transportation system and exacerbating socio-economic disparities.
The final two technical KPIs for “interoperability” and “data security” must therefore be evaluated through the lenses of the Indonesian Electronic Information and Transaction (ITE) law as well as the Indonesian Personal Data Protection (PDP) law. In terms of technology readiness at IKN, it is not merely a measure of how many vehicle sensor systems are available to support IKN but rather the readiness of the 5G V2X (vehicle-to-everything) communication system. Therefore, IKN will face a practical challenge related to data security because there are so many large real-time data sets that need to be managed and protected. As such, the effectiveness of IKN’s KPI system is dependent upon its establishment of an Institutional Security Protocol, which includes the National Cyber and Crypto Agency to ensure that when a security breach occurs on a national level, it does not cause disruption to the central core of all mobility within the capital city.
4.2.3. KPIs for MaaS
Market volume and readiness have been identified as the two most important pillars for the development of MaaS across multiple research studies (Table 4) [59-62]. When considering IKN, market readiness is considered beyond merely GDP or internet penetration. Since the initial population of IKN will largely be comprised of civil servant employees, both willingness-to-pay and adoption ratio of MaaS will likely be significantly influenced by the government allowance for travel and relocation incentives. An essential use of this KPI would be to correlate MaaS subscription rates with state budget allocations designated for official travel. This differs greatly from the market-based models used within European cities [59]; instead, MaaS within IKN should be viewed as a mandatory service replacing the state provision of individual cars for official business, thus assuring a steady market volume in phase one.
| No. | Indicators | References | Total |
|---|---|---|---|
| 1. | Collaboration | ||
| Market volume (total population, adoption ratio, population density). | [59-62] | 4 | |
| Market readiness (mobile internet penetration, willingness to pay, GDP). | [59-62] | 4 | |
| Data and business (willingness to collaborate and share data). | [59, 61, 62] | 3 | |
| Infrastructure and supply (availability, coverage, frequency and reliability, quality, mode distribution). | [59, 62] | 2 | |
| 2. | Technology | ||
| Ticketing (availability, e-ticketing, validation). | [59, 60, 62] | 3 | |
| Routing (availability, vehicle position, dynamic information, dynamic planning, convenience). | [59, 60, 62] | 3 | |
| Booking (availability, registration, price information, reservation). | [59, 60, 62] | 3 | |
| Payment (availability, types, operations, discounts). | [59, 60, 62] | 3 | |
| Navigation (positioning, alerts). | [59, 60, 62] | 3 | |
| 3. | Policy | ||
| Past experience (multimodal experience, collaboration, cross-border projects). | [59, 62] | 2 | |
| Administration (strategic documents, action plans, legislation, and regulations). | [59, 62] | 2 | |
The “data and business” indicator presents an institutionally-based obstacle that exists due to the existing “silo” nature of the Indonesian culture. In order to have “the willingness to collaborate and share data,” IKN will need to be able to cross cultural boundaries created historically between state-owned transportation providers (PT KAI for rail; DAMRI for buses) and private ride-hailing companies such as Gojek or Grab. A successful achievement of this KPI requires a successful integration of proprietary Application Programming Interfaces (APIs) from ride-hailing and other service-providing companies into a single national security-cleared backbone to support the implementation of “One Data Indonesia” (Satu Data Indonesia) under the IKN authority.
Technological aspects, including ticketing, booking, and payment indicators, need to be evaluated using today's Indonesian digital payments environment. While globally MaaS systems utilize unified accounts based upon credit [60, 62], IKN needs to use Indonesia's high penetration rate of QRIS (Quick Response Code Indonesian Standard) as well as interoperability among state-owned bank wallet applications. The biggest operational problem will be “navigation” and “routing” indicators through a “forest city” where the geographic location of the supply can be spread out over the physical city. In order to achieve IKN's 10-minute city objective, the MaaS algorithms used will have to be modified from traditional urban routing. It has to be able to account for IKN's unique multi-level pedestrian bridges as well as its tropical climate and provide dynamic information that takes into consideration delays caused by heavy monsoon rains, often omitted in the general literature.
The “policy” sub-dimension may have the biggest research gap. References [59, 62] note “strategic documents”; however, for IKN, they require an actual legal specialist. In Indonesia, the current Transportation Law (UU No. 22/2009) classifies vehicles in traditional categories and does not recognize “platform operator” as a legitimate entity in public transit; therefore, the “administration” KPI in IKN could measure how fast IKN authority can create local regulations to allow MaaS to be used as a main mode of transport, thus circumventing the bureaucratic resistance to MaaS use seen in Jakarta and all other major metropolitan areas in Indonesia.
4.2.4. KPIs for ICT
The majority of studies [63-66] have identified improvement in operational efficiency as being most important (Table 5). Operational efficiency has been defined in terms of two primary indicators: service speed and travel time. However, operational efficiency will need to include “real-time” hydrologic and meteorological input into its analysis due to the unique and extreme microclimate conditions present in both the “sponge city” and “forest city” topographic designs of IKN, and the fact that the climate can rapidly alter these two critical indicators. Additionally, an ICT system that fails to integrate traffic flow data with real-time automated drainage sensor information or landslide monitoring information on the extremely hilly terrain of East Kalimantan will be unable to meet the reliability standards required for a world-class capital.
| No. | Indicators | References | Total |
|---|---|---|---|
| 1. | Improvement in operational efficiency (travel time, fleet utilization, and service speed). | [63-66] | 4 |
| 2. | Reduction in time and costs (delay time, operational costs, and driver productivity). | [63, 66] | 2 |
| 3. | Enhancement of safety (number of accidents, injury and fatality rates, and emergency response time). | [64, 65] | 2 |
| 4. | Increase in comfort and user satisfaction (passenger satisfaction level, transportation services, ease of access to information, and service reliability). | [64, 66] | 2 |
| 5. | Environmental impact (greenhouse gas emissions, energy consumption, and promotion of green transportation). | [63, 65, 66] | 3 |
| 6. | Enhancement of infrastructure capacity (infrastructure utilization, carrying capacity, and infrastructure availability). | [63, 66] | 2 |
The “safety enhancement” indicator must be reviewed through IKN’s CCC (Command & Control Center) architecture. Although studies [64, 65] provide some generalized comments about “safety,” the real-world challenge for IKN is to address the latency issues associated with V2X communications. With an emphasis on a city's use of autonomous and electric fleets, as stated above, the “number of accidents,” which is used as a lagging indicator of the level of success in achieving this objective, needs to be replaced by the predictive intervention rate of the system. A critical aspect of realizing this vision will involve aligning the technology platform with Indonesia’s National Cyber and Crypto Agency, so that the ICT backbone is able to withstand cyber-physical attacks on the transportation grid, an attack vector that is significantly amplified when operating within a highly secure administrative and government center containing numerous diplomatic functions.
Further still, the “environmental impact” of ICT itself as an area of concern is rarely discussed within the literature regarding ICT generally [65, 66]. The large amounts of data processing associated with the use of real-time analytics and autonomous fleet management require significant energy; therefore, when aiming to achieve the “net zero” target for the first time ever, the KPI for “energy consumption” will have to take into consideration the efficiency of the data centers providing power to the software for the city's transport system. As part of the overall assessment of whether or not the ICT infrastructure uses cooling systems with high levels of greenhouse gas emissions, this could potentially reduce the positive carbon gains resulting from the transition to electric vehicles. Therefore, it is crucial that measurements be taken to determine how much each byte of data processed for mobility reduces urban emissions, thereby providing evidence that IKN has effectively utilized a “green bit” ratio.
Finally, the “enhancement of infrastructure capacity” (indicator No. 6, Table 5) addresses concerns about an institution's institutional capability. Since a study [63], for example, deals with “capacity for carrying,” the IKN requires a focus on the use of digital twins. The primary issue is integrating BIM with the city's traffic management system. Therefore, the success of this KPI for IKN will depend upon their ability to transition from simply measuring static levels of infrastructure available to assessing dynamic levels of infrastructure usage. In other words, they need to use ICT to transform existing street space into temporary parking lots or to modify public transportation routes in anticipation of increased demand due to major government functions or state visits.
4.2.5. KPIs for Policy Consideration
While there is considerable consensus about tax breaks for electric vehicles and subsidies for the cost of charging them (Table 6), in order to determine the effectiveness of these incentives at promoting the use of EVs within IKN, they need to be evaluated relative to Indonesia's “forest city” policy and the directives contained within Law No. 3 of 2022. To date, the government has relied upon the authority granted under Minister of Home Affairs Regulation No. 6/2023 regarding motor vehicle tax breaks as a crucial factor for EV use; therefore, if IKN is going to succeed as an initial pilot smart city, it will be necessary to decouple these incentives from those of the regional tax structure governing Jakarta.
The subsidies for EV charging rates (indicator No. 2, Table 6) illustrate an important relationship between the technology being ready to use and a country's energy policy. Although the Minister of Energy and Mineral Resources Regulation No. 13/2020 reduces the EV charging rates by 30% during off-peak hours, it is the effectiveness of the smart grid system in the IKN that ultimately determines how effective this regulation can be. In other words, unlike general urban applications referenced in prior research studies [67, 68], all of the charging stations in IKN will be 100% powered from renewable energy sources. Thus, the relative importance of the subsidy KPI will have to measure not just the amount of money reduced through the subsidy, but also source transparency, assuring that the subsidy is directly related to the renewable energy consumption.
In addition, the subsidies offered by way of the motor vehicle purchase subsidy (indicator No. 3), as established by the Ministry of Finance Regulation No. 38/PMK.010/2023, up to IDR 80 million, need to have an impact assessment related to social equity. As stated in the studies [55, 70], the distribution of services through subsidies must be equitable. In the case of IKN's initial stages of development, there exists a danger that these types of subsidies are going to be used primarily by higher-income residents or private vehicles. Therefore, it may be contradictory to IKN's “pedestrians and public transport first” policy. To overcome this issue, IKN's KPIs need to emphasize fleet-based subsidies over individual-based subsidies and direct funding toward the SAEV and MaaS operators. Thus, the state budget can support mass mobility, instead of supporting the private EV owner who will create a smart version of the current congestion-overwhelming Jakarta.
4.3. Capital City Connectivity
4.3.1. KPIs for Public Transport Connectivity
The high consensus on service quality, sustainability, and technology adoption (Table 7) must be viewed with a critical eye due to the extreme climate of IKN's “forest city”. Unlike globally published research, which measures quality as general customer satisfaction [71, 72], it is necessary to view the quality of service from a specific point of view (i.e., thermal comfort) for an extremely humid and hot environment such as IKN. A socio-technical trade-off is also present when measuring the success of sustainability: a balance between the energy required to cool electric buses (to keep them comfortable in high temperatures) and meeting zero-emission requirements. The system must meet the criteria for providing a “cool corridor” public transportation experience that attracts people to use public transportation instead of using their own, cooler, air-conditioned automobiles. This criterion has been overlooked in most standard urban planning models.
| No. | Indicators | References | Total |
|---|---|---|---|
| 1. | Affordability and accessibility | [71-73] | 3 |
| 2. | Service frequency and punctuality | [71, 73, 74] | 3 |
| 3. | Capacity and density in meeting demand | [71, 73] | 2 |
| 4. | Service quality (comfort and safety) | [71-74] | 4 |
| 5. | Sustainability and environmental friendliness | [71-74] | 4 |
| 6. | Integration between transport modes | [71, 73, 74] | 3 |
| 7. | Technology adoption (real-time information) | [71-74] | 4 |
The success of achieving the 10-minute city depends upon the spatial and institutional dimensions of both “integration between transportation modes” and “service frequency”. The integrated transport network described in the IKN Master Plan must physically connect the planned land-based BRT system to the planned rail and water-based transport systems detailed in the Nusantara Smart City Blueprint. Punctuality cannot be ensured through the use of static schedules, but through the “technology adoption” (indicator No. 7) of using artificial intelligence to prioritize traffic signal control to ensure public transit has priority over private vehicles for the duration of the city's growth phase.
Ultimately, “capacity” and “affordability” (indicators No. 3 and 1) have to be continually adjusted according to the dynamic needs of an administrative city. In contrast to typical steady-state demand models [71, 73], IKN will experience large-scale spikes in demand at times of state-related activities and parliament. Therefore, the infrastructure capacity has to take into account the system elasticity, the capacity to increase vehicle frequency through self-supporting autonomous reinforcement. With regards to affordability, it seems from initial estimates of civil servant and worker populations that IKN's success depends more on the nature of subsidies as opposed to competitive pricing. A practical issue facing the IKN authority is to implement a Universal Basic Mobility model, ensuring access is not limited by the digital divide when combined with the MaaS platforms.
4.3.2. KPIs for Private Vehicle Connectivity
The inclusion of private vehicle connectivity into the IKN framework indicates an understanding that even though a transit-orientated “smart forest city” will have a significant level of efficient and safe layout (indicator No. 1, Table 8) to allow for logistical and emergency service operations; there needs to be a base-level of private vehicle efficiency to allow for frictionless travel to offices and other facilities [75-77]. The high consensus among references to clear road usage and connectivity is indicative that private vehicle efficiency in IKN is intended to ensure that important travel to and from offices and facilities continues to operate without hindrance, rather than encouraging car dependence. Within the context of the Core Government Area, this indicator must be viewed through the prism of managed access. Private vehicle flow management in IKN would therefore be achieved using ANPR and smart parking technologies cited in the literature, to manage congestion levels so as not to compromise the 80% public transportation target.
| No. | Indicators | References | Total |
|---|---|---|---|
| 1. | Efficient and safe layout (availability and quality of road infrastructure, road conditions and maintenance, parking availability, presence of express lanes or toll roads) | [75-79] | 5 |
| 2. | Clear road usage (travel time and congestion, efficiency of private vehicles in moving from one point to another without traffic jams) | [41, 75-79] | 6 |
| 3. | Connectivity and accessibility (ease of access to essential facilities such as schools, offices, shopping centers, etc.) | [41, 75-79] | 6 |
| 4. | Environmentally and user-friendly design (operational costs including fuel, maintenance, and road usage fees) | [41, 75, 77-79] | 5 |
An implementation challenge specific to connectivity and accessibility (indicator No. 3) relates to physically integrating the existing road network into the green and blue zones of IKN. Although literature [41, 79] states how easy it is to gain access to shopping centers and schools, IKN's zone-based approach requires private vehicle infrastructure that takes into account the sponge city drainage constraints. Conventional asphalt surfaces require balancing against permeable surface types if land subsidence such as those experienced in Jakarta are to be avoided [4]; therefore the “safe layout” indicator could be weighted according to environmental or user friendly design; where road infrastructure is assessed based upon its throughput as well as Low Impact Development (LID) characteristics and capacity to mitigate the urban heat island effects within the forest canopy.
Lastly, operational costs under environmentally friendly design (indicator No. 4) must align with Indonesia's fiscal policies related to IKN. To avoid the overdependence demonstrated throughout Jakarta's past [3], the cost of utilizing private vehicles in IKN must be proactively managed using Electronic Road Pricing (ERP) or smart parking fees, which demonstrate the real ecological impact of driving a car. With private vehicle connectivity being made “efficient but expensive”, compared to subsidized public transportation and MaaS options, IKN will meet the sustainability objectives stated in the blueprint. And thus, although the quality of road infrastructure will be good, its primary function will be to act as a secondary layer, with flexibility, supporting the robust, sustainable transit system at the heart of IKN.
4.3.3. KPIs for Pedestrian and Cyclist Connectivity
As indicated by the high consensus across the various studies examined, active transportation in IKN will require a great deal of geometric accuracy to achieve the goals of this project. For example, the PRD (indicator No. 4, Table 9) is key to meeting the “10-minute city” mandate. Thus, unlike the fractured sidewalks of Jakarta that create lengthy detours for pedestrians, IKN's street plan should emphasize “directness” by having pedestrian paths be significantly shorter than those used by motorized vehicles. A primary implementation challenge for maintaining this directness throughout IKN's hilly terrain lies in calculating the PRD, not simply in terms of two-dimensional distances but also in terms of effort-weighted distances. This calculation would account for elevation differences that may discourage walking and cycling in East Kalimantan.
| No. | Indicators | References | Total |
|---|---|---|---|
| 1. | Block length and size | [45, 46, 80-84] | 7 |
| 2. | Intersection and road density | [45, 46, 80-84] | 7 |
| 3. | Connected-Node Ratio (CNR) | [46, 80-84] | 6 |
| 4. | Pedestrian Route Directness (PRD) | [45, 46, 80-84] | 7 |
| 5. | Bicycle lanes | [45, 46, 80, 82-84] | 6 |
| 6. | Separation of bicycle lanes, pedestrian pathways, and motorized vehicles | [46, 80, 82-84] | 5 |
In contrast to block length/size and intersection density (indicators No. 1 and 2), focusing on controlling urban sprawl, studies agree that smaller blocks allow for higher levels of permeability (“route choice”) and therefore make a city more walkable [45, 46, 80-84]. As part of IKN's “forest city” concept, such short blocks should then include “green belts” and “blue corridors” to provide natural shading to lower the ambient temperature for pedestrians. Finally, as an important KPI for assessing the resilience of the active transport network, the CNR (indicator No. 3) is a measure used by the IKN authority to assess how well a given disruption to one segment of a pathway can be replaced by an alternative “node”. An adequate number of connected nodes would ensure the continued flow of people through the area, even when a particular segment is disrupted by regular maintenance or heavy rain.
Ultimately, a fundamental requirement for behavior change is creating a clear distinction between bicycle or pedestrian pathways and motorized traffic (indicator No. 6). While several studies [46, 80, 82-84] identify separation as a safety measure, for IKN, separating these modes of transportation from each other creates a socio-technical transformation that places a greater priority on vulnerable users. Such separation must be physically created using green buffers or elevation, rather than merely as a paint line, which has consistently failed to protect against motorized traffic in other Indonesian cities. If IKN successfully maintains coherence and protection around its designated bicycle lanes (indicator No. 5), then it could succeed in becoming a world-class city that provides equal access to all residents and employees for active mobility.
4.4. Comparative Synthesis of KPI Domain Prevalence
Figure 3 presents the hierarchy of levels of intensity of the research undertaken on the different identified KPIs, showing that both pedestrian and cyclist connectivity, as well as private vehicle connectivity, have the highest rates of occurrence within the literature examined. The hierarchy indicates that there is evidence for all three dimensions (socio-material, policy, and future mobility) of the framework; however, the socio-material base of urban movement appears to be the most empirically validated component of the framework, thereby establishing the fundamental physical infrastructure from which higher-order intelligent transportation systems can operate.
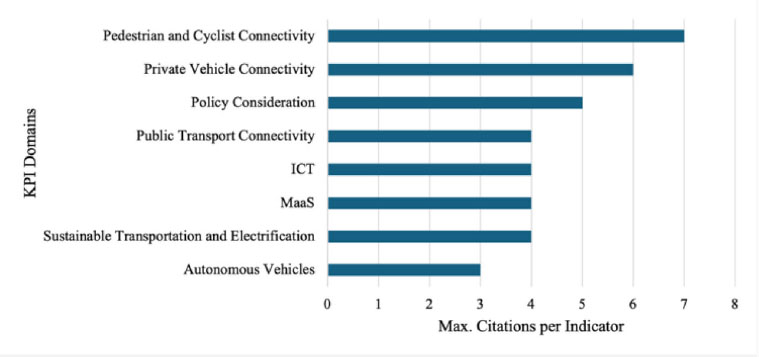
Prevalence of literature references across identified KPI domains based on maximum citation frequency per indicator.
As an intermediary layer, policy has been placed at the median level, indicating that it serves as a socio-technical bridge that enables the translation of technological aspiration into formalized regulation. In comparison, drivers of future mobility (i.e., MaaS, ICT, and electrification), although consistently occurring at a slightly lower rate than the traditional forms of connectivity, appear to be in a transitional phase as they are becoming incorporated into the existing physical grid. A lower rate of research in relation to autonomous vehicles suggests that this domain, although a crucial part of the overall IKN vision, represents the least developed technological area to date.
CONCLUSION AND LIMITATIONS
The establishment of a multidimensional KPI framework provides a vital evaluation tool for bridging the gap between IKN’s high-tech mobility aspirations and its physical “forest city” requirements. The findings imply that while technological drivers like MaaS and autonomous systems are essential for modernity, the city’s immediate resilience depends on the integration of these digital layers with robust physical enablers and a context-specific regulatory backbone. These results suggest that for the IKN authority to achieve its public transport target, policy focus must shift from general fiscal incentives toward localized, fleet-based strategies that prioritize multimodal seamlessness over private vehicle ownership. Finally, this framework serves as a strategic roadmap for policymakers to monitor the transition from a greenfield site to a responsive, socio-technical urban ecosystem that is both ecologically sustainable and operationally efficient.
Although the synthesized KPI framework developed within this study presents an overarching perspective on a wide range of aspects associated with IKN, this research also has several limitations that need to be taken into consideration. The first limitation is that due to the fact that the IKN project is in its early stages of development, the majority of the indicators identified in this study are based upon an extensive literature search of available studies on other urban areas around the world as well as information contained in IKN’s master plans, and have not been validated empirically using longitudinal data collected at the actual location of IKN. Thus, because the indicators were generated by theoretical models or secondary data sources, they may fail to capture unexpected site-specific engineering issues that could arise during construction or unforeseen changes in social or cultural dynamics that may occur once government employees and inhabitants begin to occupy buildings located in the Core Government Area. In addition, since “future mobility” technology continues to evolve rapidly, such as AVs’ operational readiness levels and 5G V2X infrastructures’ technical capabilities, some indicators included in the synthesized KPI framework may require updates to remain valid. Therefore, future studies should focus on validating empirically the indicators used in this study via pilot studies conducted in IKN and include input from stakeholders who reside in the vicinity of IKN to adjust the weighting and application of those indicators.
AUTHORS’ CONTRIBUTIONS
The authors confirm their contributions to the paper as follows: W.N.: Methodology development, investigation, formal analysis, and writing – original draft; S.H.T.U.: Conceptualization, writing – review and editing, and supervision; M.Z.I.: Visualization, writing – review and editing, and supervision. All authors reviewed the results and approved the final version of the manuscript.
LIST OF ABBREVIATIONS
| IKN | = Ibu Kota Nusantara (Nusantara Capital City) |
| TOD | = Transit-Oriented Development |
| MRT | = Mass Rapid Transit |
| MaaS | = Mobility-as-a-Service |
| SUMP | = Sustainable Urban Mobility Plan |
| KPIs | = Key Performance Indicators |
| ITS | = Intelligent Transportation Systems |
| BIM | = Building Information Modeling |
| GIS | = Geographic Information Systems |
| AVs | = Autonomous Vehicles |
| ICT | = Information and Communication Technologies |
| ANPR | = Automated Number Plate Recognition |
| SAEVs | = Shared Autonomous Electric Vehicles |
| BRT | = Bus Rapid Transit |
| LRT | = Light Rail Transit |
| GDP | = Gross Domestic Product |
| APIs | = Application Programming Interfaces |
| EVs | = Electric Vehicles |
| BEV | = Battery Electric Vehicles |
| IDR | = Indonesian Rupiah |
| QRIS | = Quick Response Code Indonesian Standard |
| LID | = Low Impact Development |
| ERP | = Electronic Road Pricing |
| CNR | = Connected-Node Ratio |
| PRD | = Pedestrian Route Directness |
AVAILABILITY OF DATA AND MATERIALS
The data supporting the findings of the article are available in The Open Science Framework (OSF) at https://doi.org/10.17605/OSF.IO/BPSYG.
ACKNOWLEDGEMENTS
Declared none.