All published articles of this journal are available on ScienceDirect.

Impact of Integrated Multimodal Traveler Information on Auto Commuter’s Mode Switching Propensity
Abstract
Aim:
Real-time traveler information affects auto commuter’s travel behavior.
Method:
An ordered probit model is used to analyze auto commuter’s mode switching propensity under influence of simulated real-time multimodal traveler information. A travel preference survey is administered to car drivers to gather individual commuter’s travel decisions under integrated multimodal traveler information.
Result:
It is shown that integrated multimodal traveler information can influence willingness of car drivers to switch mode of travel, while socio-economic characteristics also influence the mode choice decision.
1. INTRODUCTION
The provision of real-time traveler information (both pre-trip and en-route) can influence motorist’s travel behavior, e.g. route, mode, and departure time choices, which directly affects the network flow conditions. Thus, understanding the motorist’s travel behavior dynamics in response to traveler information facilitates the determination of how travel demand may distribute over the entire network [1, 2].
The significant development of Advanced Traveler Information System (ATIS) could provide travellers’ accurate location-specific traffic information. For example, the application of the A* algorithm using the decremental approach can reduce the network size and speed-up the optimization process in dynamic shortest path problems, which could support the dynamic (time-dependent) network routing using ATIS [3]. Many studies have been published that investigated the influence of real-time traveler information on traveler’s behavior. One major group of studies used logit model to analyze the effect of providing traffic information to travelers on their route choices [4-7]. Yet, another group of studies aimed to check the effect of providing traffic information to travelers on their mode choices. Deployment of Integrated Transport Information System (ITIS) which aims at maintaining the dwindling users, through the high quality information delivery, can therefore attract potential ones to public transport [8, 9]. Recently, researchers have also investigated the possible influence of smartphone on mode or route choice [10-12]. Researchers have suggested that presentation of a number of modal options for a journey in response to a single enquiry could challenge previous perceptions of the utility of non-car modes, overcoming habitual and psychological barriers to consideration of alternative modes. Where the information presented incorporates comfort and convenience factors, in addition to cost and duration, it may challenge travelers’ concerns about alternative modes and could persuade a modal change [13]. However, the impacts of real-time traveler information on commuter’s mode choices have not been modeled in a way that enables estimation of the mode switching propensity of commuters - the practical side of modeling of travel behavior in integrated multimodal transportation systems. Thus, the effects of real-time integrated traveler information on commuter’s mode choice behavior in a multimodal environment have not been well established.
Furthermore, in most studies, the impacts of traveler information were observed by providing mode-specific information to designated mode users, e.g. the impacts of ATIS were analyzed by providing traveler information regarding the private modes to private mode users only. In such a framework, where the information is provided for specific modes only, the possibility to study the car driver’s mode choice behavior is very limited [14-16]. Considering the existing multimodal nature of transportation systems, e.g. in urban metropolises like Singapore, where the availability of different modes and the provision of integrated traveler information allow the commuters to plan their trips by integrating different modes or to choose between public and private modes of travel, it becomes necessary to study the commuter’s mode choice behavior [17]. As such, this research sets out to explore a more efficient way to estimate the effects of integrated multimodal traveler information, given by an information system like AMTIS (Advanced Multimodal Traveler Information Systems), on commuter’s mode choice behavior and how it quantitatively affects the transport network [18, 19].
The contribution of this paper to literature lies in the presentation of travel preference survey approach [12] allowing for data collection concerning: (i) the making of travel choices in a multimodal travel environment, (ii) the acquisition of several types of travel information, and (iii) the effect of received information on mode choices [16]. This paper aims to understand auto commuters’ travel preference towards mode and/or mode switching decision under integrated traveler information in a multimodal transportation network. The results of this study can provide important foundations that help the operations of a multimodal transportation system to regulate the travel demand based on the provision of real-time integrated multimodal traveler information. The following sections are organized as follows: travel behavior survey and preliminary analysis are briefly described in Section 2. In Section 3, the auto commuter’s mode switching propensity is analyzed. Lastly, a conclusion is given in Section 4.
2. SURVEY METHOD
A computer-assisted preference survey on integrated traveler information was conducted in Singapore, where multimodal traveler information was made available at the start of the study. Similar approach has been suggested by other researchers where they have advised that the preference survey experiments should be collected together with baseline survey data [12], so as to capture the effect of inertia between preference and baseline choice data. The participants were contacted by the interviewers at various locations such as petrol stations, car parks and food centers, where the selected participants were required to have valid driving license, and commute regularly by auto mode of transport. The survey instrument was designed and developed using Visual Basic and Microsoft Access. Surveyors were assigned to different locations within Singapore to collect data with portable computer notebooks. Available data were collected from a total number of 479 respondents.
This survey consists of four components: commuters’ general information part, commuters’ daily trip pattern survey part, baseline survey part and preference survey part. The commuters’ general information part is aimed at gathering commuters’ socio-economic and travel characteristics, their knowledge/experience about actual scenarios reflecting different levels of congestion, and available traveler information options. This part was divided into four groups in which information about auto commuter’s socio-economic characteristics, usual trip preferences, availability and usage of public and private modes was collected. The commuters’ socio-economic characteristics were surveyed in order to observe the impact of these characteristics on commuters’ travel choice preferences, including: age, gender, education, occupation, personal income, household income, household size, postcode, marital status and type of vehicle owned [20]. Age was divided into four groups of 18 to 35, 36 to 45, 46 to 55, and above 55 years. Gender was a binary variable, corresponding to two groups i.e. males and females. Education was divided into four groups of pre-university and below, bachelors, masters, and PhD degrees. The occupational categories considered were: student, academics, administrative, technical, professional, house-wife, and retired. Personal monthly income was divided into five groups of S$1500 (US$ 990) or less, S$1501 (Us$ 991) to S$3000 (US$ 4530), S$3001 (US$ 4531) to S$6000 (US$ 9060), S$6001 (US$ 9061) to S$12000 (US$ 18120), and S$12001(US$ 18121) or above. Household monthly income was grouped into six categories of S$2000 or less, S$2001 to S$4000, S$4001 to S$6000, S$6001 to S$8000, S$8001 to S$10000, and S$10001 or above. Marital status was a binary variable i.e. married and unmarried. The available options for types of vehicle ownership were car, van, and small truck.
In the commuters’ daily trip pattern survey part, work/school trips were considered because these trips are not discretionary and are usually made during the peak hours. Special consideration was given to capture the effects of the attributes that can influence the commuters’ choice behaviour or have time and/or cost-related association. The trip variables provided knowledge about origin zone, destination zone, usual mode of transport, trip start time, acceptable delay, access to traveller information, and types of traveller information accessed. The information about availability of private mode option in the existing situation included total journey time, Electronic Road Pricing (ERP) charges, type of parking place (private or public), time required to find a parking place, parking charges, access and egress time to parking place, stoppage during the trip, nature of stoppage, and congestion experience. Meanwhile, information about the public mode option for work/school trips was MRT, Bus, and Bus+MRT, which prevail in the existing transportation system of Singapore. The information was collected regarding access time, access cost, egress time, egress cost, travel time, travel cost, total waiting time, number of transfers, and level of satisfaction. The information gathered in this part was then presented in the baseline survey part and the preference survey part. This approach resulted in creating realistic preference scenarios which can be conceptualized by the car driver commuters as they reflect on certain parameters existing in actual situations.
The baseline survey part is to investigate the original mode choice decisions. A congested work/school trip with information on several travel options was administered and the respondents were given a choice between private car on expressway, public rail transit, and their usual choices of transport (no inclination to make a choice for the latter). To further explore the auto commuter’s mode switching propensity in congested environment, the preference survey part was presented and the likelihood of changing their previous decision (i.e. their decision in baseline survey) was examined. The auto commuters in preference survey were presented with the same situation as in baseline survey, but with provision of integrated traveler information on public and private modes of transport. The integrated information was provided by comparing the value of time and cost saving for each mode of transport. The total travel cost and travel time remained the same as baseline survey, and additional information was also provided in preference survey regarding: fuel cost, Electronic Road Pricing (ERP) charges, parking fees for cars, access time, waiting time and seat availability for public mode of transport. The auto commuters were then asked to indicate their preferences regarding their willingness to change their previous mode decisions upon the provision of integrated traveler information.
3. COMMUTER’S MODE SWITCHING PROPENSITY
In order to extend the study on the impact of integrated traveler information on car driver commuter’s mode choice behavior, it is necessary to identify whether the integrated traveler information can influence car driver commuter’s willingness to switch their model of travel in congested road environment or not. Using the data obtained in the baseline survey, analysis results show that there is a potential for integrated multimodal traveler information to influence car driver commuters mode switching propensity from private to public mode of transport.
Due to the ordering of the choices in the preference survey, an ordered probit model was considered appropriate. Thus, an ordered probit model (Y*i = Xi β + ϵi), where “Y*” is the exact but unobserved dependent variable, “X” is the vector of independent variables, and “β” is the vector of regression coefficients which we wish to estimate plus a disturbance term “ϵ” that has a standard Normal distribution) was estimated to analyze the auto commuter’s mode switching propensity under the influence of integrated multimodal traveller information. The socio-economic variables taken into consideration were gender, age, level of education, and level of income. The mass rapid transit (MRT) which is the railway system spanning the entire island state represents the public transit transport in the survey. The transport facility characteristics were in access mode to MRT station (0 if the mode was walk and 1 if the mode was feeder bus), access time from home to the nearest MRT station, waiting time, seat availability (1 if the seat was available, else 0), travel time difference between private and public modes of transport, and travel cost difference between private and public modes of transport.
The estimated ordered probit model is presented in Table 1. The estimated model has a lower absolute log-likelihood at convergence, which makes it a better model from the statistical point of view. All the estimated variables are significant at 10% significance level. The results show that auto commuters would be willing to switch their mode of travel if they are given comparative (integrated) information. For example, if the given information provides the comparison on the time saving by public mode, then the increase in time saving by public mode can increase the auto commuter’s willingness to switch their mode from private to public. Similarly, the increase in cost saving can also enhance the willingness of auto commuters to switch their mode of travel.
| Socio-Economic Characteristics | Coefficients(β) | Exp(β) | P-value | t-Statistics | |
|---|---|---|---|---|---|
| Constant | 2.435 | 0.002 | 2.991 | ||
| Gender | 0.814 | 2.256 | 0.006 | 3.434 | |
| Age | 0.346 | 1.413 | 0.030 | 2.160 | |
| Level of education | 0.291 | 1.337 | 0.048 | 1.974 | |
| Level of income | -0.251 | 0.778 | 0.066 | -1.838 | |
| Transport Facility Attributes | Coefficients(β) | Exp(β) | P-value | t-Statistics | |
| Access mode to MRT station | -0.45 | 0.637 | 0.089 | -1.701 | |
| Access time to MRT station | -0.513 | 0.598 | 0.006 | -3.42 | |
| Waiting time at MRT station | -0.139 | 0.87 | 0.066 | -1.832 | |
| Seat availability | 1.479 | 1.614 | 0.695 | 1.815 | |
| Travel time difference (min) | 0.158 | 1.171 | 0.025 | 2.229 | |
| Travel cost difference(S$) | 0.13 | 1.138 | 0.100 | 1.641 | |
| Threshold Parameters for Index | Coefficients(β) | P-value | t-Statistics | ||
| μ1 | 1.512 | 0.000 | 5.015 | ||
| μ2 | 2.812 | 0.000 | 7.968 | ||
| μ3 | 4.1 | 0.000 | 8.935 | ||
| Summary Statistics | |||||
| Number of observations | 360 | ||||
| Log likelihood function | -127.22 | ||||
| Restricted log likelihood | -175.6669 | ||||
| Degrees of freedom | 350 | ||||
| χ2 | 96.88975 | ||||
| ρ2 | 0.274 | ||||
From the results, information of public transport facility on access mode, access time, and seat availability has significant influence on the auto commuter’s mode switching propensity. If the MRT station is within walking distance (i.e. less access time value) and auto commuters are informed that they would get a seat in the MRT, then they would be more willing to switch their mode of travel. Walking mode to MRT station increases the probability of using transit. The information regarding waiting time at MRT station also influences auto commuter’s willingness to change their usual modes of travel. Commuters prefer lower waiting times whereas higher waiting times can reduce their willingness to switch their mode from private to public mode of transport.
3.1. Marginal Effect of the Estimated Probit Variables
The marginal effect of any variable can be interpreted as the expected change in the odds of belonging to any category of the dependent variable. In this case, it is equivalent to the willingness to change their usual mode of travel, which has five categories i.e. “Absolutely will not change”, “Will not change”, “Neutral”, “Will change” and “Will absolutely change”, with an order of 0, 1, 2, 3, and 4, respectively. The expected change in the odds is the multiplicative effect of the exponential value of estimated coefficient i.e. exp(β), given a unit change in the variable under consideration. By examining the estimated socio-economic variables, it can be observed that the probit estimate for a variable i.e. “gender” is 0.814, and the corresponding effect of odds after taking exponentiation of the probit estimate is 2.256. Thus, other things (i.e. all other probit estimates) being equal yet allow the effect of “gender” on the odds as is of 2.256. Hence, this marginal effect suggests that the odds for males to be in category 4 “Will absolutely change” instead of category 3 “Will change” are about 2.256 times higher as compared to females. Similarly, the odds for the males to be in category 3 “Will change” instead of category 2 “Neutral” are about 2.256 times as high as commuters who are females.
The effect of the level of income can be interpreted in a similar way. The probit estimate for level of income is -0.251, and the corresponding effect of odds after taking exponentiation is 0.778. Other things being equal, the odds of being in category 4 “Will absolutely change” versus category 3 “Will change” would be increasing by 0.778 times with each unit increase in the level of income. By observing the transport facility attributes, it can be concluded that the marginal effect of waiting time at MRT station (i.e. 0.87) is higher than that of the access time to MRT station (i.e. 0.598). Similarly, the marginal effect of travel time difference (i.e. 1.171) is more effective than the marginal effect of cost difference (i.e. 1.138). This interpretation provides a naive method of evaluating the marginal effects on the choice variable, because it estimates a linear growth for each category, though in reality, it may not be accurate.
3.2. Predicted Probabilities based on Explanatory Variables
To have a better understanding of the marginal effects on the expected change in the odds of belonging to any category of the dependent variable, the predicted probability for a given set of values of the estimated variables is computed. The predicted probability with respect to any variable can be computed as [21]:
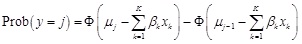 |
(1) |
where “y” is the stated choice falling in “J” number of ordered categories, “Φ(•)” gives the standard normal cumulative probability, “μ” is the threshold parameter separating the adjacent categories, “β” is the parameter estimate for the interaction term, and “xh” is the kth variable involved in the interaction.
To facilitate the interpretation, all the predicted probabilities at different levels of the access time, waiting time, travel time difference, and cost difference are estimated based on this equation. During the estimation of predicted probabilities, all the other variables are valued at their means except the variables for which the probabilities are being estimated. Fig. (1) presents the predicted probabilities at different levels of access time. It can be observed that increasing access time decreases the likelihood of mode switching propensity.

The mode switching willingness can be categorized as maximum when the choice variable i.e. “y” falls in the category y=3 or y=4, which corresponds to the decision 3: “Will change” and 4: “Will absolutely change”. The predicted probabilities of y=3 and y=4, at an access time of 10 minutes are 48% and 25%, respectively. These are the maximum values, because any value of access time greater than 10 minutes will result in lower values of predicted probabilities for category y=3 and y=4. It can be concluded from these estimated values that the maximum allowable access time associated with mode switching propensity can be 10 minutes, after which the predicted probabilities can change from categories y=3 and y=4 to y=2, y=l, and y=0.
Fig. (2) presents the predicted probabilities at different levels of waiting time. It can be observed that the predicted probabilities falling in categories y=3 and y=4 are decreasing monotonically. It means that the likelihood of mode switching from private to public mode of transport decreases with each minute increase in waiting time. It is estimated that the sum of predicted probabilities for categories y=3 and y=4 remains above 50% for any value of waiting time that is less than 4.5 minutes, after which the predicted probabilities can shift from categories y=3 and y=4 to y=l, y=2, and y=0. It means that any values of waiting time greater than 4.5 minutes may weaken the auto commuters’ mode switching propensity.

It is clear from Fig. (3) that the estimated values of predicted probability for category y=l show an increasing trend with a steep slope. It indicates that any increase in waiting time rapidly shifts large proportions of predicted probabilities from other categories to category y=l. To get good results in terms of an appreciable proportion (i.e. 63%) of the predicted probabilities falling in categories y=3 and y=4, the waiting time is to be kept below 2 minutes. The estimated probability for waiting time of 9 minutes show a cross-over point, where the predicted probability for category of y=3 is 25%, and the predicted probability for y=3 is equal to y=l, and that of y=4 equal to y=0.

The impact of increasing travel time difference (in terms of reduced travelling time) on predicted probabilities is presented in Fig. (3). It is observed that the sum of the predicted probabilities for categories y=3 and y=4 will always be greater than 75% for any travel time difference of 6 or more minutes. It indicates that if the time saving on public mode is 6 minutes and above, the auto commuter’s mode switching propensity increases rapidly, and the likelihood of taking public mode is predominant. The travel time difference is an estimate that reflects the time saving on public mode of transport.
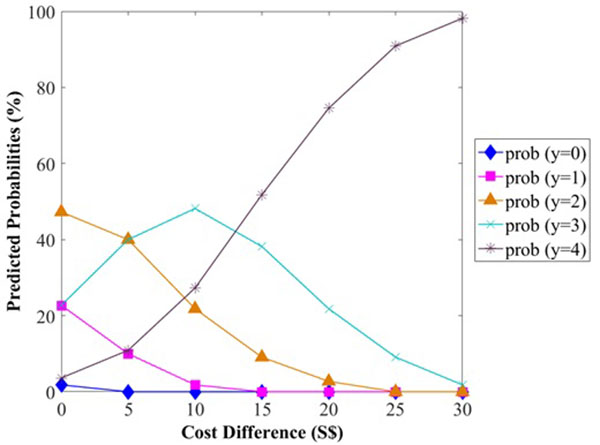
Fig. (4) presents the predicted probabilities of mode switching at different levels of cost difference in terms of cost saving on public mode of transport. It is estimated that a cost difference up to S$10 (1S$=0.73US$) would result in a shift of predicted probabilities from various categories to categories y=3 and y=4. At a cost difference of S$10 or more, the predicted probabilities shift to y=4. About 51% of predicted probabilities fall in the category of y=4 at a cost difference of S$15. Thus, it can be inferred that mode switching propensity becomes significant at a cost difference of S$10 and becomes predominant from S$13 onwards. The category y=4 shows a continuous increasing trend with a steep slope, and capturing a major share of predicted probabilities from categories y=l, y=2, and y=3.
3.3. Marginal Effect on the Probability of Commuter’s Mode Switching Decision
The impact of a unit change in the value of one variable on the overall probability of the outcome is analyzed by estimating the marginal effect of that specific variable on the probability of auto commuter’s mode switching decision. There are two kinds of variables that are under consideration, one being the continuous variables and the other, dummy variables. The marginal effect on the event probability, in an ordered probit model, is expressed as the partial derivative of the probability function with respect to the continuous variable “x”. In general, it can be estimated as:
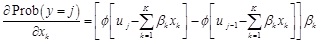 |
(2) |
where “Φ(•)” gives the probability density function. The marginal effect of a dummy variable is analyzed by estimating the change in probabilities.
| Variable | prob (y=0) | prob (y=1) | prob (y=2) | prob (y=3) | prob (y=4) |
|---|---|---|---|---|---|
| Gender | -1.763 | -19.870 | -8.362 | 22.156 | 7.839 |
| Age (years) | -0.238 | -5.407 | -8.149 | 7.474 | 6.320 |
| Level of education | -0.200 | -4.547 | -6.854 | 6.286 | 5.315 |
| Level of income (S$/month) | 0.173 | 3.922 | 5.912 | -5.422 | -4.584 |
| Access time to MRT station (min) | 0.035 | 0.797 | 1.201 | -1.102 | -0.931 |
| Waiting time at MRT station (min) | 0.096 | 2.172 | 3.274 | -3.003 | -2.539 |
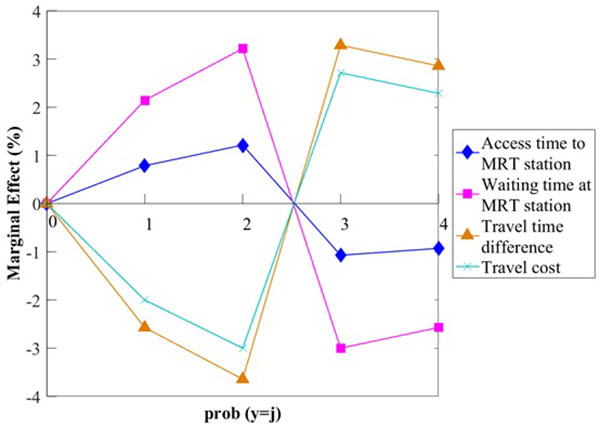
| Travel time difference (min) | -0.109 | -2.469 | -3.721 | 3.413 | 2.886 |
| Travel cost difference (S$) | -0.089 | -2.031 | -3.062 | 2.808 | 2.374 |
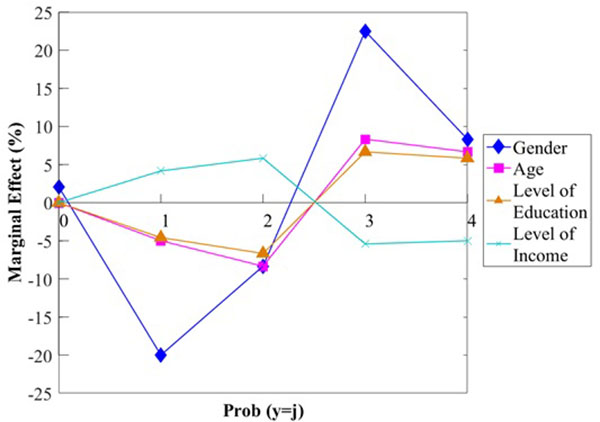
Fig. (5) profiles all the marginal effects of the respective socio-economic variables. It is clear from Fig. (5) that the marginal effect of gender is most significant as compared to age, education, and income, which have similar degrees of marginal effects, while noting the effect of income is inverse to that of others. From this analysis, it can be concluded that males with higher level of education and lower level of income are more willing to change their mode decisions under the influence of integrated traveler information. In Table 2, by observing the transport facility variables, it can be seen that every unit (of 1 minute) increase in access time decreases the probability of category y=3 by 1% and y=4 by 1%. Such effect can give the understanding that improving, i.e. reducing, the access time by 5 minutes can result in increasing the probability by 5% of categories y=3 and y=4. Similarly, when waiting time is improved by 1 minute, it would increase the probability by 3% for category y=3, and by 2.5% for category y=4.
The travel time difference shows a different pattern. Increasing time difference increases the mode switching propensity. One unit (of 1 minute) increase in travel time difference increases the probability of category y=3 by 3.4% and y=4 by 2.9%. Similarly, S$l increase in cost difference increases the probability of category y=3 by 2.8% and y=4 by 2.3%, while it reduces the probability of category y=l by 2.03% and y=2 by 3.06%. It means that the integrated information that provides details on time saving and cost saving for public mode transport can enhance auto commuter’s mode switching propensity. When the marginal effects of transport facility variables are sorted accordingly, it can be observed that the marginal effect of travel time saving is more significant as compared to the rest. The least influence is access time, with marginal effect in the range of 1%. This can also be observed from Fig. (6), which consolidates the marginal effects of the respective transport facility variables. Fig. (6) shows that the effect of travel time difference is the most significant. This may be due to the context of the conducted survey, whereby all the auto commuters were regular private mode users, and from their perspectives, time saving is generally more valuable than cost saving.
CONCLUSION
Although multimodal traveller information is becoming more and more widely available across the world nowadays, with the main purpose of assisting travelers in planning their trips, the impacts of providing such information have not been thoroughly investigated. In this study, through studying the survey results of developed experimental baseline and preference scenarios of Singapore, where multimodal traveller information began to be available during the time of study, the authors were able to measure and understand the underlying commuters’ mode switching propensity under the influence of integrated real-time multimodal traveler information in an environment where the public was initially exposed to such information. The approach and the results obtained as reported in this paper are timely and have not yet been widely addressed in the literature. The results, although still primitive at the current stage, have pointed to directions for further studies, which may provide important indications for defining policies to enhance the use of public transport, which is a widely adapted policy goal worldwide to achieve sustainable urban development.
For an urban metropolis like Singapore, there has been a highly integrated multimodal transport system in operation, not only that this presents an ideal case to study the commuter’s mode choice behavior but also that there is a necessity to do so [17] to further optimise the system’s operation, especially when integrated traveller information allowing commuters to plan their multimodal trips are beginning to be available at the time of this research, which was set out to explore a more efficient way to estimate the effects of integrated multimodal traveller information, given by an information system like AMTIS (Advanced Multimodal Traveller Information Systems), on commuter’s mode choice behavior and how it quantitatively affects the transport network [18, 19].
The travel behavior survey aimed to determine the factors that influence the commuter’s mode choice decision in response to integrated multimodal traveler information has been reported in this paper. The results show that auto commuters would be willing to switch their mode of travel if they are given comparative (integrated) information, which is in accordance with the previous studies [16]. As established by various other studies [4, 12-16], the time and cost saving by public mode of transport can enhance the willingness of auto commuters to switch their mode of travel from private to public. A higher mode switching propensity was observed in commuters once they were provided with (simulated) integrated traveler information, and the estimated results of the travel behavior models clearly shows that strong mode-switching propensity is observed for commuters in response to integrated multimodal traveler information in a congested environment, which is a clear indication that it is very likely that commuters would be willing to change their modes in response to integrated traveler information, probably with better knowledge about the potential benefits of changing their modes. The socio-economic characteristics that significantly influence the mode choice decision are: gender, age, level of education, and level of income. A higher mode switching propensity was found for middle-age male commuters having a lower level of income. Females with higher level of education were also less willing to switch their modes from private to public modes of transport.
However, several limits still exist and could be explored in future work. First, the study was carried out at the early stage of provision of multimodal traveller information in Singapore, which in a way has limited the inclusion of factors and information which have now become available in the more mature state of the systems nowadays. At the same time, multimodal traveller information is also becoming available in more places across the world and more people have grown from novice to advanced users of such information. In view of these recent developments, the study and the approach as discussed in the paper may be extended to take these into considerations, and a cross-culture or cross-region comparative study may also be possible to investigate the differences in mode switching behaviour, which can help to look into how integrated information can help to achieve the global goal of public transport primacy policy, as a way to help the world to develop in a more sustainable way. Second, the developed experimental baseline and preference survey scenarios are static in nature and lack dynamism. The preference scenarios can be developed in a more realistic way by using a simulator-based travel environment imitating multimodal transportation system that allows the generation of: congestion resulting from any incident; recurrent peak hour scenarios; and/or transient road pricing on specified links. The resulting mode specific journey time information can then be gathered and presented to the subjects in order to provide their responses and preferences with respect to the proposed preference scenarios. Third, another dimension that can be studied under the same subject is the impact of the reliability of the information i.e. what shall be the effect of disinformation/unreliable information on the subjects. Such a phenomenon can be studied by providing the subjects with information but attaching a factor to it that indicates the reliability of the information, thus converting provided information into a certain level of disinformation or unreliable information.
CONFLICT OF INTEREST
The authors confirm that this article content has no conflict of interest.
ACKNOWLEDGEMENTS
This work was conducted under the PhD research programme of the first author (Dr Memon AA) in Nanyang Technological University. This second author was financially supported by the Singapore National Research Foundation under its Campus for Research Excellence and Technological Enterprise (CREATE) programme.

