All published articles of this journal are available on ScienceDirect.

Effect of Traffic Flow, Proportion of Motorcycle, Speed, Lane Width, and the Availabilities of Median and Shoulder on Motorcycle Accidents at Urban Roads in Indonesia
Abstract
Aim:
This paper provides model to find the effect of traffic flow, proportion of motorcycle, speed, lane width, and the availabilities of median and shoulder on motorcycle accidents at urban roads in Indonesia.
Methods:
A generalized linear model with quasi likelihood approach was used to develop the model.
Results:
Traffic flow, proportion of motorcycle, speed, lane width, the availabilities of median and shoulder were found significant in explaining motorcycle accidents.
Conclusion:
These findings can be used as information for engineers to develop action programs to improve road safety for urban roads in Indonesia.
1. INTRODUCTION
Motorcycle accidents are still a problem in many countries. Fatality rates (deaths per 10,000 registered vehicles) in this accidents are still higher than in non-motorcycle accidents [1-7].
In Indonesia [8], the number of motorcycles is more than half (73.5%) the total vehicle population. In 2011, there were 207,713 vehicles involved in traffic accidents, of these, 154,636 (74.45%) accidents involved motorcycles. Moreover, the number of deaths, serious and slight injuries of rider and pillion are more than 74% of the total casualties.
Research on the development of traffic accidents models uses a generalized linear modeling approach (GLM) [9] with a Poisson or negative binomial error structure. This approach is widely used because it is more suitable for accident characteristics (i.e., discrete, rare, and independent) than the classic linear model. Many studies have reported the advantage of the GLM approach in developing predictive models for traffic accidents [10-19].
This study presents a prediction model for motorcycle accidents on urban roads to find the effect of traffic flow, proportion of motorcycle, speed, lane width, and the availabilities of median and shoulder using the Generalized Linear Modeling approach. The Poisson and Negative Binomial errors were used to analyze the distribution of accident data. The parameter estimates and tests of their significance were carried out using GLIM 4 statistical software [20], which is specifically designed for fitting generalized linear models.
2. THE DATA
In this study, a total of 35 urban roads in the cities of Surabaya (20 roads) and Malang (15 roads), East Java Province, Indonesia, were selected. Some conditions were limited to selected roads, such as roads with insignificant land use changes; with no major modifications or upgrading and only roads with a history of fatal accidents, hospitalization and minor injuries.
Traffic flow (pcu/hour) on the selected roads ranged from 1,124 to 11,242, the proportion of motorcycle (%MC) ranged from 48.2 to 90.9, speed (km/hour) ranged from 23.5 to 69.2, and speed is defined by the 85th percentile speed, while lane width (m) ranged from 3.0 to 5.0, number of lane ranged from 2 lanes to 6 lanes, shoulder width (m) ranged from 0 to 2.5, and the gradient was flat. Of the 35 selected roads, 15 roads with median and 20 roads without median, while 19 roads with shoulder and 16 roads without shoulder.
Three-years period motorcycle accident data (2008-2010) recorded in the police offices were used in this study.
3. THE MODEL
Organization for Economic Development and Cooperation (OECD) [6] has stated that the choice of regressors should be based on the theory used, questions to be answered and professional knowledge. Based on that, the variables of the model were selected. The response variable was the number of motorcycle accidents and the explanatory variables were traffic flow, proportion of motorcycle, speed, lane width, and the availabilities of median and shoulder. The continuous variables were identified as traffic flow (km/hour), proportion of motorcycle (%MC), and lane width (m). The categorical variables were speed with 2-factor levels (level 0: speed < 40 km/hour and level 1: speed > 40 km), median with 2-factor levels (level 0: roads without median, level 1: roads with median), and shoulder with 2-factor levels (level 0: roads without shoulder, level 1: roads with shoulder). The selection of category for speed was based on speed regulation in Indonesia, where the maximum speed limit on urban road was 40 km/hour.
In this study, the formulation of the model was proposed as follows:
 |
(1) |
Where MCA is motorcycle accidents, the k, α, β1, β2, β3, β4, β5 are the coefficients and e term is the error showing the difference between actual and predicted models. In order to interpret traffic flow directly, the traffic flow function in Eq. (1) needs to be changed in the logarithmic form i.e. Ln(flow), while the others no need transformation. This approach was used by authors in earlier studies on modeling of motorcycle accidents [21-29, 13, 14]. It should be noted that total 3-years (t) accident frequencies were used to fit the models. However, by introducing an offset variable (the term log t period) in the fitting process, the final model would yield the number of accidents per year. This approach was also utilized in an earlier study on traffic accidents [12].
The log-linear version of the model after transforming in to logarithmic form is:
 |
(2) |
In the present study, the method suggested in earlier studies [10-15] was used to determine the error distribution. The study recommended that the selection of error distribution was based on the goodness of fit test wich was conducted on the observed accidents frequencies.
The deviance was used as a measure of the goodness of fit [20]. The minimum deviance produced in the fitting process indicates that the observed frequencies are the closest fit to the theoretical frequencies. Furthermore, a hypothesis test at 95% confidence level (p<0.05) was conducted on the selected error distribution. To overcome the dispersion problem, the quasi-likelihood approach [9] was employed, this approach has also been used in the earlier studies on motorcycle accidents [28, 13, 14]. In this way, the dispersion parameter was derived from the mean deviance (scaled deviance over its degrees of freedom). This will get a model with scaled deviance equal to its degrees of freedom. This approach was explained in the GLIM System Release 4 Manual [20].
The analyses of Multivariate and Univariate were employed in this study. Multivariate analysis was used to determine which variable(s) had the most influenced on the probability of motorcycle accidents. Univariate analysis was performed to determine the effect of each explanatory variable on motorcycle accident. In this analysis only variables that significant at 5% level were then used in Multivariate analysis. The final model would be obtained based on goodness of fit and the significance test. That is the change in scaled deviance from adding or removing the terms, the ratio of scaled deviance to its degrees of freedom (mean deviance) and the 5% significant level of the t-statistic of the parameter estimates.
4. RESULTS
The results of the analysis on the Poisson and Negative Binomial distributions show that the Poisson distribution was slightly better in explaining the variation of accident occurrence than the Negative Binomial. The deviance (D) for the Poisson model was 2.94 with 4 degrees of freedom (df) and 3.05 with 3 degrees of freedom (df) for Negative Binomial. The preliminary analysis of Univariate has shown that all the terms were significant at 5% level. The result of Multivariate analysis is presented in Table 1. The analysis showed that all explanatory variables were significant at the 5% level. It can be seen that the scaled deviance was equal to its degrees of freedom. The scaled deviance was changed from 1268.0 to 28.0 with a loss of 6 degrees of freedom and the mean deviance was changed from 37.3 to 1.0.
| Explanatory Variable | Coefficient | Standard Error | Degrees of Freedom | Scaled Deviance | t-Value | Sig.at 0.05 | Mean Deviance |
|---|---|---|---|---|---|---|---|
| Constant | -4.031 | 0.4980 | 34 | 1268.0 | -8.09 | Yes | 37.3 |
| Flow | 0.6235 | 0.0703 | 33 | 183.4 | 8.87 | Yes | 5.6 |
| %Mcycle | 0.03274 | 0.0042 | 32 | 126.9 | 7.80 | Yes | 4.0 |
| Speed (1) | 0.222 | 0.0497 | 31 | 117.9 | 4.47 | Yes | 3.8 |
| LnWidth | -0.2544 | 0.0539 | 30 | 106.9 | -4.72 | Yes | 3.6 |
| Median (1) | -0.4356 | 0.0537 | 29 | 53.8 | -8.12 | Yes | 1.9 |
| Shd (1) | -0.251 | 0.0495 | 28 | 28.0 | -5.07 | Yes | 1.0 |
| Coefficients for factors (1) are differences compared with the reference level (0) | |||||||
Based on the multivariate analysis, the final model is as follows:
 |
(3) |
where MCA is motorcycle accidents per year, β2 = 0.0 and 0.222 for Speed = 0 and 1, respectively, β4 = 0.0 and 0.4356 for Median = 0 and 1, respectively, β5 = 0.0 and 0.251 for Shd = 0 and 1, respectively.
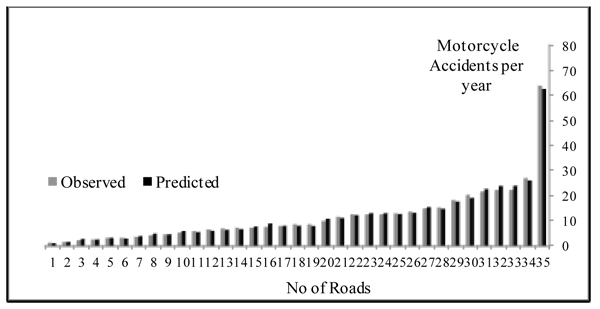
Fig. (1) presents the observed and predicted motorcycle accidents. It can be seen that the final model fits the data point satisfactorily.
5. DISCUSSION
The model shows that traffic flow, proportion of motorcycle, traffic speed, lane width, median and shoulder are important factors in predicting motorcycle accidents.
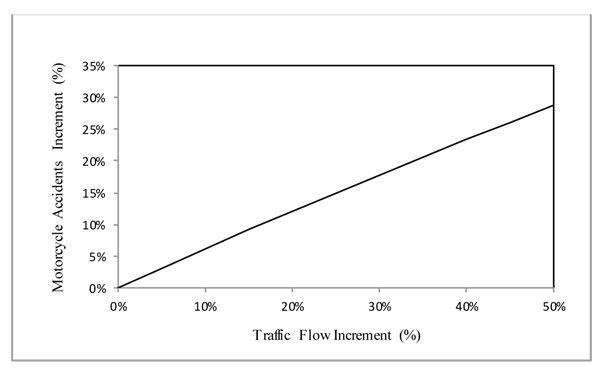
Fig. (2) presents the effect traffic flow on motorcycle accidents. It can be seen that an increase in traffic flows is related with an increase in motorcycle accidents.
For example, traffic flow increased by 10% will cause 6.12% increase in motorcycle accidents. This finding is in line with previous studies in traffic accidents [10, 12, 19, 30].
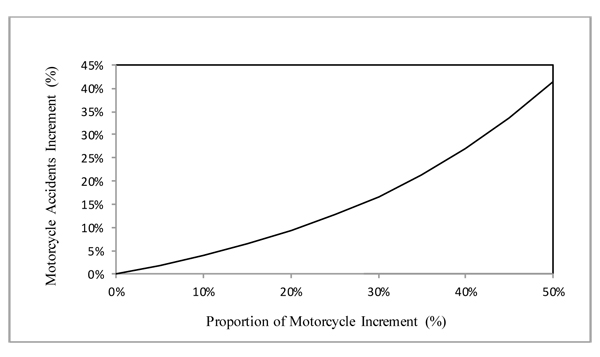
The estimates of % MC imply that more number of motorcycles on the road are associated with an increase in motorcycle accidents (Fig. 3). For instance, a 20% increase in proportion of motorcycle is expected to raise motorcycle accidents by 9.25%.
Meanwhile, the estimate of Speed shows that an increase in traffic speed is associated with an increase in motorcycle accidents. For instance, vehicles running with speed more than 40 km/hour (speeding) will cause to raise motorcycle accidents by 24.9%. This finding is in agreement with the report of previous studies in traffic accidents [10, 17, 19, 30, 31].
The estimate of LnWidth indicates that a wider lane is related with declining in motorcycle accidents. For example, addition of lane width by 0.50m will reduce motorcycle accidents by 11.94%. This finding supports the result of previous study on traffic accidents [10].
The estimate of Median implies that roads with median are associated with a reduction in motorcycle accidents. Motorcycle accidents at roads with median are 35.3% lower than those at roads without median. It seems plausible since the median will reduce number of conflicts between motorcycles and between motorcycles with other vehicles.
The final model also showed that roads with shoulder are associated with a reduction in motorcycle accidents. This is indicated by the estimates of Shd. For instance, motorcycle accidents at roads with shoulder are about 22.2% lower than those at roads without shoulder. This finding seems plausible since motorcyclists utilize available shoulders as a traveled path when riding on the road. The result should concern traffic engineers to take attention the benefits of hard shoulders to lowered motorcycle accidents.
To find a more complete picture, Figs. (4 and 5) present the effect of traffic flow on motorcycle accidents at roads with and without median both for roads with and without shoulder.
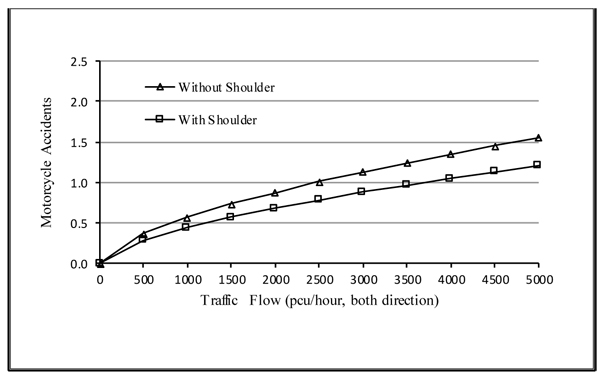
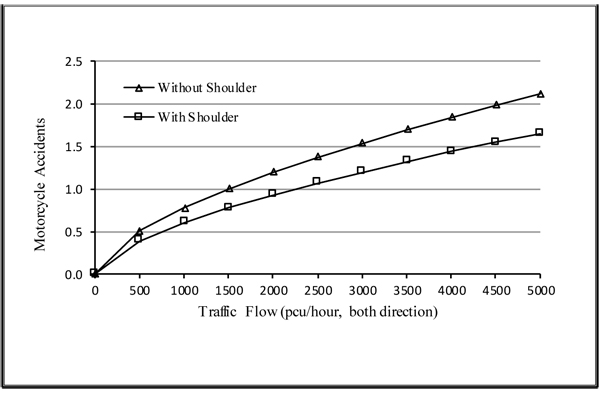
From the figures, by introducing the number of motorcycle accidents to no more than 1-accident/year then traffic flow at roads without median should be no more than 1, 500 pcu/hour and 2, 200 pcu/hour for roads without and with shoulder, respectively. While for roads with median the traffic flow should be no more than 2, 500 pcu/hour for roads without shoulder and 3,700 pcu/hour for roads with shoulder. These findings provide information to regulate traffic flow intended for the safety of motorcycle.
CONCLUSION
This paper presents motorcycle accident prediction model that describes the effect of traffic flow, proportion of motorcycle, traffic speed, lane width, and the availabilities of median and shoulder on urban roads in Indonesia. The model reveals that the explanatory variables are significant in explaining motorcycle accidents.
A larger traffic flow is related with an increase in motorcycle accidents. Speeding (traffic speed > 40 km/hour) is associated with more motorcycle accidents, while wider lanes, the availabilities of median and shoulder bring a reduction in these accidents.
The results reported in this study can be used as a reference for traffic engineers to develop action programs for improving motorcycle safety. However, the model may be suitable for traffic circumtances in developing countries like Indonesia, where the proportion of motorcycles is more than half the total vehicles population.
For further research, the effect of variation of traffic flow by time periods (hourly, peak hour, and peak periods) on motocycle accidents is suggested; and to classify the model by different road geometric is also advised.
CONSENT FOR PUBLICATION
Not applicable.
CONFLICT OF INTEREST
The author declares no conflict of interest, financial or otherwise.
ACKNOWLEDGEMENTS
Declared none.

