All published articles of this journal are available on ScienceDirect.

Spatial Analysis to Identify Pedestrian Crash Zones: A Case Study of School Zones in Thailand
Abstract
Background:
In Thailand, it has the second highest road traffic fatality rate in the world at 36.2 deaths per 100,000 populations. The pedestrian crash zones are based on the road and physical environment, vehicle and driver behavior and pedestrian behavior, especially the area around the school. Therefore, this paper would like to improve safety by identifying crash area through Geographic Information Systems (GIS).
Objective:
The objective of this paper is to identify pedestrian crash zones of primary schools and secondary schools in Bangkok, Thailand through the spatial analysis and GIS tool.
Method:
The research methodology was the data collection from pedestrian-vehicle crashes in 2016 at 12 schools of 1,218 locations in Bangkok. The data analysis used GIS for geocoding the crash locations. The spatial patterns and pedestrian crash zone map were applied by Moran’s I statistic and the Kernel Density Estimation (KDE).
Results:
The Moran’s index showed that the accident locations within school zone were a clustered pattern considering on Moran’s Index which approached +1 and the z-scores greater than 2.58. The KDE showed that the pedestrian crash zones were different depending on the physical environment; however, the most significant areas were at urban areas, crowded areas, and intersections of arterial roads and local roads about 508 meters from the school center.
Conclusion:
This research could be concluded that the spatial patterns and pedestrian crash zone map will assist the transportation planners and traffic police for identifying crash locations and specific vulnerable road users, especially pedestrians and bicycle users.
1. INTRODUCTION
In Thailand, it has the second highest road traffic fatality rate in the world, that estimating over 66 deaths every day from the analysis of The World Health Organization (WHO) [1]. Additionally, Thailand loses 3 to 5% of Gross Domestic Product (GDP) due to road traffic crashes. Majority of the death age was between 15-24 years old. The most accidents occurred on motorbikes [2]. It is interesting to note that the death rate of pedestrians and bicycle users (called as vulnerable road users) is 1.24 deaths per 100,000. When considering the death based on ages, the death rate among children below 15 years old is 4.53 deaths per 100,000. This is a high rate when compared to those in the developed countries in Asia [3, 4]. Accident prevention plans made by the government mainly aim to solve the overall accident problems. However, it lacks analysis and specific prevention plans for children and vulnerable road users. This problem not only causes loss of life but also affects the confidence in resolving road infrastructure. It is a major problem that the government should solve immediately to promote pedestrian activities in urban areas and to reduce the personal cars which cause traffic congestion in Bangkok.
School grounds are normally located in the urban areas where there are several road users including vehicle users, pedestrians and bicycle users. It is considered to be the areas in which there is a high likelihood of accidents occurring with children representing the majority of pedestrians, as a result of their lack of awareness about the dangers posed by cars as well as their insufficient knowledge about traffic signs. Additionally, drivers are unable to predict the movements of children. Therefore, it is particularly dangerous when children use crossroads and walk on pedestrian crossings during rush hour [5-7].
The main goal of a sustainable and safe road transportation system is to reduce the annual number of road accident casualties to a fraction of the current levels. Three factors that cause accidents consisting of physical environment, vehicle and driver behavior and pedestrian behavior should be solved. However, to solve physical environment is one of the factors that helps reduce accidents and it should be conducted along with other factors [8-10]. In Thailand, solving road accidents around schools still lacks specific plans. Significant question that traffic safety engineers seek an answer to is that where safety countermeasures should be implemented so that the most effective outcome can be reached. With this fact, the hazardous locations known as accident-prone areas or accident black spots (a place where road traffic accidents have taken placed) should be identified and analyzed. In order to implement problem specific pedestrian safety countermeasures, pedestrian high crash locations must be identified to improve pedestrian safety. Previous research studies have investigated the aspect of safety analysis using Geographic Information Systems (GIS). The findings show that GIS is an effective tool for analyzing geographic context of crashes. According to the spatial dimension of traffic crashes, it is better to employ statistical analysis combined with spatial attributes to achieve better understanding of traffic crashes. GIS is widely used to perform spatial data management and analysis operations. With this application, accident-prone areas or accident black spots are identified and analyzed. To improve pedestrian safety, locations where pedestrians often encounter accidents should be identified to implement specific safety countermeasures. This could be significant data for transportation planners and traffic police when formulating accident prevention plans with relevant organizations.
The objective of this paper is to identify pedestrian crash zones of primary schools and secondary schools in Thailand. The study area covered the schools located in Bangkok. The analysis was conducted through the spatial analysis and GIS tool. The sample included the schools in Bangkok located in urban zones that had the highest rate of accidents. Then, the locations of accidents were recorded in GIS and spatial autocorrelation. Kernel Density Estimation (KDE) were used for the analysis.
2. LITERATURE REVIEW
This research employed GIS as a research tool. The analysis was divided into 2 parts. The spatial patterns enabled the understanding of accident phenomenon at school zone, using Moran’s I statistic to test. Pedestrian crash zone was identified to seek accident-prone areas, using Kernel Density Estimation (KDE). Details can be described as follows.
2.1. The Spatial Patterns
GIS has been utilized in transportation safety application. It can analyze and process data to support decision making. Therefore, many research studies applied GIS to investigate spatial pattern analysis, using Moran’s I statistic which creates the understanding of accident phenomenon in the cities. Anselin [11] and Black [12] explained that the principles of spatial pattern analysis are that this approach to network autocorrelation analysis are mathematically equivalent to spatial autocorrelation analysis. Additionally, it focuses on understanding phenomena occurring specifically in highly urbanized areas. Map display and Moran’s I statistic can help researchers to predict situations accurately. Rukewe et al. [13] investigated and documented the variations in crash frequencies by types and across different road types in Ibadan, Nigeria, using GIS as a tool for research. The results of using Moran’s I statistic showed that crashes were clustered in space with motorbike crashes showing greatest clustering. This created the understanding of variations in road traffic accident occurrence as well as identifying locations and neighborhoods with unusually higher accidents frequency. Truong and Somenahalli [14] studied spatial autocorrelation analysis of pedestrian-vehicle crash data for identification and ranking of unsafe bus stops. The spatial autocorrelation tool was used to compute Moran's I statistics and z-scores. The results showed that the z-scores reached the highest value of 136.2, meaning that the pedestrian-vehicle crash data was clustered until a distance threshold of 1,000 m. Mohaymany et al. [15] explored the distribution of road accident occurrence on Arak-Khomein rural road in Markazi province in Iran, using GIS through Moran’s I and Kernel Density Estimation (KDE). The results of using Moran’s I showed that Moran’s index was between 0 to -1 during 2006-2008, showing that the locations of accident occurrence were unclearly scattered (Moran’s index 0.20, z-score 1.18). The use of KDE could identify accident locations more accurately and could be compared with the statistical value of accidents.
2.2. Pedestrian Crash Zone
Many research studies applied GIS to investigate road accident-prone areas. Levine et al. [16], Affum and Taylor [17], Austin et al. [18], Kim and Levine [19] and Miller [20] improved pin maps of crash and database queries by using GIS. To demonstrate spatial crash distribution at the road network level, other effective analytical tools in GIS software including buffer, nearest neighbor method, simple density and KDE method of crash cluster detection were combined with GIS. Pulugurtha et al. [21] Pulugurtha and Pasupuleti [22] applied the GIS-based methodology to identify high pedestrian crash zones, consisting of geocoding crash data, and creating crash concentration maps and identifying high pedestrian crash zones in Las Vegas metropolitan area and Charlotte, North Carolina as the study area. The results showed that GIS-based methodology reduced the subjectivity in the analysis process and could make the analysis more scientifically reliable. Similarly, Schneider et al. [23] explained that utilizing GIS in the research could reduce problems of accident locations and help formulating preventive plans effectively. Ziari and Khabiri [24], Steenberghen et al. [25] designed pedestrian and bicycle lanes by applying the results from GIS analysis to generate a contour map that identified areas of high crash occurrence determined by crash density and clusters of crashes involving pedestrians and bicyclists. Anderson [26] identified road accident hotspots in London. The study applied the methodology using GIS and KDE to study the spatial patterns of injury-related road accidents. Rankavat and Tiwari [27] identified pedestrian accident-prone locations in Delhi using GIS and KDE. Results showed that fatal pedestrian accidents were significantly clustered (p<0.05) over the Ring Road of Delhi at intersections.
According to the previous studies, GIS has been widely used in the crash analysis to identify high-risk neighborhoods, areas of vehicle collision and accident black spots. GIS provides tools and techniques for identifying and analyzing the influence of location on the phenomenon. It is also a tool which assists planners in making the decision using statistical principles to test. The use of Moran’s I statistic is suitable for making understanding on an overview of accident distribution displayed as a statistical value. KDE shows an analysis of road accident-prone areas with obvious locations. However, previous research studies focus on road network analysis and did not address specifically school zones which are important places in cities. Therefore, this is a key principle has been emphasized by the researchers.
3. MATERIAL AND METHODS
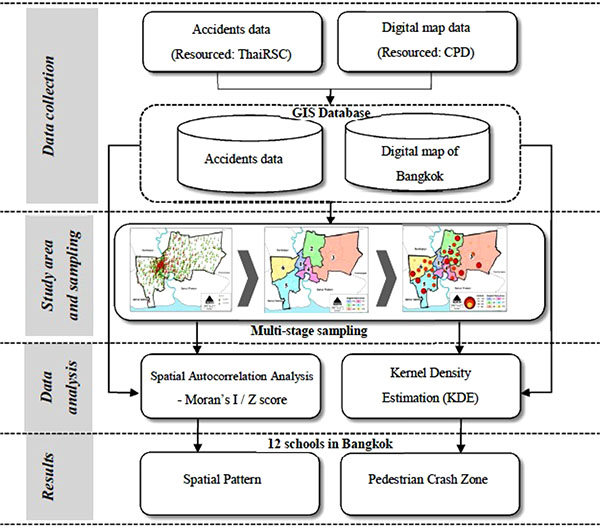
The proposed methodology was to apply GIS in order to identify high pedestrian crash zones in school zones in Bangkok. The methodology is summarized in a flowchart (Fig. 1).
3.1. Data Collection
- The digital map of Bangkok, was provided by the City Planning Department of the Bangkok Metropolitan (CPD) and was imported in the data frame of the Esri’s ArcGIS software
- The pedestrian-vehicle crash data in 2016 was collected from Thai Road Accidents Data Center for Road Safety Culture (ThaiRSC) (accident data was recorded from road accident information in compulsory insurance claims data from the Road Accident Victims Protection Co., Ltd. Nationwide). The data were recorded in an Excel spreadsheet and was imported into GIS by giving the X and Y coordinates of each accident. The results of this data were in the Shapefile format (.shp).
- Further analysis was done using SQL (structured query language) in the attribute table of accident points and spatial analysis using spatial statistics tool.
3.2. Geocoding Crash Data
Geocoding is the process of assigning a location, usually in the form of coordinate values to an address by comparing the descriptive location to the reference material. With addresses, address locations are spatially displayed which helps in recognizing patterns within the geocoded information. The crash database with location details is imported into GIS. The pedestrian-vehicle crashes are then overlaid on to the road network map. After the data is recorded on GIS, recording attribute data of accident location including fatal, injury, fatal per accidents index has proceeded so as to use in analyzing a relationship of the accident.
3.3. Study Area
Bangkok was selected as the study area because Bangkok metropolis has the highest road accident rate in Thailand (rate of 28,537 cases, or 10% of the entire country). Bangkok is a center of administration, economy, education and employment of the country and then has more than 15 million populations with more than 7.2 million vehicles. In addition, it tends to continually grow at the rate of 2.3 percent per year. There are 748 pedestrian accident cases or 2.47 percent of the entire accidents. The accident rate is likely to increase. This data demonstrates the road accident problem in Bangkok which should be solved immediately [2]. The sample of this study included 436 schools in both primary and secondary schools levels in 50 Bangkok Metropolis Administration (BMA) areas. However, since the study included 436 schools, the researcher addressed only the school zones with severe problems to identify patterns and locations of accident occurrence. The random sampling was distributed across six urban districts. The schools with the highest accident rate in each district were selected to describe phenomena of accident occurrence. GIS was applied as a tool to study spatial pattern analysis and identify pedestrian crash zones.
A multi-stage sampling technique was applied to select the sample, using the highest accident statistics as a filter. The sample was screened from 436 schools across Bangkok and schools with severe accidents were selected as representatives of the six districts. In summary, there were 12 representative schools including six primary schools and six secondary schools in Bangkok. The sampling began with:
- Dividing schools into six district groups
- Administrative areas according to the BMA, consisting of six district groups, were identified. The six areas with the highest rates of vehicle and pedestrian accidents were then selected.
- Selecting districts in Bangkok
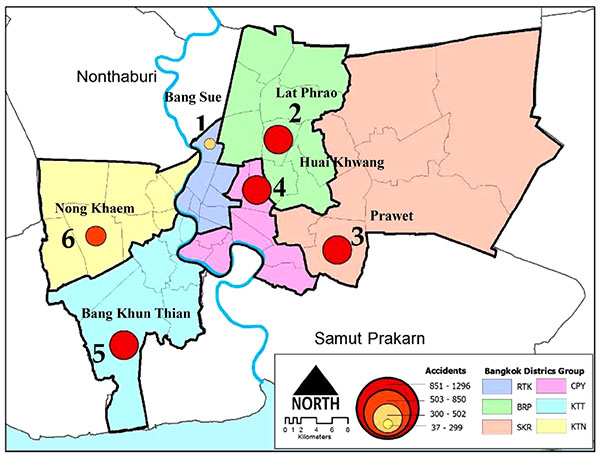
- The district representatives of each district group, based on the ThaiRSC statistics of pedestrian-vehicle crashes data in 2016, were selected. There were six selected districts including Bang Sue District, Lat Phrao District, Prawet District, Huai Khwang District, Bang Khun Thian District, and Nong Khaem District Fig. (2).
- Selecting the schools
The schools were selected from the six district groups. Taking the ThaiRSC statistics on walking distance for Thai people into consideration, these were within 800 m of the schools [28]. Such district groups were the representatives of the school zones where students could access through walking. Such areas were sensitive areas and could cause loss to students when road accidents occurred. Then, the areas with the highest road accidents at each study site were selected. To summarize, 12 schools from the six district groups were selected and the selected schools were analyzed pedestrian crash zones (Table 1).
| Districts Group | Districts Were Selected | School Name (Sample in Research) | Primary Schools | Secondary Schools | Accidents within 800 m. (Cases) |
|---|---|---|---|---|---|
| Rattanakosin | NO.1 | Bangpho school | X | - | 121 |
| (RTK) | Bang Sue | Yothinborana 2 school | - | X | 105 |
| Burapa | NO. 2 | Wat Lat Phrao school | X | - | 135 |
| (BRP) | Lat Phrao | Satriwithaya 2 school | - | X | 54 |
| Sinakrarin | NO.3 | Wat Krathum Suea Pla school | X | - | 78 |
| (SKR) | Prawet | Ratdamri school | - | X | 26 |
| Chapraya | NO.4 | Pracharatbamphen school | X | - | 88 |
| (CPY) | Huai Khwang | Triamudomsuksapattanakarn Ratchada school | - | X | 156 |
| Kongtontay | NO. 5 | Bangkuntiansuksa school | X | - | 131 |
| (KTT) | Bang Khun Thian | Rattanakosinsomphod bangkhunthian school | - | X | 120 |
| Kongtonnoy | NO. 6 | Watudomrungsee School | X | - | 153 |
| (KTN) | NongKhaem | Matthayom Wat Nongkhaem school | - | X | 51 |
3.4. Data Analysis
3.4.1. Spatial Pattern Analysis
Several researchers have utilized GIS in transportation safety applications and used GIS to solve highly complex problems in transportation planning. Various methods have been suggested to analyze the spatial aspects of geographic data, such as spatial autocorrelation. Moran’s I is a commonly used indicator of spatial autocorrelation. In this study, Moran’s I was used as the first measure of spatial autocorrelation. Moran’s I statistic [29, 30] measures the correlation among spatial observations and allows us to find the characteristics of the global pattern (clustered, dispersed, random) among sub-districts. Its values range from −1 to +1. If the value of Moran’s I is equal to +1 or near +1 indicating perfect positive spatial autocorrelation and implies a complete clustered pattern. If this value is 0, it indicates that the spatial randomness or multipolar accumulation. Finally, if Moran’s index is equal to −1 or near −1, it shows that the crashes follow a scattered pattern, perfect negative spatial autocorrelation.
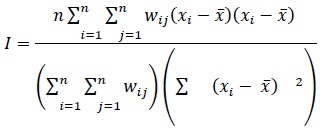
While Moran’s I quantifies the spatial autocorrelation as a whole, the Local Indicators of Spatial Association (LISA) measure the degree of spatial autocorrelation at each specific location by using local Moran’s I. It is also good for identifying local spatial cluster patterns and spatial outliers [11]. The index can be calculated using the following equation:
 |
(1) |
where:
Wij: the proximity weight of location i and location j with Wii = 0
Xi : the distances index at location j
 : the global mean value
n: the total number of pedestrian-vehicle crash locations
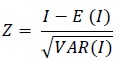
The statistical significance for Moran’s I can be calculated using z-score methods. The standardized z-score can be mathematically represented as follows:
 |
(2) |
In this research, the spatial autocorrelation tool was used to compute Moran’s I statistics and z-scores.
3.4.2. Kernel Density Estimation (KDE)
KDE as a nonparametric approach is one of the most commonly used and well-established spatial techniques used to estimate crash intensity for the purpose of hotspot identification [31, 21]. KDE is a spatial analyst tool for point pattern analysis, which is the core of the geographical analysis [32]. Analyzing spatial data by ArcGIS software shows the results in the form of the raster. The principle of this method is to calculate the radius of each point and link a point to another through bandwidth. The radius of the circular neighborhood affects the resulting density map. If the radius enlarges, there is a possibility that the circular neighborhood would include more feature points, which results in a smoother density surface [33-35]. The cell size chosen was 1 m × 1 m. A quadratic Kernel function was then applied, which in this study defined the principle of the Kernel function as
 |
(3) |
where:
f (x,y): the density estimate at the accident location (x, y),
n: the number of observations,
h: the bandwidth or kernel size,
k: the kernel function, and
di: the distance between the accident’s location (x, y) and the location of the ith observation.
4. RESULTS
4.1. Spatial Pattern Analysis
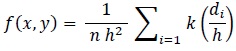
In this step, the 1,218 crash locations were recorded into the GIS and attributed data of accident locations consisting of fatal, injury, fatal per accidents index was recorded. Spatial autocorrelation analysis was applied to detect the spatial patterns of pedestrian crashes. The statistical calculation of the distance rates of the severity point between schools were used in the analyses. Spatial autocorrelation analysis was used to measure and test how severity points were clustered / dispersed in space with respect to their distances rate. The benefits to create understanding of specific patterns of the phenomenon of accidents, and compare statistical figures which explain the results. Fig. (3) shows the spatial distribution of pedestrian crashes within 800 m of 12 schools (six primary schools and six secondary schools). For the primary schools level, Watudomrungsee School had the highest accident rate (153 cases). For the secondary schools level, Triamudomsuksa Pattanakarn Ratchada School had the highest accident rate (156 cases). However, it is very difficult to identify locations that had multiple crashes using this figure. In order to investigate the spatial dependency among crash frequencies and distances from the school, Moran’s I is a more prevalent technique defined below as ranging from -1 to +1. Moran’s I indicator was employed for the crashes.
The results of the calculation of the autocorrelation statistics of pedestrian crash zones are summarized in Table 2 Based on the spatial pattern analysis through the use of Moran’s I processed by GIS, in the primary schools level, Bangkuntiansuksa School had the lowest value 0.518 while Pracharatbamphen School had the highest value i.e. 0.977. In the secondary school level, Triamudomsuksapattanakarn Ratchada School had the lowest value; 0.532 while Rattanakosin Somphod Bangkhunthian School had the highest value; 0.904. When considering Moran’s I values and z-scores, the results illustrated that locations of accident occurrence among 12 schools showed clustered patterns between 0 to +1. Moreover, the clustered patterns tended to approach +1. When considering z-scores, 12 schools had z-scores greater than 2.58. This showed that accident distribution showed the clustered and certain patterns at statistically significant of 0.01. However, the statistical data showed the tests of the relationship between locations of the accident and school zones only which creates the understanding of phenomena of accident occurrence and comparisons among schools and to relate to environment of school zones to explain the results.
| No. | School Name | Avg. of Distance (m) | Moran’s Index1 | Z-Scores | Pattern |
|---|---|---|---|---|---|
| 1 | Bangpho School | 489.17 | 0.529 | 26.374* | Clustered |
| 2 | Yothinborana 2 School | 584.81 | 0.684 | 18.470* | Clustered |
| 3 | Wat Lat Phrao School | 535.58 | 0.796 | 9.922* | Clustered |
| 4 | Satriwithaya 2 School | 473.50 | 0.669 | 7.917* | Clustered |
| 5 | Wat Krathum Suea Pla School | 527.53 | 0.901 | 17.290* | Clustered |
| 6 | Ratdamri School | 478.41 | 0.629 | 5.366* | Clustered |
| 7 | Pracharatbamphen School | 463.70 | 0.977 | 20.191* | Clustered |
| 8 | Triamudomsuksapattanakarn Ratchada School | 540.00 | 0.532 | 13.166* | Clustered |
| 9 | Bangkuntiansuksa School | 514.02 | 0.518 | 11.489* | Clustered |
| 10 | Rattanakosin somphod bangkhunthian School | 508.43 | 0.904 | 7.825* | Clustered |
| 11 | Watudomrungsee School | 420.30 | 0.933 | 27.967* | Clustered |
| 12 | Matthayom Wat Nongkhaem School | 556.92 | 0.534 | 11.268* | Clustered |
(0) – (-1) = Scattered pattern
(0) = Randomness
* denotes statistically significant (z-scores greater than 2.58)
4.2. Pedestrian Crash Zones
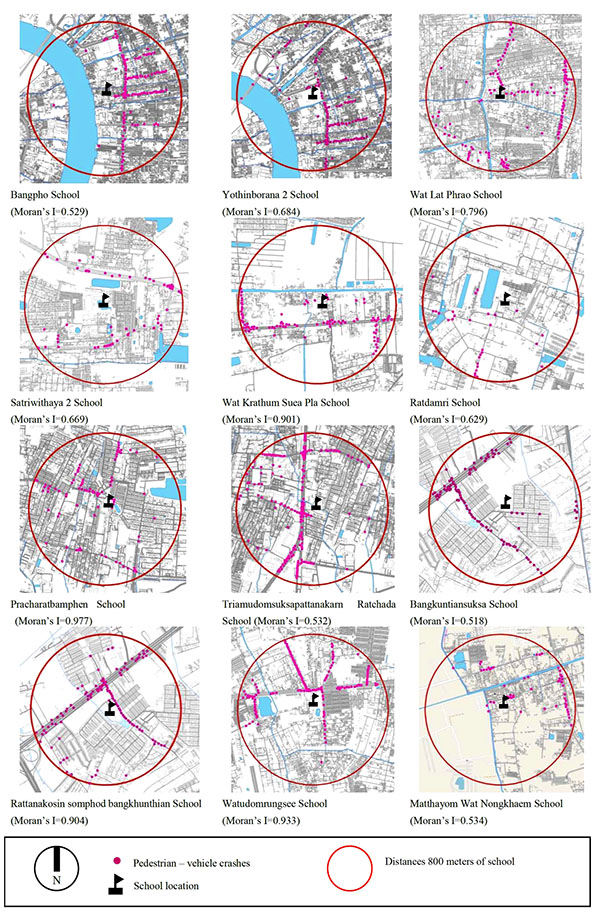
The analysis of pedestrian crash zones employed the statistics of road accidents within 800 m of the schools in 2016. The Kernel’s distribution patterns were different based on the environment in each area. Once-high density zones are defined, pedestrian safety programs can be focused on them with increased efficiency [36]. The pedestrian crash zones map is shown in Fig. (4), with five crash concentration levels (Very Low, Low, Medium, High, and Very High).
This step focuses on summarizing high pedestrian crash zones for allocation of resources. Table 3. shows the crash frequency of accidents occurrence, fatal accidents, injuries, fatal per accidents index and high crash zones. The analytical results can be categorized based on the levels of education as follows.
| No. | School Name |
Crash frequency (Cases) |
Fatal (Cases) |
Injury (Cases) |
Fatal per accidents index |
High crash zone (Sq.m) |
|---|---|---|---|---|---|---|
| 1 | Bangpho School | 121 | 4 | 140 | 0.033 | 1,022 |
| 2 | Yothinborana 2 School | 105 | 4 | 120 | 0.038 | 1,038 |
| 3 | Wat Lat Phrao School | 135 | 1 | 162 | 0.007 | 1,360 |
| 4 | Satriwithaya 2 School | 54 | 3 | 58 | 0.056 | 712 |
| 5 | Wat Krathum Suea Pla School | 78 | 2 | 86 | 0.026 | 208 |
| 6 | Ratdamri School | 26 | 2 | 32 | 0.077 | 696 |
| 7 | Pracharatbamphen School | 88 | - | 104 | - | 885 |
| 8 | Triamudomsuksapattanakarn Ratchada School | 156 | 2 | 181 | 0.013 | 2,301 |
| 9 | Bangkuntiansuksa School | 131 | - | 162 | - | 2,362 |
| 10 | Rattanakosin somphod bangkhunthian School | 120 | 3 | 141 | 0.025 | 3,370 |
| 11 | Watudomrungsee School | 153 | 2 | 158 | 0.013 | 77 |
| 12 | Matthayom Wat Nongkhaem School | 51 | 1 | 65 | 0.020 | 229 |
| Total | 1,218 | 24 | 1,409 |
4.2.1. Primary School Level
The school zone of Bangkuntiansuksa School was identified as the highest crash zone in the primary schools level covering 2,362 Sq.m. The location of accident-prone areas was clustered at the intersection of Rama II Road and Rama II 69 Lane. This is because there was heavy traffic in this area throughout the day. A departmental store and a fresh market are located in this area. This is similar to the school zone of Wat Lat Phrao School which was identified as the second highest crash zone covering 1,360 Sq.m. The distributions of accident-prone areas appeared evidently at the intersection of Chokchai See Road and Osathit 3 Road where many government offices and commercial buildings are located and at Lat Phrao Road continuing to Saphansong fresh market. However, formulating an accident preventive plan requires a study of the accident frequency and severity. In the primary schools level, the school zone of Watudomrungsee School was found to have the highest accident rate i.e. 153 cases per year. When considering accident severity, Bangpho School was found to have the highest rate of severe accidents with 4 fatal traffic accidents per year. The dead persons per accidents index was 0.033.
4.2.2. Secondary School Level
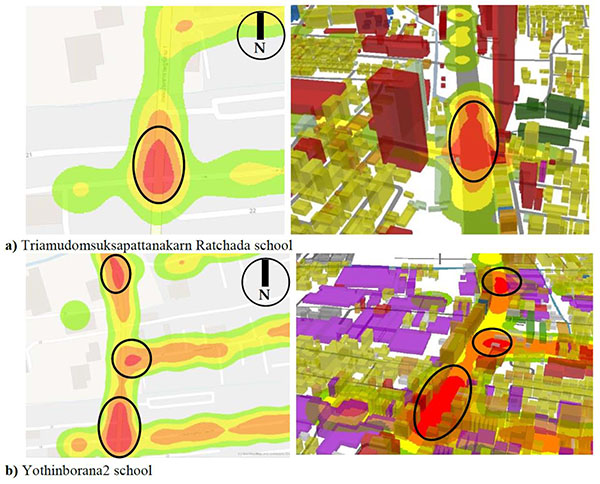
The school zone of Rattanakosinsomphod Bangkhunthian School was identified as the highest crash zone in the secondary schools level covering 3,370 Sq.m. The locations of accident-prone areas were clustered at the intersection of Rama II Road and Rama II 69 Lane as well as area along the road to the front of the school. This is because there was heavy traffic throughout the day and many mixed land use activities were found in this area. In addition, a large departmental store, fresh market and a local bus stop are located in this area, which is similar to the school zone of Triamudomsuksapattanakarn Ratchada School which was identified as the second highest crash zone covering 2,301 Sq.m. The distribution of accident-prone areas occurred evidently along Rachadaphisek Road, especially at the intersections of main roads. These include the intersections of Ratchadaphisek Road and Ratchadaphisek 7 Lane, Ratchadaphisek Road and Prachasongkhro Road and Pracharajbampen and Ratchadaphisek Road and Ratchdaphisek 3 Lane. This area has large departmental stores, hotels and residential buildings. Accident frequency and severity was also found there. In the secondary schools level, the school zone of Triamudomsuksapattanakarn Ratchada School was identified to have the highest accident rate at 156 cases per year. When considering the accident severity, Ratdamri School was identified to have the highest rate of severe accidents with 2 fatal accidents per year. The dead persons per accidents Index was 0.077.
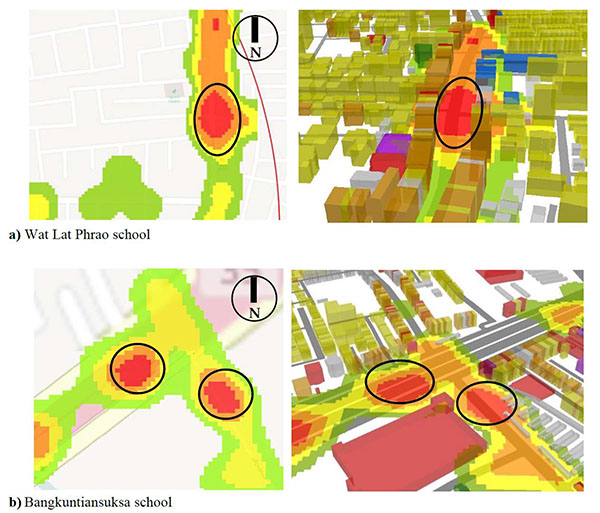
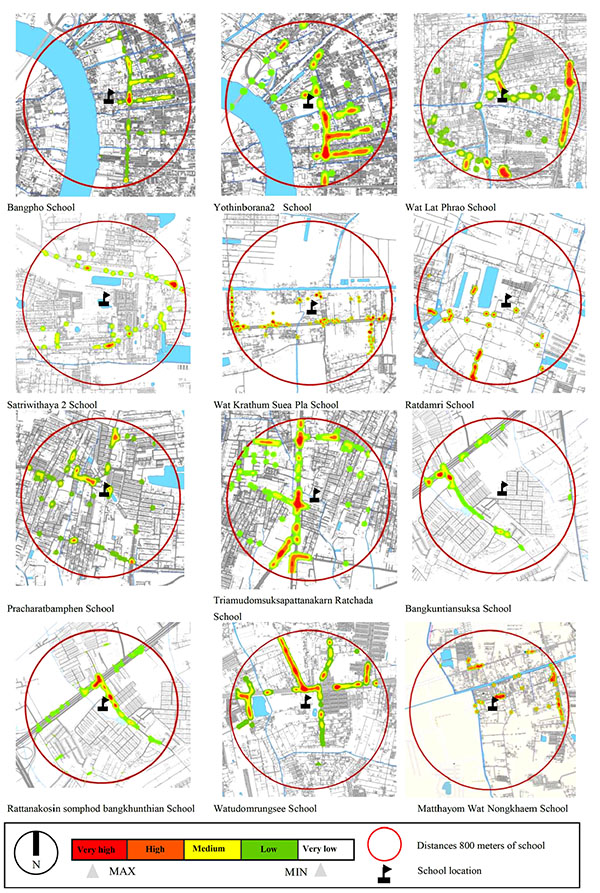
In summary, the KDE of 12 schools from six district groups showed that Rattanakosinsomphod Bangkhunthian School, Triamudomsuksapattanakarn Ratchada School, Bangkuntiansuksa School, Wat Lat Phrao School and Yothinborana 2 School were in the most accident-prone areas. The accident locations were different depending on the environment. Importantly, the intersections of arterial roads and local roads, and commercial areas were the most significant areas of vehicle and pedestrian accidents Figs. (5-6) showed the accident-prone areas, that are marked using black circles). The results can be contributed to the government agencies to solve problems at accident-prone areas. Moreover, the results support decision making for transportation planners to create solutions and preventive measures for students. However, such accidents are a result of several factors such as the road and physical environment, vehicle and driver behavior and pedestrian behavior. This will be investigated in the further study.
CONCLUSION
According to the report of WHO in 2015, Thailand was ranked second in the world in terms of road traffic fatality which causes loss of life to road users. Despite the number of deaths of pedestrians in Thailand is not high (2,037 cases, or 2.67%) when compared to that of motorbikes (23,266 cases, or 35.15%) and personal cars (20,332 cases, or 30.71%), nevertheless, it is an important matter that results in confidence in resolving road infrastructure and is a major problem that the government should solve immediately. In order to promote pedestrian activities in urban areas and to reduce the uses of personal cars which cause traffic congestion in Bangkok, the objective of this paper is to identify pedestrian crash zones of primary schools and secondary schools in Bangkok, Thailand through the spatial analysis and GIS tool. This is consistent with the “Decade of Action for Road Safety” of Thailand, stating that all accident black spots shall be solved [2]
According to the review of the related literature, schools are one of the accident black spots in Thailand. This is because a majority of road users is children who lack pedestrian experience which can highly lead to accidents [5-7]. Identifying pedestrian crash zones in previous studies shows that GIS applications in road crash analysis offers data management system as well as cartographic and analytical functions in support of pedestrian crash zones management. GIS has been widely used in crash analysis to identify high-risk neighborhoods, areas of vehicle collision and pedestrian crash zones. In addition, it is employed to explain the results of traffic engineering including analysis, planning and designing. Spatial pattern analysis through Moran’s I statistic is a technique widely used to obtain understanding of the phenomena of accident occurrence by considering Moran’s Index and z-score [11-15]. Many studies employed KDE technique as a tool to identify pedestrian crash zones and explain the results together with accident statistics [21, 22, 26, 27]. However, previous studies mainly focused on identifying traffic and pedestrian crash zones on road network. Therefore, the researcher applied such techniques in this study to explain about accident occurrence at school zones of primary schools and secondary schools levels in Bangkok. The researcher selected 12 schools with the highest rates of severe accidents recorded by Thai Road Accidents Data Center for Road Safety Culture (ThaiRSC) covering six district groups of Bangkok Metropolis Administration (BMA) to explain about the phenomena.
According to the 12 school sample, the results of Moran’s I analysis illustrated that spatial autocorrelations were found and the accident case within the school zone (800 m from school) was a clustered pattern. This could be seen from Moran’s Index which approached +1. When considering z-score, 12 schools had z-scores greater than 2.58. This data illustrated a clustered pattern of accident occurrence related to school locations and also indicated the trend of accident occurrence near schools. This may lead students with pedestrian experiences and awareness less than people in general to have accidents. Identifying pedestrian crash zones using KDE technique with physical survey illustrated that the accident locations were different depending on the environment. The accident locations at 12 schools were commonly in urban and crowded areas, mixed land use, and intersections of arterial roads and local roads about 508 meters from the school center. This is consistent with ThaiRoads Foundation’s data for the Road Safety Situations in Thailand 2014-2015, which explained that accident-prone areas are at intersections where traffic is heavy showing the higher death toll than straight roads [2, 37]. As a result, engineering measures shall be provided to seek solutions on specific areas and measures that address the risk behavior. Accident-prone areas at school zones can illustrate how students using pedestrian at risk from accidents. This information can be significant for government agencies to solve problems at accident-prone areas. Such solutions include installing traffic lights at road intersections, better traffic monitoring, enforcing traditional measures such as speed limits, mandatory wearing of seatbelts and helmets to reduce crashes and injuries, improving safe environment of pedestrian, installing zebra crossing, installing traffic lights for pedestrians and installing traffic signs to control driving and traffic signs to promote pedestrians for children with limited perception [36, 38, 39]. Additionally, knowledge about pedestrian safety and traffic sign shall be promoted among students. Traffic police officers shall work collaboratively with community volunteers to take care of road safety during rush hours. Specific pedestrian accident database shall be created and monitored regularly [40]. The pedestrians at school zones with the effective preventive measure will help students go to school themselves by walk instead of parents’ driving that effect to causes traffic congestion and high rate of accidents.
The techniques mentioned in this research are tools that support effective decision. However, site investigation and traffic engineering data should be carried out and collected to explain findings and develop solutions to the problems in the future. Further research should include a multi-criteria ranking method of pedestrian-vehicle crash zones. Such improvements could increase the accuracy and reliability of the prioritization of unsafe school zones where pedestrian crashes occur. However, in formulating preventive plans, qualitative research such as observation, exploration, and in-depth interviews should be applied to examine accuracy and to explain the reasons for the plans.
CONSENT FOR PUBLICATION
Not applicable.
CONFLICTS OF INTEREST
The authors declare no conflict of interest, financial or otherwise.
ACKNOWLEDGEMENTS
I would like to express my gratitude to Thai-Road Accidents Data Center for Road Safety Culture (ThaiRSC) and City Planning Department of Bangkok Metropolitan (CPD) for data and information, and the authors would like to acknowledge the valuable comments and suggestions of the reviewers, which have improved the quality of this paper.

