All published articles of this journal are available on ScienceDirect.

Developing the New Barrier Condition Index (BCI) to Unify the Barrier Assessments - A Case Study in Wind River Indian Reservation, Wyoming
Abstract
Based on the statistics, roadsides include a considerable portion of the fatal crashes annually. Barrier systems are one of the important components of roadside that plays a key role in mitigating the severity of these crashes and save more lives. Despite the substantial role of barrier systems, unfortunately, there is no unified rating system in the barrier condition assessments to utilize for the optimization of the improvements. As the primary contribution in this study, a new Barrier Condition Index (BCI) was proposed to unify the barrier assessment studies to use the same reference for rating barrier systems. This fact makes the decision-makers able to establish a prioritized ranking for optimizing the barrier improvements. For this purpose, the research investigated a comprehensive list of damages in barrier systems. Then, appropriate coefficients were given to the damage types based on their effects on the performance of the system reviewing the previous works. To show the practicability of the new BCI as an example for the whole procedure of the assessment, six different barrier systems located in Wind River Indian Reservation (WRIR), Wyoming, were also evaluated in the study. Based on the evaluation done, the BCI was used to rank the performance of the barriers. Three of the barrier segments at WRIR was introduced as the high-severity level which should be considered in the first priority of the improvement phase.
1. INTRODUCTION
Roadside safety has always been known as an important component of highway systems. Based on the statistics, only 16% of crashes in the US occurs on the roadside; however, these crashes mostly conclude in fatalities or high-severity injuries [1]. According to Jalayer and Zhou [2], 62% of the fatal crashes were ROTR in the US in 2013. Using road barriers is known as one of the popular and traditional strategies in roadside designs. An appropriate road barrier system reduces the severity of crashes as well as providing a second chance for the ROTR drivers to get the control of their vehicles back (in low-speed run-offs). On the other hand, a poor performance would cause a serious safety problem by switching its role to a dangerous fixed-object. In fact, barriers were the third most common objects (after trees and the utility poles) among all the fixed-object fatalities by object struck in 2008 [3]. According to another available statistic, barriers had a direct influence on about 1,000 fatalities and 28,000 injuries in the US in 2010 [4]. One of the reasons of the considerable role of barrier systems in fatal crashes is that the initial goal of using barriers was keeping vehicles from running off of the road (or into roadside sharp slopes or the fixed-objects such as culverts), and no consideration was taken into account about the severity of crashes when the vehicles hit the barrier [5]. Therefore, inappropriate configurations such as blunt-end (spoon) terminals, turned-down (sloped-end) terminals, and concrete posts became widespread in the early 1960s. Despite the report of Federal Highway Administration (FHWA) in 1994 [6] for not allowing the use of blunt-end and turned-down terminals, there are still many of them due to the limited budget to replace them [5]. From another point of view, design and construction of a majority part of the current barrier system in the US go back to more than 30 years ago when the traffic volumes, speed limits, types of vehicles, and the regulations were different from today. Vehicles are heavier than before, and pickup trucks are more widespread in the US, while most of the existing barrier systems are not designed based on the impact of large vehicles. According to FHWA [7], an average increase of 3.7 million vehicles per year has been shown in the US. Speed limits in the US had also seen significant changes since 1974 when the first-speed limit was set up in the US. Until 1995, the maximum speed limit in the US was 105 km/h (65 mph), while it has been increased up to 137 km/h (85 mph) in recent years. Higher posted speed limits will lead to more severe impacts with the barriers systems, especially in states like Wyoming with a maximum speed limit of 129 km/h (80 mph). These facts build a serious conflict in terms of the consistency of the barrier systems with current traffic features (volume, speed, etc.). Many of the old barriers also pose a great risk to the vehicles due to their non-crashworthy status at the moment. From another side of view, some barriers heights are probably inappropriate for the following two reasons:
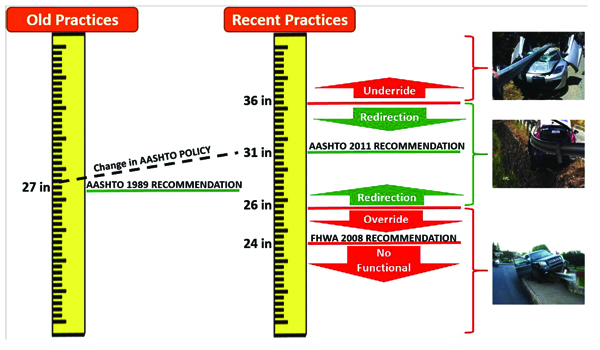
- Recent studies recommend new values for the height. For instance, a 70 cm (27-inch) height (from the ground to the top level of the barrier) used to be recommended for the typical W-Beam guardrails; however, the value is upgraded to 78 cm (31 inches) based on the 2011 edition of Roadside Guide Design (RDG) (3). Note that the old standard 70 cm (27-inches) height for W-Beam guardrails was failed by the tests done in NCHRP report No. 350 [8]; however, the 70 cm (27-inches) height is still acceptable for Box beam guardrails.
- The height (from the ground to the top level of barriers) has been decreasing gradually due to pavement strategies such as adding new pavement layers. Overlays increase the elevation of the pavement while barriers are stuck at the same elevations.
The low-height barriers raise the propensity of vehicle rollover and override, while very tall-barriers are also promoting the vehicle underride [9]. According to Wiebelhaus et al. [5], the low-height of 60 cm (24 inches), and 66 cm (26 inches) will increase the potential of vehicle override in W-Beam guardrails. However, the 70 (the old recommendation of RDG in AASHTO 1989), 74, and 76 cm height will lead to a redirection of the vehicle. This override can be even more dangerous for the vehicles with high Center of Gravity (CG) in low-height barriers. Based on FHWA’s W-Beam Guardrail repair [10], the guardrails with a lower height of 60 cm (24 inches) were categorized as “no longer reasonably functional.” On the other hand, a height more than 91 cm (36 inches) will increase the potential of an underride crashes in guardrails [9]. Fig. (1) shows a summary of the discussion regarding the effect of height on safety.
Therefore, it is always an essential task for highway agencies to have a considerable attention to the short-term and long-term improvement activities for keeping the performance of barriers at an acceptable level. According to Cafiso et al. [11], a Crash Modification Factor (CMF) about 0.78 (22% reduction in crashes) was examined for improving the old guardrails with barriers meeting the new standards while the influence was observed even more significant in the ROTR crashes by a CMF of 0.67.
The main objective of this manuscript is to develop a new rating system for the barrier condition evaluations. The rating system includes various types of the damages as well as their impacts on the barrier performance. By developing the rating system (as the main contribution of the research), it would be possible to consider a unified scale in the barrier assessment studies which would be useful regarding upgrading the optimization process of the barrier improvements based on a prioritized ranking. A similar example of having a unified scale can be the Pavement Condition Index (PCI) as a universal reference to evaluate the pavements. The research team also decided to call the developed rating system for the barrier systems as Barrier Condition Index (BCI). As another goal, six different barrier segments located in Wind River Indian Reservation (WRIR), Wyoming, were evaluated and ranked based on BCI to show the practicality of the developed rating system. The case study of WRIR also makes a clear view of the whole procedure of using the proposed barrier assessment for the readers.
2. BACKGROUND
Despite the widespread use of road barriers and their effect on highway safety, there are not enough studies regarding barrier assessment and improvement. One of the main focuses of the previous studies was on upgrading the dimension of barriers by conducting field tests or simulation runs. Julin et al. [9] conducted crash testing and computer simulation to investigate the maximum guardrail height for the Midwest Guardrail Systems (MGS). The objective of finding the maximum height was to keep an acceptable height for barriers (with no need to replacement) even after soil erosion in back of the posts or future roadway overlay improvements. According to their results, a 91 cm (36-inch) height was found (5 inches higher than the recommended height by RDG) safe with no threat of underride for vehicles in collisions. However, it should be mentioned that the recommended maximum of 91 cm (36-inch) height should not be used in all conditions due to the limitations of the methodology. As other studies regarding the dimension of barriers, Schmidt et al. [12], and Albuquerque et al. [13] evaluated the length-of-need of barriers. Albuquerque et al. [13] suggested that shorter length can be considered for barriers when the side slopes are flat. This fact is excluded in the existing method presented by RDG [3] since the effect of the side slopes is not considered comprehensively in the calculation of the length-of-need.
Simulation models are in widespread use in various aspects of transportation engineering from the studies on operation and safety of transportation systems [14, 15] to studies related to vehicle dynamic performance [16]. Simulation modeling and before-after analyses included a major portion of the literature review of barriers. The simulation studies [17-19] mostly focused on predicting the damages caused to vehicles by barriers in collisions. On the other hand, before-after studies [11, 20] concentrated on estimating the benefits of barrier improvements in comparison to the before-improvement period.
A limited part of the previous studies is related to the condition assessment of barriers. As one of the most recent efforts in this part, the Pennsylvania Department of Transportation [21] conducted a field survey to present a uniform statewide condition evaluation for shoulder and barrier in Pennsylvania. Their study defined different types and severities for damages to present new inspection checklists for the field surveys. However, no method was mentioned for optimization of the improvement activities. NCHRP report 656 [22] might be the most comprehensive study regarding the guardrail condition assessment. The report 656 almost pointed all the possible damages of guardrails and rated them based on the frequency and severity of the damages. As one of the studies which included optimization, Wiebelhaus et al. [5] proposed a benefit-cost analysis using the Roadside Safety Analysis Program (RSAP). The study was done on 68 W-Beam guardrail systems in Kansas with a specific focus for the improvement of low-height guardrails and the guardrails with failed end-treatments (such as blunt-end or turned-down terminals).
3. DEVELOPING THE BARRIER CONDITION INDEX (BCI)
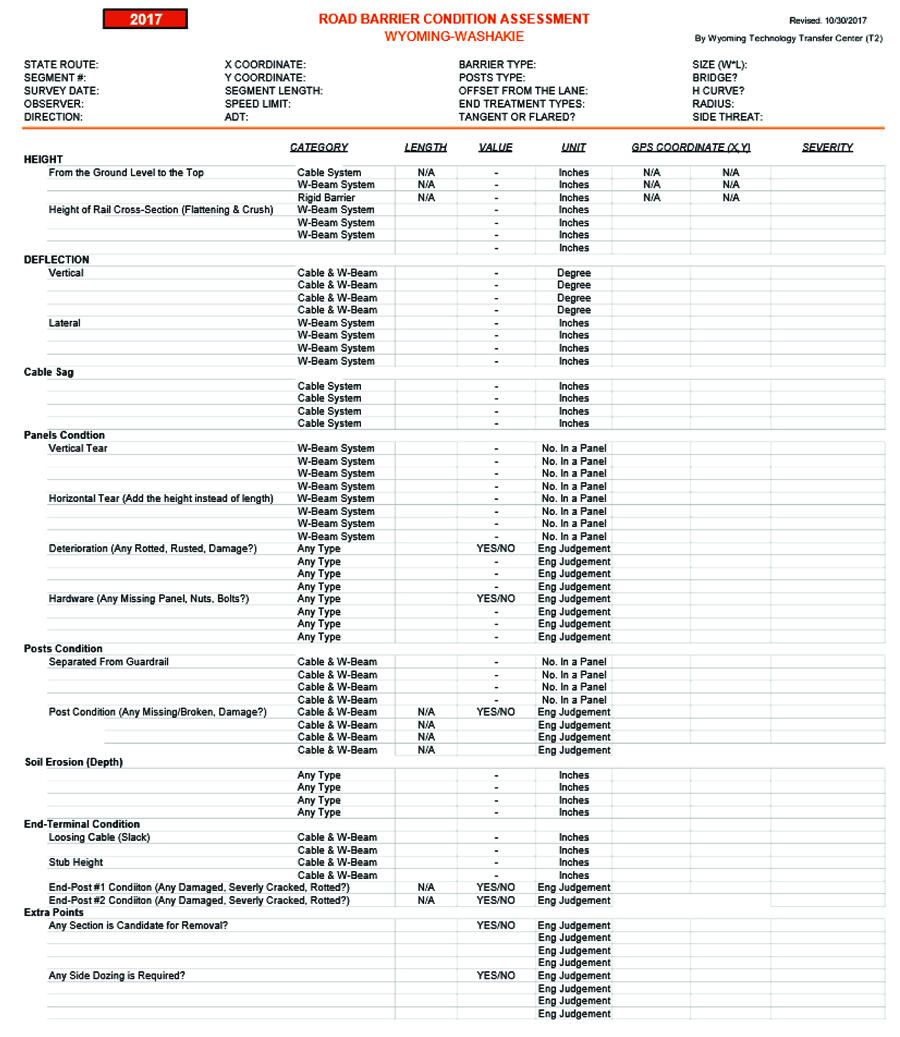
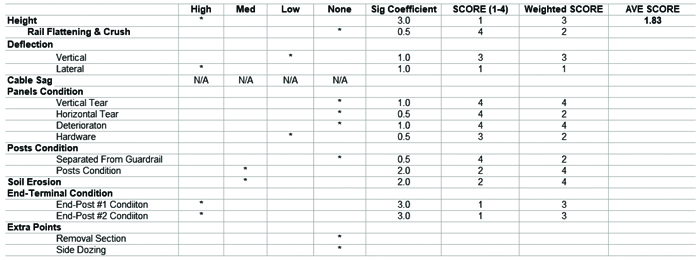
A “Barrier Condition Assessment (BCA)” worksheet was developed in this study after reviewing previous studies [3, 21, 22). Fig. (2) shows a screen of the worksheet. This worksheet covers all the damages involved with barrier assessments including geometric features (height, and offset) as well as the hardware condition (deflection damages, panel condition, posts condition, soil erosion, and the end-treatment condition). In the next step, barrier segments will be rated on a scale from 1 to 4 to investigate the sections with the most severe condition. The score 4 means an ideal condition with no error regarding design, dimensions, and the type of barrier and end-treatments used, while a 1-rated site shows a high-severity condition that the barrier is obsolete and is no longer able to provide a safe service. The rates 2, and 3 also belong to the medium, and low severity conditions, respectively. Note that the criteria used for the rating were inspired based on the tests done in NCHRP report 656 [22] and provided detail of various types of barriers in the RDG [3]. Table 1 presents the criteria considered for rating (from 1 to 4) in the study. Note that some of the variables inside the worksheet should be rated based on the engineering judgment and these variables are excluded from Table 1. In fact, the damages such as deterioration need to be graded based on observations, and there is no other way to use any measurements to estimate the level of the severity for them. The criteria for each type of damages in Table 1 is different based on their role in the severity of crashes. For example, observing any single vertical tear on the panel introduce the condition as a high-severity damage; however, a condition called as high-severity for the horizontal tears when there are at least three of them on the panel. Finally, the damages received various coefficients based on their impacts on the performance of the barrier found from the previous studies [3, 21, 22]. Fig. (3) has illustrated an example of the BCI gained after completing the data collection at one of the sites. Fig. (3) shows an average score (BCI) equal to 1.83 for this barrier segment. This means that the barrier is in the category of high-severity damages.
| Variables | Barrier Type | Unit | High-Severity a | Medium-Severity b | Low-Severity c | None (No Damage) d |
|---|---|---|---|---|---|---|
| Height From the Ground Level to the Top | Cable System | cm | x =<66 | 71>x>66 | - | x>= 71 |
| Rigid System | cm | x =<71 | 76>x>71 | - | x>= 76 | |
| W-Beam Guardrail | cm | x =<2871 | 78>x>71 | - | x>= 76 | |
| Height of Rail Cross-Section | W-Beam Guardrail | cm | - | 43<x<23 | x= 23 or 30 | x= 23 |
| Vertical Deflection | W-Beam Guardrail | Degree | x>= 30 | 15=<x<30 | 0<x<15 | x= 0 |
| Lateral Deflection | W-Beam Guardrail | cm | x>23 | 15<x<23 | 0<x<15 | x= 0 |
| Cable Sag | Cable System | cm | x>12 | 15<x<23 | 0<x<15 | x= 0 |
| Panel Vertical Tear | W-Beam Guardrail | Number | x>= 1 | - | - | x= 0 |
| Panel Horizontal Tear | W-Beam Guardrail | Number | x>= 3 | x= 2 | x= 1 | x= 0 |
| Post Separated from Guardrail | Any Type | Number | - | x>= 3 | - | x= 0 |
| End-Terminal Loosing Cable | Any Type | cm | - | x>= 4 | 2.5<x<4 | x =<2.5 |
| End-Terminal Stub Height | Any Type | cm | x>= 23 | 10<x<23 | - | x =<10 |
b. BCI = 2
c. BCI = 3
d. BCI = 4
4. THE BARRIER ASSESSMENT CONDUCTED AS CASE STUDY
The main objective of the case study in the research was to present an example of the proposed procedure for the barriers assessment studies.
4.1. Site Description
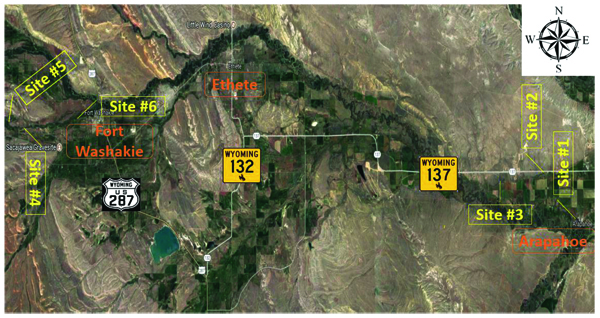
As it was mentioned earlier, six different sites were selected for this project. Fig. (4) illustrates the position of the six sites in WRIR, Wyoming, while a comprehensive information regarding the GPS (Global Positioning System) coordinates, segment length, Annual Average Daily Traffic (AADT), and the speed limit has provided by Table 2. As it is indicated in Fig. (4), the sites were located by half in the northwest of Arapahoe and the west side of Fort Washakie. US-287, WY-137, and WY-132 were also the main highways in the area. Totally, 200 m (655 ft) barrier segments were analyzed in this study as shown in Table 2.
| Site | GPS Coordinate | Length (m) | Speed Limit (km/h) | ADT (veh/day) | |||
|---|---|---|---|---|---|---|---|
| No. | Name | Latitude | Longitudinal | NB/EB | SB/WB | ||
| 1 | Little Wind & Blue Cloud | 42.96695 | -108.49938 | 63 | 88 a | - | < 400 |
| 2 | Northern Arapahoe Rd | 42.98244 | -108.51877 | 40 | 88 | 88 | < 400 |
| 3 | Little Wind Bottom Rd | 42.97877 | -108.55819 | 150 | 88 | 88 | < 400 |
| 4 | South Fork Rd | 42.99903 | -108.93186 | 46 | 88 | 88 | < 400 |
| 5 | Shoyo Bridge | 43.00029 | -108.93799 | 18 | 88 | 88 | < 400 |
| 6 | Ft Washakie Bridge | 43.00464 | -108.89305 | 18 | 72 b | 48 c | < 400 |
b. 72 km/h = 45 mph
c. 48 km/h = 30 mph
4.2. Evaluation of Existing Condition
A field study was conducted on October 31, 2017, and November 1, 2017 to observe and record the current condition of barriers. The following paragraphs describe some of the points observed regarding the condition evaluation and the surveyors have to consider them during the data collection.
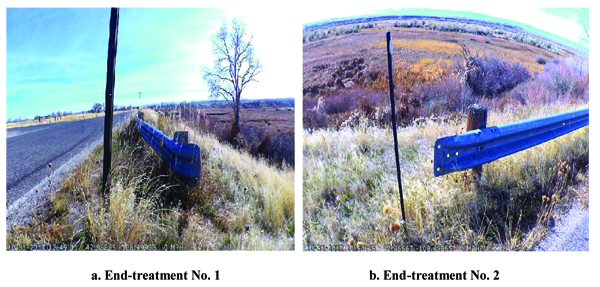
One of the important items in any barrier evaluation is the end-treatment. Fig. (5) shows the current end-treatments at site no. 1. As it is shown in Fig. (5), one of the end-treatment seems to be a “trailing end W-Beam guardrail anchorage” type while a part of the end-post is missed. The existing end-post can apply a serious damage to vehicles involved in a crash. In other words, it would perform the same as a sharp blade in the collisions. The first end-treatment was also missing the end terminal portion. As another concern regarding the existing end-treatments, the bridge transitions were not designed well. Bridge transitions are very important because they are mostly joined of two different type of barriers (usually a rigid barrier on the bridge and a guardrail system as the end-treatments) with different stiffness, strengths, and geometric features. In such cases, it is required to use adequate blackouts and additional posts or rail elements to provide a proper stiffness transition to remove the potential vehicles snag or pocketing near the bridge end [5].
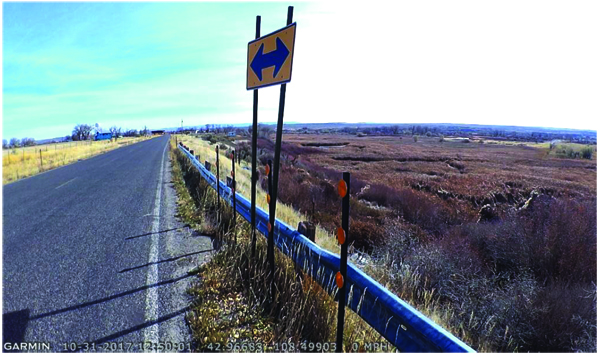
As shown in Fig. (6), the traffic signs were not placed behind the guardrail in one of the sites, and this could impact the performance of the barrier in crashes.
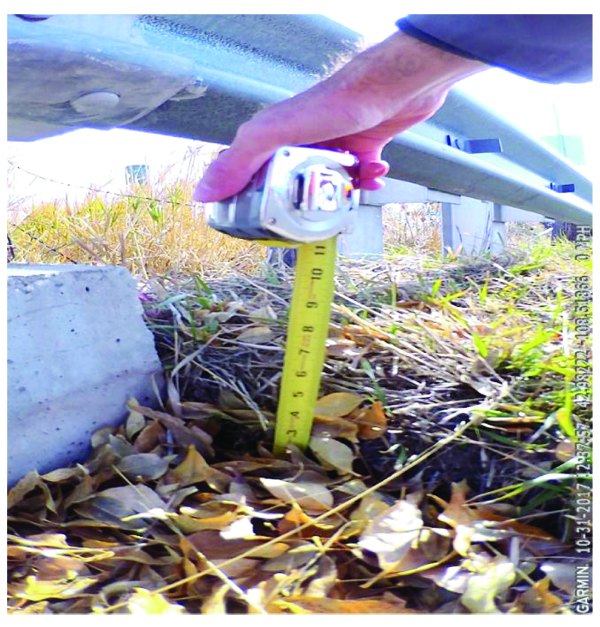
As a side note, approximately, many sections had around 13 cm (5 inches) of accumulated dirt at the bottom of the end-treatments’ posts. For this reason, despite the correct installation of the 78 cm (31-inch) height, the existing height of guardrails was measured as 66 cm (26 inches) which make a high-severity damage based on Table 1. This point is shown clearly in Fig. (7).
As the last point, the locations with no barrier system while warranted based on RDG [3] must be considered as BCI = 1 which shows a high priority for the improvement phase.
4.3. Summary of the Evaluation
Table 3 shows the condition assessment conducted for the sites in this study, while the summary of improvement costs, crash statistics, and the BCI is each site is provided by Table 4 to present a prioritized ranking for the improvement phase.
| Site | BCI | Severity Category | Main Problems | |
|---|---|---|---|---|
| NB/EB | SB/WB | |||
| 1 | 1.83 | - | High | Short height, Deflection, Poor end-treatment |
| 2 | 2.55 | 2.55 | Medium | Poor end-treatment |
| 3 | 2.60 | 2.58 | Medium | Poor end-treatment |
| 4 | 1.0 | 1.0 | High | There is no barrier, while it is warranted |
| 5 | 2.87 | 2.87 | Medium | There is no end-treatment |
| 6 | 1.54 | 1.64 | High | Short height, Deterioration, Posts failure, Poor end-treatment |
| Site | BCI | Number of Crashes | Estimated Improvement Costs ($) a | Prioritized Ranking for the Improvement | |
|---|---|---|---|---|---|
| NB/EB | SB/WB | ||||
| 1 | 1.83 | - | 0 | 14,400 | 2 |
| 2 | 2.55 | 2.55 | 0 | 15,400 | 4 |
| 3 | 2.60 | 2.58 | 0 | 15,400 | 5 |
| 4 | 1.0 | 1.0 | 3 | 20,100 | 1 |
| 5 | 2.87 | 2.87 | 0 | 22,100 | 6 |
| 6 | 1.54 | 1.64 | 0 | 33,800 | 3 |
| TOTAL COSTS | 121,200 | ||||
According to Table 3, site No. 4 with no existing barrier received the lowest BCI and would be listed as the priority for the improvement among all the sites. Then, sites No. 6, and No. 1, with an average BCI of 1.59, and 1.83, respectively, were categorized as the sites with high-severity damages. The rest of the sites had almost the same condition (good condition for the bridge barrier but a poor condition regarding their end-treatments). These sites were rated as medium-severity damage category. As another finding of the condition assessment at WRIR, end-treatment was listed as the main problem in all the sites evaluated in this study.
Based on Table 4, none of the sites studied in this project have had any crashes in a distance of 300 m (1000 ft) from the barrier system, but site No. 4 with three recorded crashes. Therefore, site No. 4 seems to be the highest priority for an improvement because of its crash history. Moreover, there was no barrier system at site No. 4. Since the rest of the sites did not have any crash recorded, the benefits after the improvement phase were assumed to be the same in each damage-severity category (for example, the same benefits will be received for improving any of the high-severity sites). Then, the prioritized ranking was provided comparing the improvement costs in each damage-severity level. Note that the crash information was provided by Department of Transportation of WRIR for the research team in this work.
This research aimed to provide an initial cost estimate for the improvements based on provided prices by WYDOT website [23]. It should be noted that the costs of mobilization and installation are not included in the cost estimations. Regarding the cost estimation, a total budget of $121,200 is predicted for the materials to meet all the recommended improvements in the study. The cost of the installation and the mobilization should be investigated and added to this rate to predict an estimation regarding the whole improvement budget. More information about the case study done in this research is provided in Molan and Ksaibati [24].
CONCLUSIONS
This research was the first effort regarding establishing a new rating system called Barrier Condition Index (BCI) which would be useful to unify the barrier assessment studies. The new BCI included different variables either from the viewpoint of the geometry (height, offset) or the variables related to the hardware condition (deflection damages, panel condition, posts condition, soil erosion, and the end-treatment condition). The procedure of the barrier assessment was also described by a case study conducted in Wind River Indian Reservation (WRIR), Wyoming. As a summary of the procedure, surveyors need to record all the damages and information related to the barriers condition using the proposed “Barrier Condition Assessment (BCA)” worksheet (Fig. 2). Then, the input of each category (each variable) will be rated based on the criteria presented in Table 1. Finally, as shown in Fig. (3), an average BCI will be given to each barrier system considering different coefficient for each variable (according to their impact on the condition extracted from previous studies). The developed BCI can be implemented in different states to optimize the barrier improvements based on a prioritized ranking. The benefits of using the BCI to obtain such as prioritized ranking can be more clear and significant in large-scale projects including numerous barrier segments. As a further work, the research team will use the current BCI to analyze the barrier segments statewide all around Wyoming in a new project defined by Wyoming Department of Transportation (WYDOT).
CONSCENT FOR PUBLICATION
Not applicable.
CONFLICT OF INTEREST
The authors declare no conflict of interest, financial or otherwise.
ACKNOWLEDGMENTS
The research team wishes to acknowledge Mr. Matt Carlson, the State Highway System Engineer from the Wyoming Department of Transportation, for the financial support in this project. The help of Mr. Bart Evans from the Wyoming Technology Transfer Center and Mr. Howard Brown from the Department of Transportation in Wind River Indian Reservation is appreciated during the data collection.

