All published articles of this journal are available on ScienceDirect.

Analysis and Prediction of Crash Fatalities in Australia
Abstract
Introduction:
As fatalities, injuries, and economic losses from road accidents are a major concern for governments and their citizens, Australia, like other countries, has designed and implemented a wide range of strategies to reduce the rate of road accidents.
Methods:
As part of the strategy design process, data on crash deaths were collected and then analyzed to develop more effective strategies. The data of crash deaths in Australia during the years 1965 to 2018 were analyzed based on gender, causes of crash deaths, and type of road users, and then the results were compared with global averages, then a prediction model was developed to forecast the future annual crash fatalities.
Results:
The results indicate that, based on gender, the rate of male road fatalities in Australia was significantly higher than that of female road fatalities. Whereas based on the cause of death, the first cause of death was over speeding. Based on the type of road users, the drivers and passengers of 4-wheel vehicles had the highest rate of fatalities.
Conclusion:
The prediction model was developed based on Autoregressive Integrated Moving Average (ARIMA) methodology, and annual road fatalities in Australia for the next five years 2019-2022 have been forecast using this model.
1. INTRODUCTION
Road traffic accidents are the main cause of injuries and fatalities around the world. According to the World Health Organization (WHO), approximately 1.2 million people are killed and up to 50 million are injured annually due to road traffic accidents [1].
If current trends continue, road traffic accidents are estimated to be the third top contributor to the global burden of disease and injury by 2020 [2]. The burden of mortalities, disabilities, and injuries due to traffic accidents has a large effect on the health and on the social and economic developments of many nations, especially low- and middle-income countries [3].
Many factors that are considered to contribute to motor vehicle accidents and associated road fatalities have been examined over the last two decades. In general, these factors can be divided into three categories: those associated with vehicles such as technology and design characteristics; those associated with roadways such as speed limits; and those associated with drivers themselves, such as alcohol consumption and seat-belt usage. Most recently, there has been an interest in the effects of cell-phone usage on motor vehicle crashes and fatalities, along with the effects of other socioeconomic and technology factors such as the age of the fleet, education, and suicidal propensities [4].
In Australia, the annual economic cost of road crashes is estimated at A$27 billion, with consequent devastating social impacts. Since record-keeping of road accidents commenced in Australia in 1925, there have been over 190,000 deaths on Australia’s roads. Road trauma levels have declined substantially over the last four decades, however, even though there has been substantial population growth and a three-fold increase in registered motor vehicles. During these recent decades the number of road deaths in Australia per year has fallen from 3,798 deaths in 1970 to 1,226 in 2017 [5].
The current global average of road fatalities is 17.4 deaths per 100,000 persons, with lower-income countries suffering a higher prevalence and higher-income countries seeing lower rates of fatalities. Although Australia’s rate of road fatalities is roughly half that of the USA, the Australian road fatality rate is nearly twice that of the UK’s road fatality rate [6].
Analyzing the relative influence of factors such as gender, age, and type of road users on the rate of fatalities in Australia is a helpful step in the design of effective strategies to reduce the rate of road fatalities.
1.1. Objectives
This study aims to:
- Analyze crash fatalities data in Australia according to several factors, including gender, age, causes of crash deaths, and type of road users; compare the results with global averages, Europe (Denmark as a representative European country), and United States’ results.
- Develop a prediction model for crash fatalities in Australia based on crash fatalities data for the period 1965-2018 by using the Autoregressive Integrated Moving Average modelling method.
- Forecast annual crash fatalities numbers for the five-year period 2019-2023 using the developed prediction model, which can then be used for traffic safety planning.
1.2. Data and Methodology
The information used in this study is based on a variety of sources. Data related to road fatalities in Australia for the period 1965-2018 were acquired from the Australian Government, Department of Infrastructure, Regional Development and Local Government [5]. Data related to fatal car accidents in Australia from 2008 until 2017 were acquired from the National Road Safety Strategy [7].
In this study, data for road fatalities for the period 2008-2017 were analyzed according to gender, age, and type of road users. The results were compared to the USA, Europe (Denmark as a representative European country) and global averages of road fatalities in order to determine the relative effectiveness of Australian road safety strategies.
Based on Box-Jenkins methodology for Autoregressive Integrated Moving Average (ARIMA), annual data for road fatalities in Australia for the period 1965-2018 have been analyzed to develop a prediction model for annual road fatalities in Australia.
The ARIMA model has three parts: 1) The autoregressive part is a linear regression that relates past values of data series to future values; 2) The integrated part indicates how many times the data series has to be differenced to produce a stationary series; and 3) The moving average part relates past forecast errors to future values of the data series [8].
The ARIMA model was expressed by ARIMA (p, d, q), where p, d, and q represent the number of ordinary autoregressive, differences, and moving average parameters, respectively. The p and q were the number of significant lags of the autocorrelation function (ACF) and the partial autocorrelation function (PACF) plots, respectively, and d was the difference order needed to remove ordinary non-stationarity in the mean of the error terms [9].
The method applied to develop the ARIMA forecast model was developed by Box and Jenkins (1976) as follows:
- Examine the stationarity of the time series. If the time series is nonstationary, then the difference and power transformation are applied to it. Thus, the time series converts into a stationary time series with uniform variance.
- Estimate the model parameters p, d, and q for the ARIMA (p, d, q).
- Check the validity of the model; the goodness-of-fit tests are performed using statistical information.
To follow the procedures of Box-Jenkins methodology, the following statistical tests were applied:
- Augmented Dickey-Fuller test was used to examine the stationarity of the data, as recommended by Marilena (2016).
- Mean Absolute Percentage Error (MAPE) and Root Mean Square Error (RMSE) were used to compare models in order to identify the best-fit model, as recommended by Razzaghi et al. (2016).
- Ljung-box, quintile-quintile (q-q) plot of the residuals, and the Kolmogorove-Smirnov test of the residuals were used to test the validity of the developed model, as recommended by Patowary et al. (2018).
Finally, the number of road fatalities for the five-year period 2019-2023 were forecast using the developed model based on road fatality data in Australia for the period 1965-2018.
1.3. Data Analysis
In this study, crash fatalities data were analyzed according to several factors, including gender, age, causes of crashes, and type of road users. The results were compared to those in the United States, Europe (Denmark as a representative European country), and global rates.
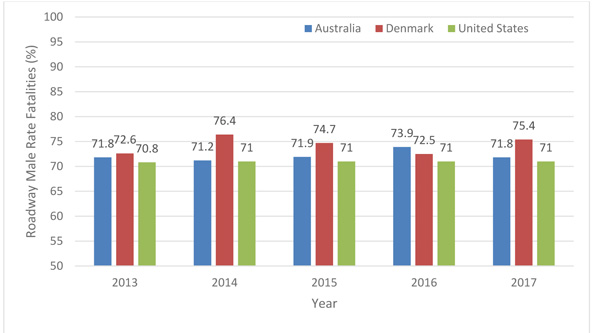
In Australia, based on gender, the results showed that the percentage of male road fatalities is significantly higher than that of female road fatalities. In 2013, 2014, 2015, 2016, and 2017 the percentages of road fatalities that were male were 71.8, 71.2, 71.9, 73.9, and 71.8, respectively [10].
Comparing these results with those of the USA and European countries such as Denmark in 2013, 2014, 2015, 2016, and 2017, the percentage of male road fatalities in the USA were almost equal over those years, with a rate of 71 percent (Insurance Institute for Highway Safety 2017); whereas in Denmark, the percentages of male road fatalities for the subject years were 72.6, 76.4, 74.7, 72.5, and 75.4, respectively [11].
The results in Fig. (1) showed that male fatality rates for the three countries are significantly higher than female fatality rates for the subject five years. The percentages in these countries are broadly similar and range from 71 percent to 76.4 percent over the five-year period of 2013-2017.
The results indicate that for the five-year period 2013-2017, the percentage of male road fatalities in Australia was slightly higher than for the USA and three to five percentage points lower than for Denmark.
An explanation of the high rates of road fatalities for males compared to female road fatalities is provided by Storie (1977) [12]. In his study, significant differences in driving characteristics were found between males and females with regard to speed, skill, and attitude. Females were more likely to drive at lower speeds and overtake more carefully. Although males were generally more skillful and better able to perform difficult maneuvers, they were more likely to engage in risky driving behavior, especially under the influence of alcohol. Moreover, usually, the number of miles driven by females is less than the number of miles driven by males.
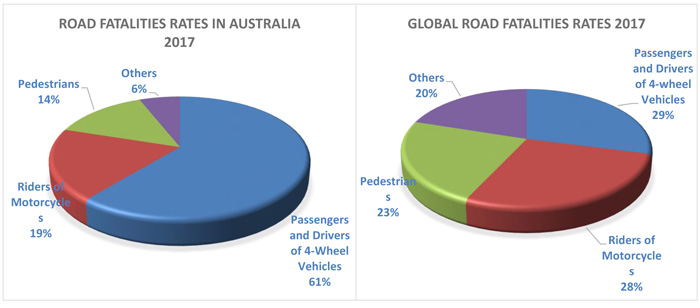
Based on the type of road user, the World Health Organization report [13] noted that in 2017, drivers and passengers of 4-wheel vehicles in Australia had the highest per-capita fatality rate, followed by riders of motorcycles and pedestrians, with rates of 61 percent, 19 percent, and 14 percent, respectively. The global rates for the same year (2017) recorded drivers and passengers of 4-wheel vehicles with the highest fatality rate, followed by riders of motorcycles and pedestrians, with values of 29 percent, 28 percent, and 23 percent, respectively, as shown in Fig. (2).
Although the fatality rates for drivers and pedestrians of 4-wheel vehicles in Australia were higher than global averages, the fatality rate for motorcycle riders and pedestrians were lower than the global averages for 2017. Since 4-wheel vehicle can carry more passengers, it has a higher rate of fatalities; in other words, jumping out of a commercial airplane without a parachute has a much lower fatality rate than staying seated and belted in an airplane.
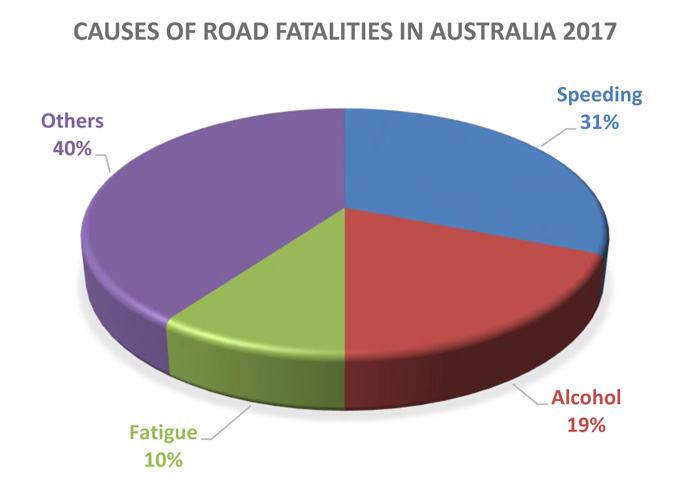
Based on crash deaths causes, WHO report (2018) based on 2017 data, showed that the first cause of deaths was speeding, the second cause was alcohol, and the third cause was fatigue; with 31, 19, and 10 percent respectively, as shown in Fig. (3).
These results are consistent with the global averages since the global averages indicated that speeding is the first cause of crash deaths. The WHO report (2018) concluded that the most significant way to reduce the number of crash fatalities is to reduce the average speed. Moreover, a 5% reduction in average speed can reduce the number of fatalities by 30%.
This study faced various limitations that prevented authors from extending the analysis to include the age factor of the crash fatalities; the most serious limitations were the absence of Australian mileage driven by each age category and using different age intervals from those used in united states and global standards.
1.4. Prediction Model
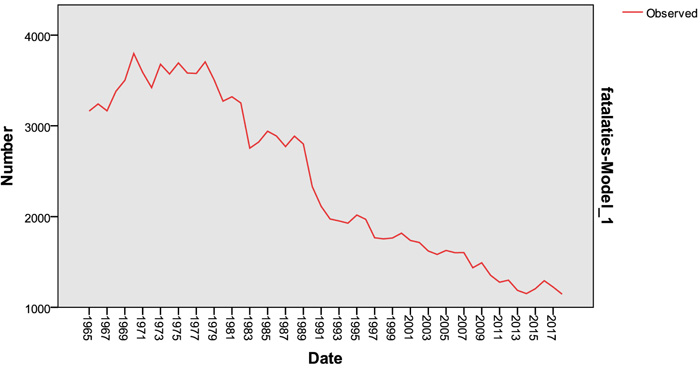
Annual road fatalities in Australia for the 53-year period 1965-2018 were used to develop the Autoregressive Integrated Moving Average (ARIMA) model in order to forecast annual road fatalities. By applying the methodology of Box and Jenkins (1976) [14], the time series of road fatalities for these years was plotted in order to determine the underlying trend, seasonality, and stationarity pattern of the time series. The time series in Fig. (4) shows a nonstationary pattern.
An augmented Dickey-Fuller test was applied using SPSS 23 software to determine the stationarity of the series. This test showed that the probability (P-value) was 0.335, the null hypothesis should not be rejected, and therefore the series was nonstationary.
To apply the ARIMA model the time series should be stationary; therefore, the series should be transformed into a stationary series, and thus the first difference (d=1) was applied to the series. Even though the result of the augmented Dickey-Fuller test after applying the first difference showed that the probability (P-value) was 0.112, the null hypothesis should not be rejected, and therefore the series was still nonstationary. Finally, the second difference was applied to the time series, and the result of the augmented Dickey-Fuller test showed that the probability (P-value) was 0.010, the null hypothesis should be rejected, and instead, the alternative hypothesis can be accepted, and therefore the time series was stationary. As a result, the second difference (d=2) should be used in order to find the best-fit ARIMA model.
By using the second difference (d=2), all possible models were developed. Root Mean Squared Error (RMSE) and Mean Absolute Percentage Error (MAPE) were used in order to diagnose the best-fit model, as in Table 1.
| Model | Number of Predictors | Model Fit Statistics | Ljung-Box Q(18) | ||||||
|---|---|---|---|---|---|---|---|---|---|
| Stationary R-squared |
R-squared | RMSE | MAPE | Normalized BIC | Statistics | DF | Sig. | ||
| (1,2,1) | 0 | 0.448 | 0.970 | 158.845 | 4.897 | 10.364 | 16.915 | 16 | 0.391 |
| (1,2,0) | 0 | 0.169 | 0.956 | 192.823 | 6.331 | 10.676 | 36.599 | 17 | 0.004 |
| (0,2,1) | 0 | 0.448 | 0.970 | 157.251 | 4.890 | 10.268 | 16.593 | 17 | 0.482 |
| (2,2,0) | 0 | 0.369 | 0.966 | 169.814 | 5.808 | 10.497 | 32.333 | 16 | 0.009 |
| (0,2,2) | 0 | 0.452 | 0.970 | 159.325 | 4.883 | 10.370 | 22.163 | 16 | 0.138 |
| (2,2,1) | 0 | 0.476 | 0.972 | 156.378 | 5.058 | 10.408 | 18.866 | 15 | 0.220 |
| (1,2,2) | 0 | 0.497 | 0.973 | 153.102 | 4.746 | 10.366 | 20.512 | 15 | 0.153 |
| (0,2,0) | 0 | 0.000 | 0.946 | 209.497 | 6.934 | 10.765 | 42.554 | 18 | 0.001 |
| (2,2,2) | 0 | 0.517 | 0.974 | 151.695 | 4.743 | 10.424 | 18.455 | 14 | 0.187 |
The results showed that the ARIMA (2, 2, 2) model had the lowest values for RMSE and MAPE; furthermore, the stationary R-squared and R-squared were the highest for this model. Therefore, this model was determined to be the best-fit model and the validity of this model was then tested.
To test the validity of the ARIMA (2, 2, 2) model, the Ljung-Box test was applied to determine the independence of the residuals and the results showed that the significant P-value was 0.187; therefore, the null hypothesis for the independence of residuals cannot be rejected, and thus the residuals are independent.
Moreover, the Kolmogrove-Smirnov test was applied in order to determine the normality of the residuals. The significant P-value was 0.065; therefore, the null hypothesis should not be rejected, and thus the residuals follow the normal distribution.
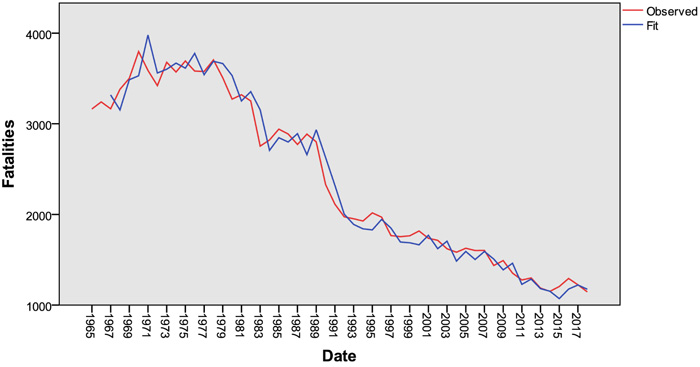
The Arima (2, 2, 2) model represented in Equation 1 was determined to be the best-fit model for predicting road fatalities in Australia. The curves of the observed values and predicted values are shown in Fig. (5).
Δ(Yt, 2) = -1.482-0.850Yt-1-0.216Yt-2-0.102εt-1+0.896εt-2 (1)
Yt: is the road fatalities forecast at time (year) t.
Yt-1 and Yt-1: are the road fatalities at time lags t-1 and t-2
εt-1 and εt-2: are the error terms at time t-1 and t-2
Finally, the developed model was used to predict road fatalities in Australia for the five-year period of 2019-2023. The forecast annual road fatalities for 2019, 2020, 2021, 2022, and 2023 were 1102, 1054, 998, 947, and 891, respectively. Thus, this is where we will get if we continue current level of interventions.
CONCLUSION
After analyzing road accidents and road fatality data in Australia for the period 2014-2017 based on factors of age, gender, and type of road users, and using annual road fatalities for the period 1965-2018 to develop a road fatality forecast model in order to forecast future road fatalities, four conclusions are given as follows:
- Based on gender, the rate of male road fatalities in Australia was significantly higher than the rate of female road fatalities for all years for the period 2014-2017; this higher male road fatalities rate was greater than 70 percent during these years. This result was consistent with those of other countries, such as the USA and Denmark, for the same period, 2014-2017.
- Based on the cause of crash death, speeding was the first cause of death in Australia; This result was consistent with the global averages, since the global averages indicated that speeding was the first cause of crash deaths as well.
- Among the different types of road users, the drivers and passengers of 4-wheel vehicles had the highest rate of fatalities; this rate was higher than the global average rate for 2016, according to the World Health Organization report of 2018.
- An Autoregressive Integrated Moving Average (ARIMA) model was developed to forecast annual road fatalities in Australia. The number of road fatalities for the next five years, 2019 to 2023, was forecast using this model.
CONSENT FOR PUBLICATION
Not applicable.
AVAILABILITY OF DATA AND MATERIALS
Not applicable.
FUNDING
None.
CONFLICT OF INTEREST
The authors declare no conflict of interest, financial or otherwise.
ACKNOWLEDGEMENTS
Declared none.

