All published articles of this journal are available on ScienceDirect.

Non-Motorized Trip Pattern in Sub-Saharan Africa: Assessment of Walk Trip
Abstract
Background:
Walking as a parent mode of transportation has received little or no attention regarding planning, design, and development, thereby leading to chaotic outcomes when it comes to controlling and future estimation in most sub-Saharan Africa countries. This necessitated the research on the pertinent factors and variables that affect walking as a means of transportation in the study area, a semi-urban industrial cluster in South-Western Nigeria.
Methods:
One Thousand five hundred (1500) information cards were distributed for seven months. This was done to accumulate information on trip patterns, modal split, walk trip volume and so on. The data obtained was analysed using SPSS version 23.
Results:
The result revealed that 53.2% of the respondent engages in a walk trip every day either to access mode, access sub-mode or for recreation purposes. The commercial zone showed the highest percentage of walk trips of 40%. The mathematical model showed that age and walk trips are inversely proportional. Based on the result of the analysis, cost, safety and exercise are the primary reason why people engage in a walking trip. The R2 value of 0.83 established the robustness of the model.
Conclusion:
The created model can be utilized for anticipating the future modular part by inputting anticipated future estimation of exploratory variables, which will also aid the planning of a better transport system for the locality. The lack of essential infrastructure poses a big problem for the utilisation of this mode of transportation.
1. INTRODUCTION
Walking is the oldest, safest and most common means of transportation. It is appealing to all and requires no technical skill. Despite the unique attribute of this mode, it lacks the necessary transportation facilities in most countries in Africa. Walking as a transport mode has received much attention in most developed countries. However, little or no attention has been given to this mode in terms of necessary pedestrian facilities, which makes the research critical in Nigeria, a developing country in Sub-Haran Africa. Moreover, in Nigeria and similar countries in the world, there is a significant dependence on the motorised trip. Over-dependence on motorised trips has created so many environmental and health problems. In a bid to make the world a cleaner place, the use of non-motorized trips should be encouraged towards sustainable transportation and hence, the research.
Walking as a transport mode is unique because no technical skill is required, and the accident rate is quite low compared with other modes of transportation. Additionally, it can be performed at different intensity and speed, based on individual strength. Walking trip, according to James et al. [1], is a trip with a distance of about 2km. However, Tudor-Locke [2], opined that people walk farther than 2km daily; some adults walk up to five times this distance. This was supported by the research of Krizek [3], and McCormack [4], the authors opined that based on the purpose of the trip, people engage in a walk trip for up to 400m (0.25miles). This is also in agreement with the findings of Hoehner [5], McDonald [6], McDonald [7], McDonald [8], Mcmillan [9], Sharples and Fletcher [10], and Yaser [11]. However, these authors asserted that embarking on this distance is subjected to so many conditions. The management of the transportation system in terms of the provision of necessary pedestrian facilities and geometric layout is the basic component of the pedestrian environment. Apart from this, other factors affect the choice of walking for a daily trip by pedestrians (McCormack [4]. Pedestrian facilities' location, to a vast extent, affects its usage as a crossing facility by pedestrians. The effect of speed on walking as transport mode was investigated in the work of Frank [12]. Research by IHT [1], revealed that aggressive headlight is another factor why walk may not be a suitable transportation mode. The use of Zebra crossing is crucial in the design of pedestrian facilities based on the findings of Sharples and Fletcher [10]. The more the use of urban public space, the more the walking trip Living streets [13].
It is worthy to note that land use, to a very great extent, affects the location of service impact for pedestrian walk trip. The research of Living Streets [13]; Lansley [14]; Busari [15], showed that land use, urban morphology and pedestrian networks affect walk trip. Other factors that affect walk trips include school journeys Bradshaw and Jones [16] and the use of interchanges Stradling [17].
Gender is another factor affecting the choice of walk trip (McDonald [3]; Hsu and Jean-Daniel [18]; Guliani [19]. The outcome of the research by McDonald [3]; McMillan [20]; Marten and Olds [21]; Johnson et al. [22], revealed that boys tend to walk than girls. However, the research of McDonald [3], and Wilson [23] showed an inverse relationship between walk trip and age. Car ownership has been found to have a positive relationship with trip volume, according to Busari [24]. However, access to private cars showed a negative effect on walking as a modal choice as discussed by Park [25]; Copperman and Bhat [26]; Busari [23] and Mackett [27]. Furthermore, active travellers are vulnerable travellers. A high percentage of people who are seriously injured in road traffic crashes are from low- and middle-income countries, and most of the casualties are pedestrians and cyclists. In addition, according to the Federal Road Safety Commission (FRSC) of Nigeria, many victims of road traffic crashes are vulnerable road users or active travellers. Therefore, many researches have been carried out in developed countries as seen in Table 1 [28-39], while a dearth of literature exists on walking as a modal choice in developing countries lot work has been done on walking as a moral choice viz:
Transportation in Nigeria is a peculiar one, it is predominantly road-based, and the available road infrastructure is hugely overstretched. Lagos residents rely heavily on informal paratransit modes such as danfos as well as taxi services such as kekes (three-wheelers) and okadas, Ministry of Land, Infrastructure, and Transport [40].
The trend toward increased motorisation is especially dangerous for the most vulnerable populations. Crash statistics show an increasing trend over time, with vulnerable road users such as cyclists and pedestrians accounting for a majority of the traffic deaths, even though these groups often have little or no access to the mobility benefits from motorisation.
Walking as a modal choice has not received so much attention in Nigeria. This is partly because highway planning standards do not consciously recognize them as an integral part of the traffic in the planning of new transport facilities. The diverse mix of transport services helps meet critical mobility needs but also creates a challenging environment for walking and cycling. Additionally, while walking has become an essential research topic in developed countries, it has not received enough attention in developing countries, which spurred the research.
| S/N | Description | Authors |
|---|---|---|
| 1 | Health Perspective | Basset [28] |
| 2 | Commuting patterns and travel preferences of members of the university | Shannon [29] and Whalen [30] |
| 3 | Conducted a study on how to make more cycling useful for road safety | Wegman [31] |
| 4 | Examined active travel behaviour models. | Burbidge and Goulias [32] |
| 5 | Developed and established the test-retest reliability | Ogilvie et al. [33] |
| 6 | Active travel behaviour and age, as well as health | Mattson [34], Morelli [35], Ryley [36], |
| 7 | Gender, security concerns, time of the day, and social concerns | Gropp [37]; Morelli [35], |
| 8 | Marital status | Ryley [36], |
| 9 | Income | Morelli [35], |
| 10 | Fitness, environmental concerns, and domestic responsibilities. | Morelli [35]; Ryley [36]; Whalen [38], |
| 11 | Evaluated active transport benefits and costs and came up with a useful guide on factors that affect active travel demand. | Litman [39] |
2. METHODOLOGY
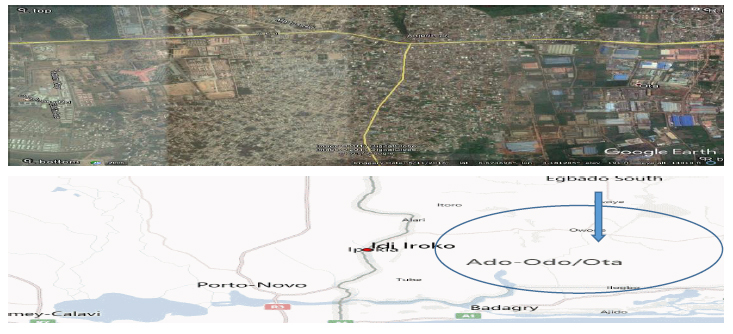
2.1. Description of the Study Area
Ogun state is in the south-western part of Nigeria and was created in 1976 with an area of 16,980.55 km2 (6,556.23 sq. mi). It has an estimated population number of 527,242 with 261,523 males and 265,719 females. Ota is the capital of Ado-odo/Ota local government area. The national population census conducted in 2006 estimated the total population to be about 3,751,140, comprising of 1,864,907 males and 1,886,233 females ranking the 16th position in populace out of 36 states in Nigeria. Ota is known to be the third most populated industrial zone in Nigeria. Ota is gradually becoming a busy place because of its proximity to Lagos, thereby increasing the migration of people Olukanni and Akinyinka [41].
2.2. Strategy for Data Collection
Question forms were distributed evenly to adults (18years and above) who embark on independent trips virtually daily either for a work trip and non-work trip purposes. This strategy was adopted to be able to extract information that will help predict future trip patterns.
2.3. Sampling Procedure/Land Use
In achieving the aim of this research, the study area was stratified into three (3) homogeneous zones viz:
- Industrial Zone
- Educational Zone
- Commercial Zone
These areas were chosen to reflect the characteristics of a particular residential land use type. In the administration of the questionnaire, a total of one thousand five hundred questionnaires (1500) were administered to respondents of the neighbourhoods with a 78% return rate. To ensure an even distribution of the questionnaire, a systematic sampling technique of selecting respondents was carried according to O’Flaherty [42]. In this study, the following inclusion criteria were applied as adopted by Collins [43]:
- Participants who were 18 years of age and above
- Participants who were willing to give their informed consent to participate in the study.
2.4. Instrument for Data Collection
Data collection (questionnaire administration) was carried out based on the land use of the study area. All residential zone in the study area were captured. Focus Discussion Group (FDG) was also adopted in gathering information on other factors affecting the choice of walking as a modal choice.
2.5. Sampling Technique
The questionnaire was designed to gather information on demography, socio-economic parameters, modal choice and trips pattern and travel behaviours among research participants. Additionally, a Quantitative paradigm was used to measure the numeric information using a structured questionnaire.
2.6. Data Analysis and Management
SPSS version 21 and Micro-soft excel were used in the analysis of the collected data. Data of respondents will be captured manually. The data was coded, all dates removed, and coded (WTR-001, WTR-002, etc.) as adopted by Bocar et al., (2019) to preserve confidentiality before any data analysis.
3. RESULT AND DISCUSSION
3.1. Modal Split of the Study Area
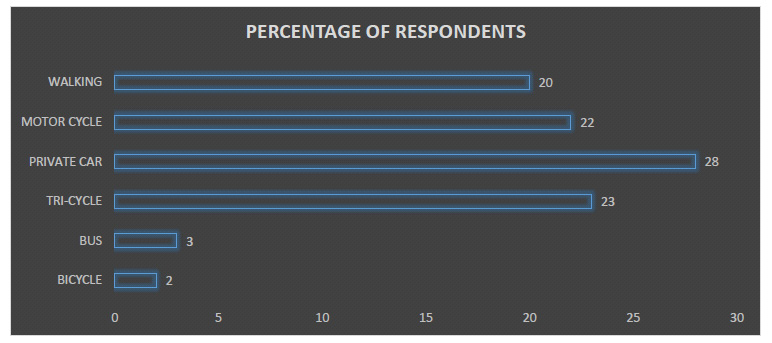
The result of the analysis showed that for both work and non-work trip, 20% of the respondent chose walking as the modal choice (Fig. 1). Often they engage in this mode of transportation to access mode or access sub-mode. The use of personal car accounts for the highest percent based on the modal split. This may account for the traffic congestion on a major arterial road in the study area. Despite the need for a non-motorized trip based on fuel consumption and pollution, the bicycle still had the lowest percentage of (2%). The result of the oral interview showed that most respondents do not consider this mode based on safety as there are no facilities for this mode of transportation. The use of tri-cycle and bicycle had 23% and 22% (Fig. 2).
3.2. Daily Trip Pattern of Work Trip and Non-Work Trip Using Walking as a Modal Choice
The trip pattern indicates the number of days’ respondents engage in a walking trip. The result revealed that 53.2% of the respondent engage in a walking trip every day. This showed the walking as a modal choice. Therefore, the need for facilities for this purpose is required in the road construction process. Only 2.7% walked two times daily, while none of the respondents chose one day in a week (Fig. 3).
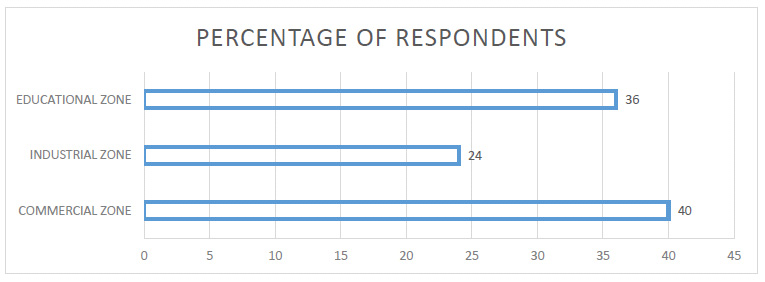
3.3. Land Use Approach
Three land-use zones were considered for the analysis. The educational zone showed 36% use of walk trips for both recreational and work trips (Fig. 4). The commercial area showed the highest percentage of walk trips of 40%. However, walk trips are majorly used in this zone to access mode. Oral interview of respondent stated that walk trip in the commercial area is made to access mode or sub-mode. Most of the respondents indicated that it is faster than walking. Additionally, the flexibility of some of the para-transit vehicles like motorcycle and tri-cycle also encourages the continuous patronage of this mode.
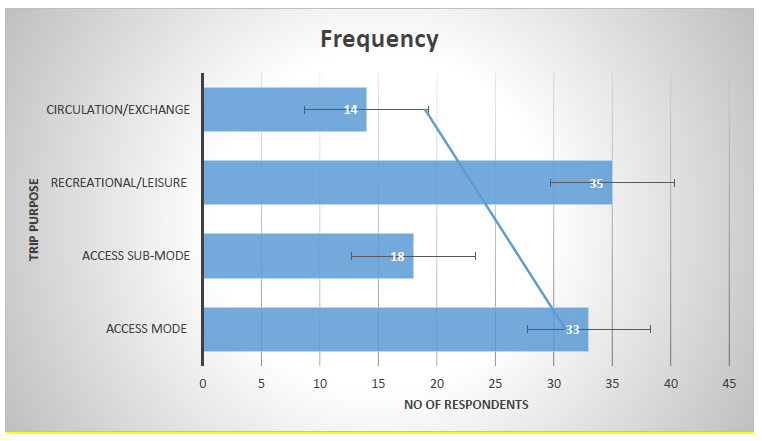
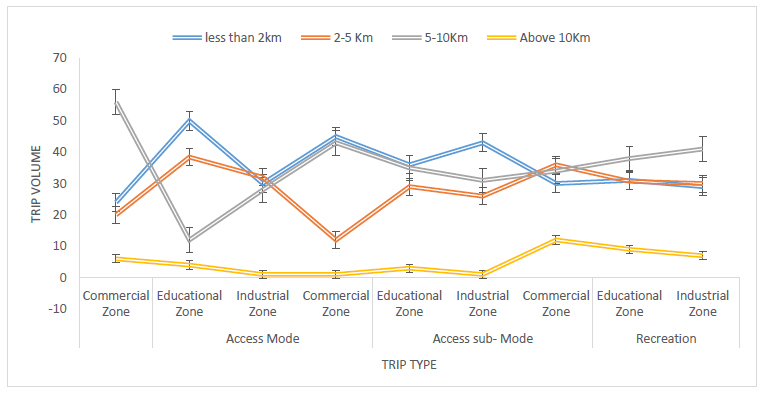
3.4. Assessment of Walk Trips Considering the Access Mode
Tolley [44] defines four different types of walking:
- Access Mode
- Access sub-mode
- Recreational/leisure
- Circulation/Exchange.
From the figure above, 35% of the respondents stated that they engage in a walking trip for recreational purposes and leisure. This also encompasses friend visitation in the information card used. 33% use the mode of transportation to access mode, while 18% use it to assess sub-mode (Fig. 5).
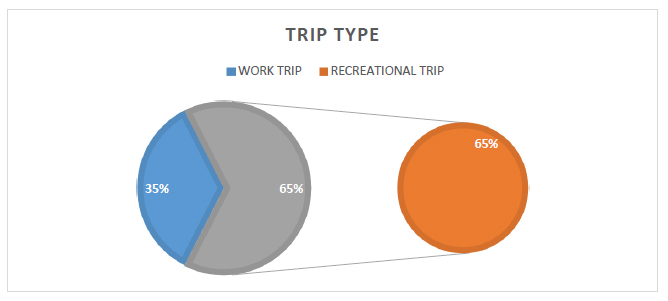
The result of the comparative assessment of work trip and the non-work trip also showed that most respondents in the study area (65%) engage in walk trip for recreational purposes. The distance of the trip is an essential criterion in walk trip Busari [45, 46]. The result of the analysis followed a similar trend with the author as only 35% of the respondents adopt walking for work purposes (Fig. 6).
3.5. Multiple Regression Result of the Factor Affecting Walk Trip
The result revealed that a positive relationship exists between walk and income. Based on the oral interview conducted, some high-income earners prefer this mode for recreational activities, exercise and health purposes. However, age and walk trips are inversely proportional. The higher the age, the lower the trip volume. The same holds for the cost of the trip. The R2 value of 0.83 established the robustness of the model.

| Coefficients | ||||||
|---|---|---|---|---|---|---|
| Model | Unstandardized Coefficients | Standardised Coefficients | t | Sig. | ||
| B | Std. Error | Beta | ||||
| 1 | (Constant) | 2.311 | .100 | 10.421 | .000 | |
| Trip Cost | -.0045 | .003 | -.192 | -1.631 | .002 | |
| Age | .081 | .025 | .178 | 3.222 | .001 | |
| Montly Income | .007 | .027 | .014 | .257 | .797 | |
| 2 | Trip Cost | 0.0341 | 0.076 | .011 | 2.211 | .001 |
| 3 | Distance | 1.99 | 0.054 | .023 | 1.07 | .043 |
| 4 | Family Size | 2.32 | 0.0064 | .081 | .098 | .031 |
| Y=2.311 + 0.0045 (monthly income) -0.078 (age) – 0.0341 (trip cost) – 1.99(distance) + 2.32 (family size) | (eq.1) |
Where:
b0 = constant
b1 = monthly income
b2 = age
b3 = trip cost
b4 = distance
b5 = family size
Bivariate analysis of the frequency of walk trip with age and income status
The above table showed a positive correlation. This infers that there is a correlation between the age of the respondent to how often the responder walks (Table 2). The result showed that it is positively correlated with a (0.808 and 1) strength of linkage using Pearson correlation. This followed a similar trend with the correlation of frequency of trip and income (Table 3).
3.6. The Effect of Trip Distance on Walk Trip
Trip distance is a decisive factor affecting walking trips as avowed by Busari [45]. The result of the analysis showed a similar trend. For a trip distance of 10km and above, only a few respondents use walking as a mode (Table 4). However, the trip less than 2km had the highest percentage of respondents. From this, it can be deduced that the higher the trip distance, the lower the walking trip (Fig. 7).
3.7. Pros and Cons of Non-Motorized Trip
The pros and cons of this mode of transportation involve the improvement of both physical and mental health. Additionally, if this mode of transportation is encouraged, there will be a reduction in air pollution, thereby making the world a better and a cleaner place. However, there are no pedestrian facilities in the area to accommodate this mode of transportation. The lack of essential infrastructure poses a big problem for the utilisation of this mode of transportation. Additionally, security issues should be taken care of to encourage people to adopt this mode of transportation.
| Walk Trip | Age | ||
|---|---|---|---|
| Frequency of walk trip | Pearson Correlation | 1 | .808** |
| Sig. (2-tailed) | 0 | ||
| N | 472 | 472 | |
| Age | Pearson Correlation | .208** | 1 |
| Sig. (2-tailed) | 0 | ||
| N | 472 | 472 | |
| - | Gender | level_of_Education | |
|---|---|---|---|
| Frequency of Walk Trip | Pearson Correlation | 1 | .584** |
| Sig. (2-tailed) | - | 0 | |
| N | 472 | 472 | |
| Income | Pearson Correlation | .584** | 1 |
| Sig. (2-tailed) | 0 | - | |
| N | 472 | 472 | |
3.7.1. Factors Affecting Walk Trip.
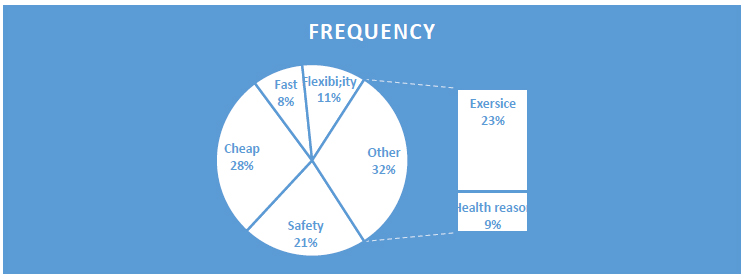
Based on the result of the analysis, cost, safety and exercise are the primary reason why people engage in a walking trip with 28%, 21% and 23% values, respectively. However, flexibility and speed showed the lowest percentages as some paratransit modes like motorcycle and tricycle can perform these functions (Fig. 8).
CONCLUSION
This research assessed walking as a modal choice in a semi-urban industrial cluster. Three zones were evaluated based on the land use of the study area. A descriptive model was developed using multiple regression. Walk as a modal choice was also assessed using land-use approach and trip distance. Assessment of the germane factors affecting the use of walking as a mode of transportation was also done. It can be concluded from the research that:
- The result revealed that 53.2% of the respondent engage in walk trip every day either to access mode, access sub-mode or for recreation purpose.
- Commercial zone showed the highest percentage of walk trip of 40%.
- The mathematical model showed that age and walk trip are inversely proportional. The same holds for the cost of the trip. The R2 value of 0.83 established the robustness of the model.
- The result revealed that a positive relationship exists between walk and income.
- For a trip distance of 10km and above, only a few respondents use walking as a mode. However, the trip less than 2km had the highest percentage of respondents.
- Based on the result of the analysis, cost, safety and exercise are the primary reason why people engage in a walk trip.
- The lack of essential infrastructure poses a big problem for the utilisation of this mode of transportation.
CONSENT FOR PUBLICATION
Not applicable.
AVAILABILITY OF DATA AND MATERIALS
Not applicable.
FUNDING
None.
CONFLICT OF INTEREST
The author declares no conflict of interest, financial or otherwise.
ACKNOWLEDGEMENTS
Declared none.

