All published articles of this journal are available on ScienceDirect.

Waiting Time of Public Transport Passengers in Jordan: Magnitude and Cost
Authors Info & Affiliations
Abstract
Aim:
This paper is a research study investigating the magnitude and cost of waiting time as experienced by public transport users in Jordan. This study also used spatial analysis to measure services provided for public transport routes according to the average waiting time.
Methods:
The data for waiting time of public transport users were collected using field observation and a professional spatial analysis applied to identify several locations experiencing short time delays.
Results:
This study found a relationship between the total costs of waiting time, including wasted time and money, and revealed that the money spent by the passengers was more than their average monthly income.
Conclusion:
The findings can be used as valuable information for researchers, government policy-makers, and transport agencies to firstly, develop more punctual public transport modes; and secondly, manage public transport trips to minimize time delays.
1. INTRODUCTION
Public transport is an integrated and important sector of urban life; it characterizes the movement of people living in different cities. The essence of public transport is to provide a facility to passengers to move easily from one place to another [1]. It helps define the social features and economic development of a city [2]. The functioning of public transport in developed countries has improved due to updated and modified control systems and facilities compared to those operating in other developing countries. A study showed that public transport systems in most developing countries do not satisfy travelers’ needs due to some problems in the service being provided [3]. Public transportation systems in developing countries still need a great deal of time, effort and money to rebuild and be integrated so that they operate efficiently. Jordan is a developing market economy with a public transport sector under development, and it incorporates only three modes of transport: buses, mini-buses and public taxis. According to the country’s Department of Statistics (2016), the number of buses was about 300, while minibuses and public taxis were 200 and 3000 in number, respectively.
In order to assess how well public transport functions, performance measures are often used, as they are considered to be significant factors. One of the most important indicators used to measure the performance of a public transport system is passengers’ waiting time. Passengers in Jordan habitually have to wait for public transport at terminals and stop stations; thus, much of their time is spent on waiting, trying to reach their destination. For this reason, waiting time is an important measure used to estimate the costs of time and delay for public transport users [4]. In addition, the waiting time for public transport users is a significant indicator of time delays during peak and off-peak hours. As confirmed by many researchers, the waiting time during peak hours is longer than during off-peak hours [5]. It has been found that waiting time depends on many factors, mainly the level of traffic along designated routes, the speed of the transit system and the mobility of transit modes during the trip [4].
Research studies have confirmed that passenger movement towards the terminals and stop stations is uniform [6]. It means that human travel patterns using public transport routes are consistent, and the flow of users is generally the same. Waiting time is indicative of the time wasted by public transport users. Consequently, this problem directly affects and is closely linked to the economic status and well-being of public transport users.
The World Bank (2018) reported that most people in Jordan have a poor socio-economic and demographic status compared with developed and other developing countries in the same region such as Qatar, Saudi Arabia, and the United Arab Emirates. A report published by Numbeo (2017)1 revealed that Jordan ranks around 65th globally in terms of average net salary, with an average monthly income of about US$637. According to another report from Economist Intelligence (2017)2, Amman ranked 29th globally for the cost of living. Consequently, the delays and long waiting times can cause much financial loss for public transport users. This problem only increases the total expenses and costs for users. It directly affects the working hours of people and their salaries by increasing transport costs. The average working hours in the public sector in Jordan is about forty-eight hours over five days. However, in the private sector, work can be extended to fifty-four hours over a six-day week. The pay system takes seven days into calculation [7].
This research aims to investigate the average waiting time for public transport users in Jordan. Three main issues are investigated in this paper. The first issue is the accessibility of public transport in all parts of the study area. The second issue concerns how transport modes can affect the average waiting time of users. The third issue is the relationship between the punctuality/reliability of public transport modes and the average waiting time.
2. LITERATURE REVIEW
The waiting time performance measure is used to assess the level of service provided by public transport, depending on the arrival and departure time of public transport vehicles [8]. It was studied how the length of waiting time affects the satisfaction of passengers with public transport. However, the length of waiting time depends on several factors, including the number of stops, bus model and size, time of the day, and whether public transport is running in peak or off-peak hours [9]. Waiting time is measured on the assumption that the passengers arrive at public transport stations uniformly, and that the ridership at the peak time is higher than in the off-peak hours. Therefore, the waiting time at peak hours is the highest [10].
Although there has been a significant increase in the number of passenger cars in the last decade, an efficient public transport system is still in demand as an effective mode of transportation. It is expected to carry a large number of passengers every day from their homes to their destinations. The destinations of public transport users vary according to trip targets. For instance, the destination of a student would be a school, college or university. The following points below explain the trip targets of public transport users.
Business trips: “on-the-clock” trips include a trip as part of a job or along the lines of “time is money”. Employers in charge of businesses either pay directly for workers who suffer from traffic delays by paying them to work extra hours or indirectly through less workplace productivity. Therefore, the overall production output of the companies is affected. It is significant for countries, their communities and entrepreneurs who understand and account for the value and cost of business trip time and the hourly cost. Commute trips include traveling between home and the workplace. Many studies focused on the costs and on finding radical solutions for wasted time on these commute trips. The analyses revealed that businesses eventually ended up spending more money to attract and maintain workers in some urban areas. The transportation costs for workers were very high, so the companies tried to pay extra wages to attract labor. These expenses should be considered or allocated as a business productivity cost (NCHRP, 2001)3. Personal trips are those scheduled for any other personal work. For instance, saving time through private trips is a great value to passengers, because this does not have a direct impact on their income and, as such, has not been accounted for in any analysis so far.
Finally, there is the possibility that passengers’ perceptions of public transportation are vastly different compared to car travel. Public transport can provide a greater value for the cost of a trip, and here customers can use the actual travel cost and time for other productive and/or recreational activities .This is likely to be applied in situations where passengers feel comfortable. However, public transport can provide more low-cost travel even if users have to wait for a long time. Public transport waiting time should be reduced to improve the efficiency of services. This can be achieved in three ways: the first is to improve services provided, for example, by rescheduling arrival and departure times. The second method is to find alternative ways of public transport to avoid traffic congestions, and the third way of reducing waiting time is to improve information systems, e.g. real time information systems that can help public transport users to adjust their departure times in such a way that waiting time is reduced [9].
For the purpose of improving public transport services and reducing costs associated with waiting time, three methods were introduced [10], and which were later improved by some experts [11]. The first method is associated with reducing the public transit costs, by looking at the fare/pricing structures. The second method, for those travelling between private and public transport, refers to the difference between public transport fares and the costs of operating privately owned vehicles, including fuel, parking, and maintenance. The third method is linked to the potential ownership costs of privately owned vehicles. It is stated that utilizing public transport is more cost-effective over the long-term, since the price of a privately owned car will decrease; malignancy and insurance costs will also increase as the time passes by [12]. Besides, improving the way cities are planned decreases trip times, travel mileage and transport emissions; in this regard, several studies recommend smaller cities where all service centres are adjacent. These are some suggested ways for reducing the overall waiting time [13, 14].
2.1. Background
2.1.1. Trip Destinations
Although, there has been a significant increase in the numbers of passenger cars over the last decade, efficient and effective public transport is still in demand. It is expected to carry a large number of people every day from their homes to their destination. The destinations of public transport users vary according to trip targets. For example, the destination of students is usually their school, college or university. The following points explain the trip targets of public transport users:
- Business trips: “on-the-clock” trips can be part of the job or along the lines of “time is money”. Employers in charge of businesses or workers either pay directly for traffic delays by paying for personnels to work extra hours or indirectly through less workplace productivity, and the overall production output for the companies is affected. It is a significant issue for countries, their communities and entrepreneurs who understand and account for the value and cost of business trip time and the hourly cost.
- Commute trips: These include travelling between home and the workplace. Many studies focused on the costs and on finding radical solutions for time wasted on these commute trips. Their analyses revealed that businesses eventually ended up spending more money to attract and maintain workers in some urban areas. Transportation costs for workers were very high so the companies resorted to paying extra wages to attract labor. This cost should be considered or allocated as a business productivity cost (NCHRP, 2001)4.
- Personal trips: These are the trips scheduled for any other purpose. For instance, saving time on private trips is of great value for passengers as this does not have an impact on income directly. No analyses have yet been undertaken on the private valuation of waiting time reduction for “personal” trips.
Finally, there is the possibility that passengers’ perceptions of public transportation are vastly different compared to car travel. Public transport can offer more low-cost travelling services even if users have to wait for a longer time.
2.2. Congestion Cost
Public transport waiting time should be reduced to improve public transport services. This can be achieved in two ways: the first is to improve services provided, for example, by rescheduling arrival and departure times. The second method is to find alternative ways of public transport to avoid traffic congestion [8]. In the U.S., congestion cost $305 billion in 2017. For instance, in Los Angeles, the congestion costs the city more than US$19 billion annually. Also, New York City has a higher annual congestion cost, being US$33.7 billion5.
This research aims to investigate the average waiting time of public transport users in Jordan. Three main issues are investigated. The first issue is the accessibility of public transport in all parts of the study area. The second issue concerns how the transport modes can affect the average waiting time of users. The third issue accounts for the relationship between the punctuality/reliability of public transport modes and the average waiting time.
2.2.1. Research Questions and Hypotheses
The current study is expected to help regulators in Jordan to efficiently manage and implement the public transport system, and aid them in understanding average costs of waiting time for public transport passengers. The study seeks to answer the following research questions:
- RQ1: What is the average waiting time for public transport users in Jordan during peak and off-peak hours?
- RQ1A: What is the real situation regarding accessibility to the public transport system in Jordan?
- RQ1B: Does mobility have an impact on the average waiting times for public transport users in Jordan?
- RQ1C: Is the average waiting time for public transport users affected by the punctuality of modes of public transport?
- RQ2: What is the average waiting time cost for users?
The following research hypotheses are proposed for this study: - H01: The average waiting time for public transport users is improved when the transport system is punctual.
- H02: The cost of the average waiting time exerts a negative impact on public transport users, and has implications for other expenses.
3. METHODOLOGY
In this study, the collection of waiting time data focused on field observation. The waiting time was measured starting from the time when people arrive at terminals, until the departure time by public transit modes. The calculations included the time spent inside public transit vehicles. The study team consisted of three people: one person at the starting point (Terminal A); another at the end point (Terminal B); and the third person using public transit modes continuously as a passenger. The waiting time was recorded for both endpoints along the routes, by recording the time from the moment the person enters the terminal or station until the departure. A specific time-sheet was served to record the departure and arrival times of public transit vehicles. We distributed a questionnaire to passengers to document the waiting time. It also served to identify the type of work that passengers were going to in the private or public sector. The questionnaires were given to 25,000 passengers at four main different stop stations; 2,320 were answered and returned. 120 questionnaires were cancelled, since more than 40% the questions were not answered. In total, 2200 questionnaires were processed.
The main problem identified in the transport system is derived from the fact that passengers cannot pick their own departure time, and that there is no official time schedule for trips. Rather, passengers are constrained by the service’s departure times. It is important to know whether the waiting time affects passengers’expenses. Their waiting time at the station can be zero, should they be fortunate enough to arrive just in time for a departure. In the worst-case scenario, passengers arrive immediately after the departure time and have to wait for some time. In the present case, users are seen to incur costs of waiting, as well as costs of being uncertain about the time at which they will arrive at their target. The present analysis is based on users’ waiting time at the station. This study is not concerned with the travel time on the service, and it assumes this to be zero in order to simplify the analysis.
Transport demand is measured according to micro-economic theories and behavior patterns of public transport users [12]. The theory of micro-economics assumes that rational users not only use transport for reasons of cost, but they also choose the cheapest mode of transport for the required distance. Time has a cost value, and alternatives mean that the time a traveller waste on board, a vehicle could have spent that time more effectively on other activities [1,14-16].
The data for this study were obtained from a field survey and questionnaire given to people who use public transport routes in Amman, the capital of Jordan. Data were collected manually by observation at terminals and stop stations, including the number of passengers at the terminals and the actual waiting time for public transport users. The waiting time includes the arrival time of passengers at the terminal, and the departure time of passengers by public transport mode. Observations were carried out for buses, mini-buses, and public taxis during peak and off-peak hours.
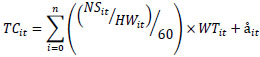
The present study depended on the waiting period, hours spent working each week in the public and private sectors, as well as the net monthly income in Jordan. This helped to estimate the magnitude and cost of passengers’ waiting time. The following equation measures the cost of waiting time for public transport users:
 |
(1) |
Where TC represents time cost for the passengers and dependence on the waiting time in the station; NS represents the net monthly salary in Jordan according to the country’s Department of Statistics; HW refers to working hours (in the public or private sector); WT stands for the waiting time (minutes) in the station; n represents the total number of passengers in a vehicle (number of users); and i is the number of passengers working in either the private or public sector.
4. RESULTS
According to the Department of Statistics (2016), the population of Amman city was about 4 million in that year; half of them use their own cars within the city boundaries and around five hundred thousands are workers. Approximately 1,200,000 cars enter the city on a daily basis. The number of vehicles in the city during the morning peak hour (from 7 am to 8 am) was about half a million. The department also reported the number of public transport vehicles, where buses were 300 in number; there were also 200 mini-bus vehicles, and 3000 public taxi cars. Besides, the public transport ridershipper day was reported to be five hundred thousand passengers.
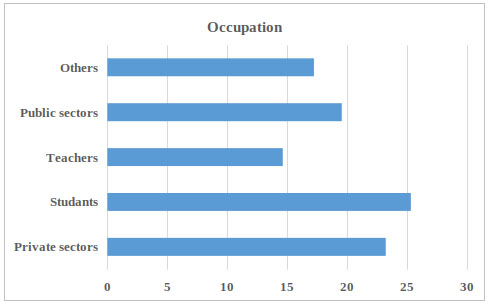
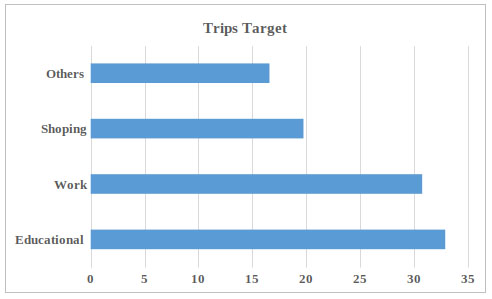
A survey-based questionnaire was conducted in 2017 in Amman to study the satisfaction of public transport users. The questionnaire was specifically about the system of public transport and the quality of service provided. The results in Fig. (1) show that the majority of public transport users are students who represent about 31% of all users, followed by public and private sector employees who constitute 25% and 14%, respectively. Other public transport users represent around 19% of the population. For the trips target, the results are illustrated in Fig. (2). The educational trip purposes were the highest with about 35% of all trips, followed by 30% of work-related trips, and all other trips being approximately 35% of all targets.
According to the field observation, the waiting time experienced by all public transport users at the main terminals was recorded during peak and off-peak hours. This is summarized in Table 1 below.
As shown in Table 1, there are three modes of transport and three averages of the waiting time for buses, mini-buses and taxis during peak and off-peak hours. There are two classes that use public transport daily. This study examined public and private sector employees and the cost of waiting time for these people. The average waiting time for buses was around 18:20 minutes. For public sector employees, this time resulted in the cost of US$1.01 during the off-peak hours. During the peak hours, the average waiting time increased to around 25:25 minutes, and the time cost was US$1.40. With reference to private sector employees, the cost of waiting time was about 0.90 cents and US$1.24 for peak hour and off-peak hour, respectively.
The average waiting time for mini-buses during the off-peak hours and peak hours was about 18:33 and 22:02 minutes, respectively. Additionally, the cost of waiting time was US$1.02 and US$1.22 for employees in the public sector during off-peak hours and peak hours, respectively. For private sector workers, the costs of waiting time during off-peak hours and peak hours was 0.90 cents and US$1.08, respectively.
Statistics for the taxis revealed that this public vehicle had the lowest average waiting time with about 09:57 minutes during off-peak hours and approximately 11:46 minutes during peak hours. This is much shorter when compared to the other two modes of public transport. However, the costs of waiting time for employees in the public and private sector were about US$0.53 cents and US$0.63 during off-peak hours, respectively. During peak hours, these costs were US$0.47 cents and US$0.56 cents for employees in the public and private sector, respectively.
The results reported in Table 1 indicate that the waiting time during peak hours was longer than off-peak hours. It means that employees and common users would wait for a long-time during rush hour. Rush hour is defined as when problems like traffic congestion occur, causing delays in the public transport modes. This means that on-time arrival at the station is difficult to achieve. The demand for public transport modes during peak hours is very high, and there are no alternative choices for passengers. For example, Amman still has no tram system that would facilitate the movement of people to avoid traffic congestion or at least take the pressure off the transport system.
This study also used a spatial analysis to measure services provided for public transport routes according to the average waiting time. GIS software was employed to generate two maps representing the waiting time for public transport users at peak and off-peak hours, as shown in Figs. (3 and 4), respectively. The waiting time was divided into five classes to illustrate in detail how varied this time is along public transport routes in Amman. As shown in the figure, the light blue line is the shortest waiting time, while the dark blue is the longest waiting time.
| Name of city | Transit mode | Average waiting time (Minute) | The cost of waiting time (Public Sector) | The cost of waiting time (Private Sector) | |||
|---|---|---|---|---|---|---|---|
| Off-Peak hour | Peak hour | Off-Peak hour | Peak hour | Off-Peak hour | Peak hour | ||
| Amman | Buses | 00:18:20 | 00:25:25 | 1.01 | 1.40 | 0.90 | 1.24 |
| Mini-Buses | 00:18:33 | 00:22:02 | 1.02 | 1.22 | 0.90 | 1.08 | |
| Taxis | 00:09:57 | 00:11:46 | 0.53 | 0.47 | 0.63 | 0.56 | |
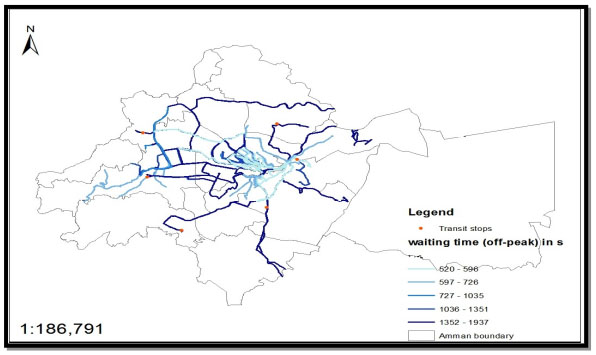
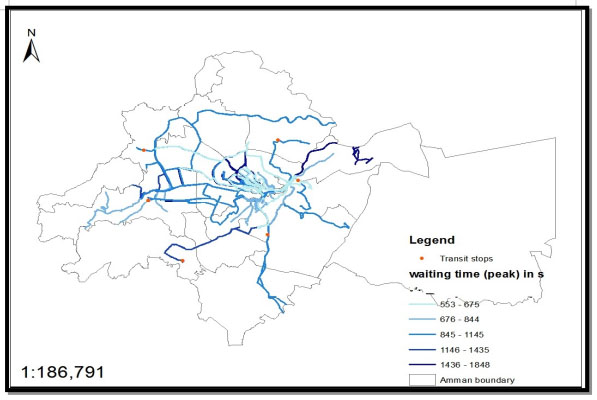
The data in Fig. (3) represent the waiting time for public transit users during the peak period and along each route within the city. The shortest was 520 seconds for a service taxi, while the longest was 1602 seconds for a mini-bus. Indeed, the average of 883 seconds was documented for all public transport modes. Meanwhile, the data in Fig. (4) indicate the waiting time during off- peak period for each route; here, the shortest was 553 seconds for a service taxi, while the longest was 1937 seconds for a bus. The average for all public transport types was 1145 seconds. It was also observed that the average waiting period at peak time was longer compared to off-peak time.
Some routes are shown to have long waiting times in peak and off-peak hours, and these routes were mainly characterized by low frequencies and small fleet sizes. This indicates that there was not sufficient demand for them. Moreover, most of the bus routes in Amman were radial in their pattern, starting from the CBD and heading outwards away from the city center, adding to high traffic congestion. Thus, the traffic flow was seriously compromised. On the other hand, according to the economic aspect of this study, the waiting time cost was calculated, taking into account that private and public sector employees work different hours. As stated previously, the average weekly working hours in the public sector was approximately 48 hours, while it was 54 hours for the private sector. The results are shown in Table 2.
Table 2 shows the average cost of waiting time for each transport mode, for both the public and private sectors. It is evident that the waiting cost for public sector employees was higher than that incurred by private sector workers; this can be explained by the former being paid higher wages compared to the latter in Jordan. The study also reveals that the waiting time for buses is higher than other public transport modes. Most of these modes have longer routes compared to other public transport modes. The calculated costs accounted for passengers’ one-way movements (departing or arriving) to or from the terminals. For waiting time costs, the price will change to around US$45 per day. This price is fairly hefty for people whose average monthly net income is approximately US$637. In effect, it means that about 12% of their income - around US$80 per month - is spent on their time wasted while waiting for public transport.
5. DISCUSSION
A limitation of the present study lies in the very methodology followed . The methodology is not a model that can identify all of the potential variables that affect passengers’ waiting time, the selected variables, however, are based on what has been traditionally suggested in the literature as greatly impacting waiting time. The primary purpose of this research was to measure the waiting time for passengers using public transportation, and how much this waiting costs. Another limitation was the lack of a time-table for public transport from the public transport station. That was a serious issue and led to variations in collecting the data regarding waiting time.
A final limitation related to the lack of regular station stops during the trip, indicating that the waiting time for the passengers who used the public transport during their itinerary was not counted. As a result, this study collected the data only at the main stop stations, so other waiting times were not counted. Amman’s transport system suffers from many management problems, mainly due to non-scheduling of trips that leads to long waiting times at terminals, stops, and waiting for public transport to depart. Waiting time is closely associated with delays and increased time costs. There are many factors that increase the waiting time and time costs for public transport users, such as traffic rules, traffic congestion, fleet size, and route length. This study recommends that Jordan’s government and the transport authorities in charge of the city need to solve the problems caused by centralization, in order to reduce the number of vehicles that daily enter the city of Amman and cause traffic jams during peak hours. It is equally critical to upgrade the network routes inside the city by creating new ones or separate lanes for public transport modes. Yet these will be difficult to implement simultaneously, because Amman has narrow traffic routes experiencing a lot of congestion, especially during peak hours. Another problem is the rapid bus routes project which is still under construction (how long now?). It is taking numerous routes and has blocked those routed for traffic and impeding the traffic flow, by narrowing the corridors and closing some of them for construction purposes.
| Transport mode | Time | Sector | Average Time(min) | Average Cost ($) |
|---|---|---|---|---|
| Bus | Peak | Public | 25 | 1.40 |
| Private | 25 | 1.24 | ||
| Off-peak | Public | 18 | 1 | |
| Private | 18 | 0.90 | ||
| Mini-bus | Peak | Public | 22 | 1.22 |
| Private | 22 | 1.08 | ||
| Off-peak | Public | 18 | 1.02 | |
| Private | 18 | 0.96 | ||
| Public taxi | Peak | Public | 10 | 0.47 |
| Private | 10 | 0.57 | ||
| Off-peak | Public | 12 | 0.53 | |
| Private | 12 | 0.63 |
The government should also increase spending on the infrastructure, especially on the public transport sector. Implementing the navigator system can help passengers manage their trips within a specified time period and following public transport modes while moving; this tool can give passengers the ability to choose between transport modes or other options like Uber. Another possible solution that may reduce the waiting time and cost is the construction of a tram network within Amman’s CBD. This idea could reduce the waiting time and will be acceptable to the passengers by enhancing the service and developing a good (and documented) schedule for each route. Improving waiting time can benefit the government, by increasing the demand for public transportation, which will reduce passengers’ downtime and improve the economy. Wasting money and time are very important factors for the economy and the ability to increase economic growth and productivity is important. This means that investment in the public sector in Jordan will generate competition among companies to increase their fleet sizes and the quality of the service being provided to the passengers.
CONCLUSION
This paper has investigated the waiting time (magnitude and cost) of public transport passengers in Jordan in 2017. This study adds to the knowledge on the importance of waiting time of public transport users. Many performance measures were utilized to evaluate the efficiency of the service provided by public transport. Waiting time is one such performance measure that can reflect the satisfaction of public transport users and the quality of service provided. Also, the waiting time makes a significant contribution to the delays experienced by public transport users. In addition, the results showed that the shortest waiting time of public transit users during the peak period was 520 seconds for a service taxi, while the longest was 1602 seconds for a mini bus to arrive at the same target. Indeed, the average of 883 seconds was documented for all public transport modes.
The waiting time in Amman was evaluated for three transit modes. The results show that passengers wanting to depart had to wait for a long time inside the terminals when using public transport modes, especially during peak hours. This, in turn, led to significant delays. Waiting time has implications for how much money is spent by public and private sector workers on modes of transport. On the other hand, according to the economic aspect of this study, the waiting time cost was calculated, taking into account that private and public sector employers work different hours. The average weekly working hours in the public sector are approximately 48 hours, while it is 54 hours for the private sector. The cost of waiting time for all the employees in Amman was very high compared to their average monthly income, and there is a strong evidence that it costs up to as much as 12% of people’s incomes. They were, in fact, spending nearly US$80 per month simply waiting for public transport modes. It is an experience that will affect their other expenses.
Finally, the average cost of waiting time for each transport mode has implications for both the public and private sectors. It is evident that the waiting cost for public sector employees was higher than that incurred by private sector workers; this can be explained by the former being paid higher wages compared to the latter in Jordan. In a word, the study reveals that the waiting time for buses is longer than other public transport modes; this is because of their high capacity to carry a great number of passengers and longer routes compared to other public transport modes.
NOTES
CONSENT FOR PUBLICATION
Not applicable.
AVAILABILITY OF DATA AND MATERIALS
The authors confirm that the data supporting the findings of this research are available within the article.
FUNDING
None.
CONFLICT OF INTEREST
The authors declare no conflict of interest, financial or otherwise.
ACKNOWLEDGEMENTS
Declared none.

