All published articles of this journal are available on ScienceDirect.

Effect of Community Road Infrastructure, Socio-Demographic and Street Pattern in Promoting Walking as Sustainable Transportation Mode
Authors Info & Affiliations
Abstract
Background:
Traffic demand is growing worldwide and the increased carbon emission from transport and travel activities is contributing to greenhouse gas emission and climate change. As the oil and gas capital of Canada, the city of Calgary has a very high carbon footprint per population and the reduction of automobile use is an important policy goal for the city. Walking, a part of active transportation promotes sustainable transportation initiative by reducing greenhouse gas emission. To encourage walking, favorable walking environment should be ensured which largely depends on street pattern and connectivity. However, the effect of street pattern on walking at community level was not explored much in previous studies, particularly at rapidly expanding city such as Calgary’s context.
Aims and Objectives:
The study identifies the effects of different neighborhood design and planning factors associated with the share of walking in work trips while controlling for differences in social economic characteristics of the neighborhood.
Methods:
A linear regression model was developed using community-level data from the 2011 census and the road infrastructure data of Calgary.
Results:
Our study finds that different street patterns and types of land use, length of train tracks, number of train stations and number of schools have significant effect on walking.
Conclusion:
Thus, different neighbourhood street patterns and land uses should be considered in the development of new communities for promoting active and sustainable transportation.
1. INTRODUCTION
New communities are being built continually to accommodate the growing population, especially in urban centers around the world. Accompanying this urban growth is the growth of vehicular traffic and its associated externalities, such as congestion and pollution. Despite efforts targeted at reducing the environmental impact of cars by means of technological innovations (e.g. more efficient engines, hybrid fuel systems, and fuel cell technology), the transportation sector is still a major contributor to environmental pollution and global climate change. Transport accounts for 14% of global greenhouse gas emissions with the vast majority of emissions produced by the road transport sector. Road transport is currently the dominant mode in contributing to carbon dioxide (C02) emissions and road passenger modes are expected to account for close to two-thirds of emissions by 2030, with emissions from the road freight sector growing at an even faster rate [1]. Moreover, this phenomenon is experienced in both developed and developing countries [2-5].
Besides minimizing private vehicle usage by adapting certain policies [6] to reduce the greenhouse gas emission, promoting sustainable transportation system is mandatory. Authorities of different countries have initiated, implemented policies and programs to promote sustainable transportation and evaluated whether this initiative helps moving toward or away from establishing sustainable transportation goal [7-9]. Reduction of greenhouse gas emissions (GHG) does not depend on one strategy, rather the best policy is to pursue combinations of transportation GHG reduction strategies such as alternative fuel and vehicle options, low carbon and renewable power, travel demand management and land use changes to meet reduction goals [10].
Schiller and Kenworthy [11] mentioned that introducing efficient vehicles such as Autonomous Vehicle (AVs) and Electric Vehicles (EVs) reduces CO2 emission. Egbue et al. [12] stated that mass penetration of electric vehicles into the market will have a number of impacts and benefits, including the ability to substantially reduce greenhouse gas emissions from the transportation sector. Their research results show that several factors which include willingness to pay for new appealing technology, distance driven, perceptions of electric vehicles as good for the environment, and perception of EV speed influencing willingness to purchase an electric vehicle significantly. Miller [13] explored the potential of monorail as a mean of sustainable mobility. He made a comparison of operational issues and sustainability impacts of monorail to other major rapid transit modes - bus rapid transit, light rail transit, and rail rapid transit. He concluded that monorail would serve as an effective transit mode based on cost, capacity, geographic context, and sustainability impacts of mass transit modes. Besides promoting the advanced and efficient vehicular options, trip sharing policy limits the number of trips as well, thus reducing the negative environmental impacts arising from transportation of goods and people. Sayyadi and Awasthi [14] revealed that trip-sharing policy effectively decreases congestion while car ownership decreases tendency of vehicular trips and increases public transit trips. Equity is an important issue for implementing any sustainable transportation initiative. Teunissen et al. [15] showed that TransMilenio BRT offers equal access for all Socio-Economic Strata (SES) when compared with other sustainable transportation initiative.
Land use, road infrastructure, urban form has a strong influence on establishing sustainable transportation system. Delucchi [16] proposed two accessible travel networks at a citywide scale: one for Fast Heavy motor Vehicles (FHVs) and the other for low-speed, low-mass modes including walking and cycling as high kinetic energy of Fast Heavy motor Vehicles (FHVs) make transportation and land use system unsustainable. Yao and Chen [17] explored the complex relationships between the transportation system and urban growth to find the inter-dependent relationships between the various components. The components in this exploratory study include population, economy, housing, transport, and urban/ developed land. Lv et al. [18] indicated that transport structure and management measures have important impacts on transportation energy consumption. Donais, Abi-Zeid and Lavoie [19] assessed and ranked streets as a function of their potential to become complete street.
To reduce the greenhouse gas emission in the transport sector, cleaner and greener travel modes, such as public transport, cycling, and walking, are often promoted as a way to reduce auto dependency and increase the sustainability of the transportation system. Ride sharing, carpool and home office are also other alternatives besides public transport, cycling, and walking to enhance sustainable transportation system and alternative to transportation. A survey done by University of California Transportation Center in 2012, prospective participants said that they would share rides primarily to save time and money and secondarily, to reduce the environmental impacts of driving. To save time, most would prefer a service that matches riders and drivers automatically, based on stated criteria, rather than one that gives the participant a list of contacts and expects them to follow up [20]. According to Graaff and Rietveld [21], a teleworker is an individual who works mainly at home or in other places rather than the actual workplaces. Therefore it can be said that teleworking is a broader form of home office.
Greenhouse gas emissions for urban travel in Canada in 1997 were 215 grams per passenger-kilometer (g/pk) for a car or a light truck, 77 g/pk for urban transit, 26 g/pk for intercity bus travel, and, of course, 0 for walking or cycling [22]. Therefore, a modal shift by decreasing the share of automobile trips and increasing the share of work trips undertaken by walking is one of the most effective means in reducing emissions. Besides reducing private motor vehicle usage, walking also has many health benefits [23, 24].
To encourage a higher demand for walking, a greater understanding of the factors influencing this mode choice is needed. Although several studies have attempted to identify the factors influencing walking, few studies have explored the effects of different urban form and design like neighborhood street patterns. The objective of the study is to examine the effects of urban design and planning factors on walking, including the influences of street pattern, land use, road infrastructure, public transport, schools and gas stations, while controlling for socioeconomic and demographic characteristics of the communities.
Calgary is chosen as the study area because this city has been growing rapidly for a decade due to the economic boom in the oil and gas sector. To accommodate the increased population, the city has expanded laterally and many new communities are being built. Also, due to its heavy carbon footprint, reducing vehicle emission is an important policy goal of the city. Therefore, evidence on the effects of different neighborhood design and planning factors on greener travel modes, such as walking, is needed to help policy makers, developers and residents make more informed choices.
2. LITERATURE REVIEW
Waygood and Susilo [25] found that reduced distances, better support for local shops, and reduce traffic speed through street design and regulation could increase walking in Scotland. In Australia, Turrell, et al. [26] found that higher levels of walking in disadvantaged neighborhoods were associated with living in a built environment that was more conducive to walking (i.e. greater street connectivity and mixed land use). In a separate study, Koh and Wong [27] found that rain shelter supplants distance as the most important factor for selecting walking routes in Singapore. Other important influences in the study included comfort, shops and scenery.
In the United States, Yang et al. [28] found that the concentration of mixed land use (differential density of residences and businesses) is an important determinant of walking. In the state of New Jersey, Sehatzadeh, et al. [29] found sufficient evidence that suggested fewer cars were owned in areas with a more walkable built environment. They also found that dog ownership was strongly associated with walking. In California, Park, et al. [30] found that sidewalk amenities, traffic impacts, street scale and enclosure, and landscaping had a strong influence on walking as a choice of mode. In Minnesota, Hearst et al. [31] found that both individual level and area-level socioeconomic factors were significant in determining walking although individual-level factors had a stronger effect.
Finally, in Canada, Clark and Scott [32] used a series of linear regression models to examine how components of the social environment (companionship, encouragement, role models, neighborhood social cohesion) influence the time spent for walking while controlling for individual and physical environments. They found that only role models and neighborhood social cohesion influenced walking time, whereas physical environment such as population density, street connectivity, retail floor area ratio, pedestrian infrastructure, and land-use mix had little effect.
To consider walking as a solution for sustainable mobility, Masoumi [33] mentioned that neighborhood-oriented planning should be promoted over automobile-oriented planning. More specifically, his study discussed that by strengthening neighborhoods and Neighborhood Unit Centers (NUCs) can promote sustainable transportation by ensuring walking-friendly environment. Neighborhood-centric design made urban travel short and localized.
To promote walking-friendly environment in Calgary, at first it is important to identify the effect of socio-demographic, road infrastructure and street pattern on walking, specifically at a community level. Considering community-based data as a unit of analysis will help policy makers to take integrated decision on promoting walking a sustainable transportation mode.
3. METHODOLOGY
3.1. Statistical Model
The objective of the study is to identify the factors associated with the share of work trips undertaken by walking in a community area. The study will focus on urban design and planning factors, while controlling for socioeconomic and demographic factors. As the percentage of walking in a community area is a continuous variable, the multiple linear regression approach is appropriate for our study. The structural form of the model is given below [34]:
 |
(1) |
where y is the percentage of work trips by walking in each suburb
X is a vector of explanatory variables
β is a vector of parameters to be estimated
ε is the normally distributed error term
3.2. Data
Several sources of data were used in this study. The primary data source was the 2011 Census which provided demographic information on the community areas in the city of Calgary, as well as data on the relative shares of work trips originating in each community area that were undertaken using different transport modes. The share of walking trips in each community area or suburb was extracted and used as the dependent variable in this study. In addition, to control for the influences of socio-demographic variables on walking mode choice, the relevant data were also extracted from this dataset.
Since this study focused on the effects of urban design and planning factors on commute mode choice, another important database used to gather the required information was the city of Calgary's Land Information and Mapping database. The census data, as well as road infrastructure data, were collected from the University of Calgary library where they maintained the GIS database. It contained information on infrastructure and spatial attributes, such as streets, schools, liquor stations and train stations in each community. The road network section of this database was also used to obtain data on different road infrastructure, such as traffic volume, heavy vehicle traffic, length of different types of roads and number of intersections. In addition, information on the size of the community areas and primary land use (residential, commercial) of each suburb was also extracted for the study.
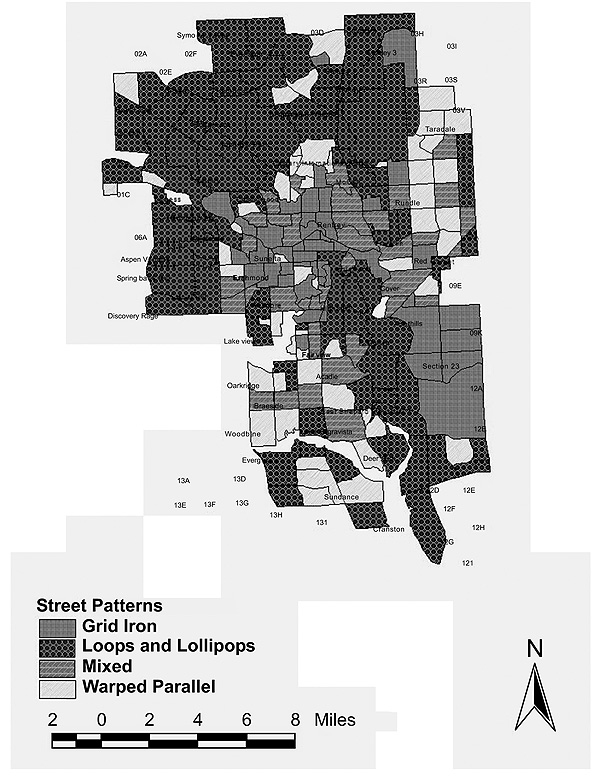
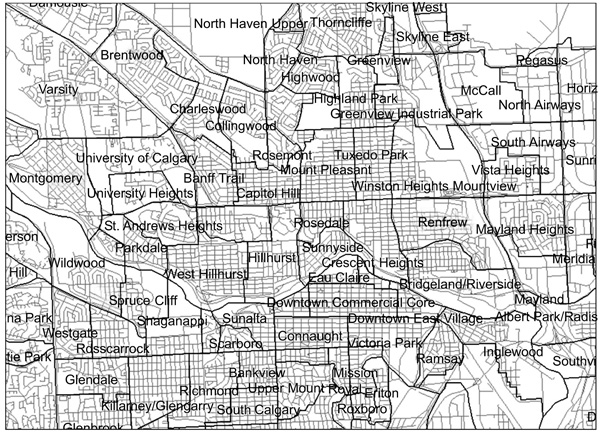
The street pattern in each community was classified using a scheme adapted from the one developed by Southworth and Ben-Joseph [35] who classified street patterns into five categories: gridiron, fragmented parallel, wrapped parallel, loops and lollipops, and lollipops on a stick. The simplified classification scheme used in this study had only four categories and had been used in several previous studies to examine the influence of neighborhood design on road safety [36-38] and transit use [39]. The example of a community in each of the four categories is shown in Fig. (1) and the distribution of street pattern in Calgary is shown in Fig. (2). Road network in some of the Calgary communities are shown in Fig. (3).
The final dataset used in the study contained complete information on 168 community areas. A summary of the data used in the analysis is shown in Table 1. Since some of the factors are recorded in a categorical manner, several dichotomous or binary (0 or 1) variables are used to capture their effects. For example, the type of street pattern in the neighborhood is captured by four dichotomous variables: grid-iron, warped parallel, loops and lollipops, and mixed patterns. If a community has grid-iron road pattern then it will be denoted as 1 otherwise 0. This is same for all other categories. Note that the mean of a dichotomous variable simply represents the proportion of the sample belonging to the particular category. Therefore, the mean of the grid-iron variable is 0.185 which indicates that 18.5% of the sample has a grid-iron street pattern.

| Variable | Mean | Std. Dev. | Min | Max |
|---|---|---|---|---|
| Dependent Variable | ||||
| Walking Share of Work Trips (%) | 5.729 | 9.847 | 0 | 67.31 |
| Urban Design and Planning Variables | ||||
| Street pattern | – | – | – | – |
| Gridiron | 0.185 | 0.389 | 0 | 1 |
| Warped parallel | 0.292 | 0.456 | 0 | 1 |
| Loops and Lollipops | 0.327 | 0.471 | 0 | 1 |
| Mixed | 0.196 | 0.917 | 0 | 1 |
| Number of train stations | 0.205 | 0.891 | 0 | 11 |
| Length of train route (m) | 2.220 | 10.723 | 0 | 73.4 |
| Number of schools | 1.762 | 1.525 | 0 | 8 |
| Parkland (%) | 0.361 | 0.215 | 0 | 1.27 |
| Total land area (km2) | – | – | – | – |
| < 1.0 | 0.220 | 0.416 | 0 | 1 |
| 1,0 - 2.5 | 0.399 | 0.381 | 0 | 1 |
| > 2.5 | 0.381 | 0.487 | 0 | 1 |
| Social, Economic and Demographic Variables | ||||
| Home ownership (%) | 68.214 | 21.855 | 0 | 99 |
| Immigrant population (%) | 22.605 | 10.028 | 3.6 | 81.4 |
| Percent with high school certificate | 24.715 | 4.800 | 6.1 | 33.4 |
| Percent with trade certificate | 7.870 | 3.448 | 0 | 15.8 |
| Average Household Size | – | – | – | – |
| < 2.0 | 0.149 | 0.357 | 0 | 1 |
| > 2.0 | 0.851 | 0.357 | 0 | 1 |
| Divorced and not living with partner (%) | 15.356 | 4.315 | 3 | 34 |
Also, several of the contributing factors are recorded in terms of percentage shares of the different categories. Since categorical data always sum to one or 100%, one of the categories has to be omitted from the model and used as a reference or base case by which the estimates of other categorical variables are compared. For example, to estimate the effects of street pattern on mode choice, the categorical variable for grid iron is omitted and the estimated coefficients of the other three patterns are interpreted as relative to the grid iron pattern. In case of interpreting the model results, the positive sign of the estimated coefficients β indicate the higher chances of using public transit as the value of the associated variables increases while negative signs suggest the converse. Some of the variables are continuous. For example, mean of the immigrant population in percentage determines the average percentage of immigrant population in every community.
Before arriving the best fit model, several combinations of variables are used and different models have been developed. At this model development process, some variables show statistically insignificant result and omitted from the final model. Note that a substantial number of factors, such as population, unemployment, educational status, ethnicity, religion, languages spoken, etc. were found to be statistically insignificant in preliminary analyses and not thus reported in the table. Before starting the analysis, it is necessary to check if the data is adequate with the assumptions of multiple linear regression model. Fitting a regression model requires several assumptions. Estimation of the model parameters requires the assumption that the errors are uncorrelated random variables with mean zero and constant variance. Tests of hypotheses and interval estimation require that the errors are to be normally distributed. The validity of these assumptions were checked during model development process.
4. RESULTS AND DISCUSSION
The results of the statistical analyses were summarized and shown in Table 2. In general, the model had a good goodness-of-fit statistic as assessed by moderate R-square and adjusted R-square and small p-value for the F-test. Variables with at least ninety percent confidence level were retained in the model. Some of the transportation, urban design and planning variables that were statistically insignificant included traffic volume, heavy vehicle volume and percentage, number of intersections, intersection density, road length, road density, lengths and shares of different classifications of roads (expressway, arterials, collectors, local roads), lengths and shares of different types of roads (one/two way, divided/undivided, barrier/no barrier), number of bus stops, number of gas stations, number of housing units, housing density, share of different types of housing (apartments, row houses, semi-detached, detached) and population density. It has been observed that walking is not only influenced by neighborhood street pattern but also by other social and economic variables. In Table 3, the effect of different variables on walking has been shown by sign (“+” or “-“). If a particular variable promotes walking it is also termed as “advantageous” and “disadvantageous” to vice-versa.
| Number of observation F-statistic R-squared Adjusted R-squared P-value |
168 21.71 0.682 0.650 < 0.0001 |
|||
| Variables | Coefficient | Std. Err. | P-Value | |
| (Urban Design and Planning Variables) | ||||
| Street pattern | ||||
| Warped parallel | -4.172 | 1.706 | 0.016 | |
| Loops and lollipops | -4.483 | 1.811 | 0.014 | |
| Mixed | -4.142 | 1.689 | 0.015 | |
| Number of train stations | 1.579 | 0.524 | 0.003 | |
| Length of train routes (m) | -0.084 | 0.044 | 0.059 | |
| Number of schools | 0.696 | 0.358 | 0.053 | |
| Parkland (%) | 0.102 | 0.023 | < 0.001 | |
| Total land area (km2) | ||||
| 1.0 - 2.5 | -3.463 | 1.331 | 0.010 | |
| > 2.5 | -3.117 | 1.537 | 0.044 | |
| Social, Economic and Demographic Variables | ||||
| Home ownership (%) | -0.117 | 0.031 | < 0.001 | |
| Immigrant population (%) | 0.239 | 0.051 | < 0.001 | |
| Percent with high school certificate | -0.498 | 0.122 | < 0.001 | |
| Percent with trade certificate | -0.540 | 0.202 | 0.008 | |
| Average Household Size | ||||
| > 2.0 | -3.260 | 1.701 | 0.057 | |
| Divorced and not living with partner (%) | 0.472 | 0.146 | 0.001 | |
| Constant | 21.275 | 4.411 | < 0.001 | |
| Variable Name | Variable Sign | Policy Decision to Promote Walking |
|---|---|---|
| Urban Design and Planning Variables | ||
| Street pattern | ||
| Warped parallel | - | Disadvantageous |
| Loops and lollipops | - | Disadvantageous |
| Mixed | - | Disadvantageous |
| Number of train stations | + | Advantageous |
| Length of train routes (m) | - | Disadvantageous |
| Number of schools | + | Advantageous |
| Parkland (%) | + | Advantageous |
| Total land area (km2) | ||
| 1.0 - 2.5 | - | Disadvantageous |
| > 2.5 | - | Disadvantageous |
| Social, Economic and Demographic Variables | ||
| Home ownership (%) | - | Disadvantageous |
| Immigrant population (%) | + | Advantageous |
| Percent with high school certificate | - | Disadvantageous |
| Percent with trade certificate | - | Disadvantageous |
| Average Household Size | ||
| > 2.0 | - | Disadvantageous |
| Divorced and not living with partner (%) | + | Advantageous |
| Positively Significant +, Negatively Significant - | ||
Compared to gridiron, all the other three street patterns had statistically significant effects on the share of walking trips in the community. More specifically, mixed pattern (β = -4.142, p = 0.015), warped parallel pattern (β = -4.172, p = 0.016), and loops and lollipops pattern (β = -4.483, p = 0.014) were all associated with lower shares of walking than gridiron street pattern. This result was consistent with the study by Turrell et al. [26]. Gridiron street pattern might promote walking from one point to another due to their greater connectivity. It also might offer more route choices to the pedestrian. On the contrary, warped parallel, loops and lollipops, and mixed pattern usually offered limited route choices from origin to destination and would also require longer travel distances along disconnected and winding roads. Grid iron street pattern is easily discernable to reach from origin to destination, on the contrary, unfamiliar trip makers often confused and end up at dead end street of loops and lollipops pattern. The visibility of pedestrian at intersection would be obstructed due to the curvilinear nature of warped parallel whereas this problem is not present at grid pattern street.
Interestingly, an increase in the number of train stations in a community was associated with an increase in the share of walk trips (β = 1.579, p = 0.003), whereas an increase in the length of rapid transit in a community was associated with a decrease in the share of walking in work trips (β = -0.084, p = 0.059). These results implied that having more stations and shorter distances for the rapid transit service would encourage more walking. On the other hand, these results might reflect certain high demand areas, such as the central business district and around large shopping centers and the university, where several stations were located quite close to each other. These areas have higher demands for both public transit and walking trips.
Land area is divided into three categories i.e., <1.0 km2, 1.0- 2.5 km2 and > 2.5 km2 where the 1.0- 2.5 km2 contains the average land area of each community in Calgary. Three categories have been created to check what type of communities (i.e., smaller or larger) promotes or discourages walking compared with the average one. With respect to the land use variables, communities with larger land areas (β = -3.463, p = 0.010; β = -3.117, p = 0.044) were found to be associated with lower share of walk trips whereas larger shares of park area (β = 0.102, p < 0.001) were found to be associated with a larger share of walk trips. Generally, people would be more inclined to take short trips by walking. In smaller communities, a larger share of the trips would be shorter and more conducive to walking because of the proximity of the local amenities, businesses and employment centers. Also, more people might be encouraged to walk in park areas because of the more pleasant environment.
This study found that the number of schools in a neighborhood might play an important role in increasing walking (β = 0.696, p = 0.053). This result was consistent with Park et al. [30] who found that a higher public school density was positively associated with choice of an active travel (walking and cycling) mode. Also, in another study, Rahul and Verma [40] found that students were more likely to choose walking when travelling to or from their schools. Living close to school might also increase the walking habit of the students as well as parents.
In terms of control variables, this study found that higher immigrant populations, and a higher share of divorced and not living partner individuals were associated with greater share of walking, whereas having high school or trade certificate, home ownership and larger (>2) households were associated with lower share of walking. These results were expected and generally consistent with the literature [15, 40, 41].
CONCLUSION
New communities are being built continually to accommodate the growing population in many centers around the world, including the city of Calgary in Canada. Accompanying this urban growth is the growth of vehicular traffic and its associated externalities, such as congestion and pollution. As the oil and gas capital of Canada, the city of Calgary has a very high carbon footprint per population and the reduction of automobile use and promotion of active transport is an important policy goal for the city. To encourage a higher demand for walking, a greater understanding of the factors influencing this mode choice is needed.
This study examines the effect of different infrastructure and planning factors on walking. Our results suggest that several street patterns have significant effects on walking and thus should be considered in the development of new communities. To increase sustainable and active transport modes, the traditional gridiron street pattern is preferred for developing new communities in Calgary. Policy makers and planners may also wish to consider increasing other physical measures, such as increasing the number of rapid transit stations, the number of schools and the share of parkland but decrease the total land area of the community.
Besides urban design and planning factors, this study also finds a number of socioeconomic and demographic characteristics to be associated with walking. Educational campaign and fiscal and social policies to promote walking should be targeted at households or communities with lower home ownership, lower shares of high school and trade graduates, lower share of larger household (> 2), higher immigrant population, and higher share of divorced and not living with partner individuals.
LIST OF ABBREVIATIONS
| EV | Electric Vehicles |
| AV | Autonomous Vehicles |
| SES | Socio Economic Strata |
| FHMV | Fast Heavy motor Vehicles |
| NUC | Neighbourhood Unit Centers |
CONSENT FOR PUBLICATION
Not applicable.
AVAILABILITY OF DATA AND MATERIALS
Data are extracted from publicly available sources. Please contact the corresponding author if you need assistance in extracting the data.
FUNDING
None.
CONFLICT OF INTEREST
The authors declare no conflict of interest, financial or otherwise.
ACKNOWLEDGEMENTS
Declared none.

