All published articles of this journal are available on ScienceDirect.

Measuring Public Transit Accessibility Based On Google Direction API
Abstract
Background:
Accessibility is considered as an important indicator for the public transit service level. Transit accessibility is generally evaluated by its distance to transit access points such as bus stops and metro stations, and methods of measuring the access distances to transit points have been relying heavily on geographic data of transit facilities, built environments and pedestrian routes. Data collection and analysis are tedious for researchers in conventional approaches. As the application of cloud computing is on the rise, open services provided by Google Cloud Platform may simplify the procedure of accessibility measurement if the outputs of the open computing services could be validated.
Aims and Objectives:
This paper aims to develop a method of measuring public transit accessibility based on Google Direction API rather than local data analysis. A mechanism of API (Application Program Interface) probing is introduced. In a case study, the metropolitan area of Beijing was sliced into gridded spaces, with transit access distance of each cell space calculated by Google Direction API. The access distances in the API feedbacks were compared with transit access numbers in each cell area in order to validate the method with their correlation coefficient.
Results and Conclusion:
It was found that Google Direction API generally gave shorter access distances in cell areas with more public access points. The conclusion is that open cloud services such as Google Direction API may serve as alternative solutions to public transit accessibility measurement. Transit researchers and agencies may take advantage of such open API services to avoid the tediousness of collecting and processing geographic data sets on transit facilities.
1. INTRODUCTION
Public transit accessibility is a measure of transit users’ efforts in accessing transit services [1]. The access distances to public transit access points demonstrate spatial differences among urban areas [2]. The accessibility reflects spatial equity [3], and is also regarded as a service level indicator for public transit services [4, 5]. Studies on public transit accessibility help planners to consider users’ convenience in distributing transit stations, and to increase transit ridership [6]. Methods of measuring accessibility have been generally based on calculating the walking distances to the public transit access points such as bus stops and metro stations [3]. Existing methods simulate how transit riders get access to transit points based mainly on three types of geographic data: 1) the locations of transit access points (bus stops, tram stops, and subway stations, etc.), 2) information of available pedestrian routes and 3) coordinates of the places to be measured [7]. Data collection depends heavily on conventional methods [8, 9], and household surveys on respondents’ transit trips are sometimes included [10]. However, data collection is expensive and time-consuming and it is tedious to keep pace with frequent changes in transit services and built environments [11]. Methods of measuring the distances to transit systems need to be improved in efficiency [12].
This paper addresses a new approach to measure access distances to public transit points based on Google Direction API. An approach of API probing is developed to evaluate walking distances to transit points by using Google Direction API instead of local data analyzing. This paper consists of 5 sections. Section 1 introduces the backgrounds and general ideas of the work. Section 2 reviews related literature on transit accessibility. Section 3 describes the methods of this work. The validation results of the method are outlined in Section 4. Section 5 delivers discussions, followed by conclusions.
2. LITERATURE REVIEW
2.1. Public Transit Accessibility
Distance-based methods are often used in transportation models [13]. Transit stations’ distances to transit users are important indicators of accessibilities [14]. Public transit riders tend to take shortest paths to transit access points, and existing approaches have been focusing on how riders get access to the nearest access points [15]. The accessibility indicators can also be represented by the time needed in accessing public transit system [1]. Since transit riders tend to walk or ride bicycles to transit stations [16, 17], distances to public transit access points are equivalent to time indicators for their trip speeds could be inferred [18]. Both getting to and departing from the transit stations are relevant to accessibility [19], but the accessibility indicators could be simplified by the distances to the nearest public transit access points [20]. Users’ needs for public transit vary from individual to individual, the users’ differences should also be considered [21], and transit trip proposes are also associated with accessibility [22]. Measuring access distance to transit stations should also consider the trip headways, since one station may not have transit lines to all the intended directions [23]. So using only pure distances to the nearest transit access stations has flaws. A transportation model for simulating riders routes to access points is strongly needed.
The relation between the number of transit stations and access distance to transit stations has been studied [24, 25]. The more transit stations near a place, the shorter access distance to transit service were found [16]. This relationship provides a way of validating the transit accessibility measuring methods and research basis for this study.
2.2. Method of Measuring Accessibility
Programming is a common practice in transportation model constructing procedures [26, 27]. Existing approaches to accessibilities require simulating models of geographical information systems supported by local computing sources [28]. Software such as ArcGIS is widely used in simulating walking routes to public transit access points [15]. The process of constructing the simulation models usually costs a lot of time and computation resources [29]. Data availability has also been of concern for researches [30] since study data are not always available [31]. Computations based on open data are on the rise in transportation studies [32, 33], and open source data sets have been used, but the geographic analyzing process has still been conducted in local computers [25]. The data collection work is often conducted by the research teams independently, and the differences in data sets are common among research teams [34]. This makes the results from one research team hard to be duplicated and examined by others.
High-resolution maps of accessibility for the entire city are sometimes desired [35], but the computation power of local computers is limited. Planners and researchers often have to handle the problems related to computer sciences, which they may be not good at. Fortunately, open cloud computing services such as Google Cloud Platform have brought convenient, real-time geographic analyzing services for some researchers [36, 37]. Google Directions API (application program interface) is one of the open services on Google Cloud Platform. Information of walk distances could be extracted from feedback text scripts by the API service simulating how transit riders could walk to public transit stations before making public transits. When simulation is done on the cloud platforms, the outputs of Google Direction API probing need to be validated [37], and validation mechanisms for outputs generated by API probing are required.
3. METHODS
3.1. Public Transit Accessibility Indicator Probing
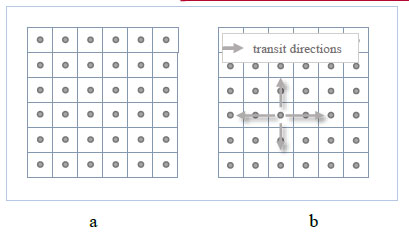
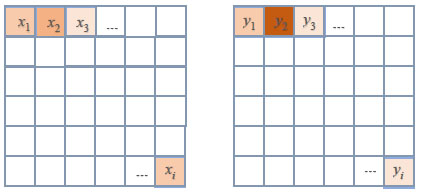
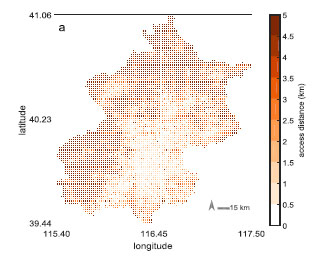
Public transit accessibility is an evaluation of spatial differences in public transit service. A technique of space probing is introduced, and the space in the study is sliced into gridded cell areas represented by their center coordinates (Fig. 1a). The route distance to the nearest public transit access point that a transit rider needs to overcome is seen as a public transit accessibility indicator. Indicators of traveling to four directions from the cell centers are averaged to make the final accessibility indicators (Fig. 1b). This work only discusses the access distance and focuses on the scenario of walking to the transit stations, as walking is regarded as the most common means of accessing to transit stations [38].
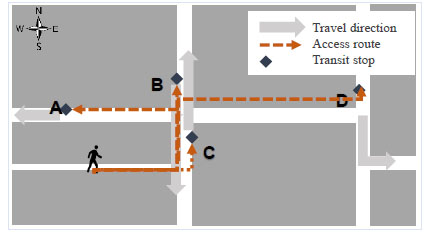
In real situations, a transit rider seldom gets to a bus stop or a metro station in a straight line from the origin points, and the nearest transit access point could not always guarantee the riders to all directions (Fig. 2). As Fig. (2) shows, points A, B, C, and D are the four available transit access points ensuring the riders going west, south, north, and east. Point A is the nearest station in the distance, while point C is the shortest in walking distance. How a transit rider gets access to the transit system depends on the built environments, the available transit access points as well as the transit lines in operation. Four walking distances ensuring the transit rider traveling to four directions need to be averaged into an indicator to make the result more reasonable.
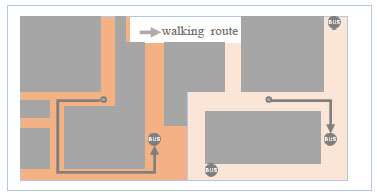
According to the definition of public transit accessibility, shorter walking distances represent better accessibilities. As for the gridded cells, the more transit access points near its centers, the easier a transit rider generally finds a transit access point in short walking distances (Fig. 3). When a gridded cell is represented by its center, and the accessibility indicator of its center could be measured, the grid is visualized in orange colors, and the lighter color means shorter walking distances.
3.2. Application of Google Direction API
Access distances to transit access points are perceived as accessibility. Conventionally, researchers need to build geographic models to simulate the process of getting access to transit points for transit riders. Whether there are alternative methods feasible other than building simulation models needs to be considered. As known, Google Maps can calculate direction routes for travelers. Fig. (4) shows that a rider takes public transit traveling from a coordinate (N40.0137251, E116.2691643) to a south point (N39.9637251, E116. 2691643). Google Map gives the direction information showing that transit riders need to walk about 450 m to a transit access point before making a southward transit. The latitude decreases 0.05 degree from the origin to destination indicating the transit direction is southwards.
Google Maps give the walking distance to the available public transit access points with all the calculation conducted in the servers of Google rather than the researchers’ computers. Google Directions API is one of the services on Google Cloud Platform similar to Google Maps, and it may also provide a convenient way of evaluating the transit accessibility. With the help of Google Direction API services, researchers only need to know coordinates of the locations to be measured, and the access routes, as well as access distances, can be fed back by the direction API. Comparing to conventional approaches, researchers need no longer do the work of data collecting, dataset managing, or geographic modeling. Google Directions API service only requires URL (Uniform Resource Locator) strings, which contain latitude/longitude coordinates of transit origins and destinations, travel types (driving, bicycling, or transit), and API keys. Transit direction routes returned by the API consists of trip legs (and types), and the first walking leg is always walking distance to the public transit access points as shown in the Google Maps service (Fig. 4). If no transit routes are available between the origins and destinations, the API will return ZERO_RESULTS. For any given coordinates of origins, making transits to four directions can be simulated by having destination longitudes/latitudes added or subtracted based on origin longitudes/latitudes. For example, if the coordinate of point O(origin) is (lati, longi), point D(destination) (lati+0.05, longi) is a place about 5.5 km northward. The walking distances from point O to transit access points when making the transit to four directions are averaged to be the accessibility indicator of point O. Walking distances longer than 5 km are seen as no transit services available because people rarely walk to public transit access points farther than 5 km [15].

Google Direction API only measures the access distances for points, not areas. A mechanism of space gridding is also utilized. In the space gridding method, a study area is sliced into gridded cell areas, and each cell is represented by its center. Then the public transit access distance of a cell can be measured by Google Direction API, and the proposed procedure is detailed as:
(1) the whole study area is sliced into gridded cell areas.
(2) the center coordinates (latitudes and longitudes) of each cell are calculated.
(3) text strings containing latitudes and longitudes are made into URLs that Google Direction API needs.
(4) feedback information is obtained through API inquiring.
(5) the feedback information is analyzed, and first legs of walking distances are extracted from the available transit direction information
(6) walking distances to transit points transiting to four directions are averaged to be accessibility indicators for all the cells.
(7) space reconstruction with distances of the gridded cells is visualized in a geographical view.
3.3. Validation of the Approach
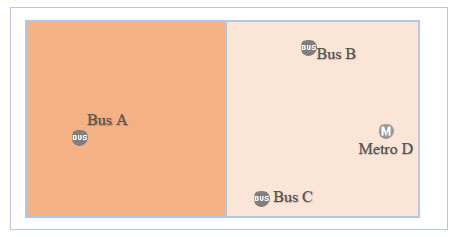
Are the distances generated by API probing have correlations with the distribution of transit facilities? It is a question that needs to be answered to validate the API probing method. A mechanism of validating the approach is designed based on the knowledge that transit accessibility correlates with numbers of nearby transit access points [19]. Transit users tend to walk longer to public transit access points in the worse facilitated places (Fig. 5). If the whole study area is sliced into n gridded cell areas indexed by i, and the number of transit access points in cell i is yi. It is calculated by the function of:
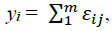 |
(1) |
where j is the number of transit access points, εij is the number j transit access points located in the cell i, m is the total number of transit stations and εij {0,1}.
If the output indicators (walking distances) of the API probing approach of cell i is xi, and xi has a negative correlation with yi, the indicators generated by the probing method are reasonable (Fig. 6).
The more public transit access points in cell areas, the shorter the access distances most likely to be. The correlation between xi and yi is r:
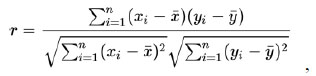 |
(2) |
where xi is the access distances generated by the API probing, yi is number of transit points located in the cells,
So r is a number within the range of [-1,1], and R2 [0, 1]. If r is minus, the method is thought to be effective. Higher R2 means higher reliability of the method.
4. CASE STUDY AND RESULTS
4.1. Case Study Area
Beijing is chosen as the test area since the city highly depends on public transit. There are about 5 million regular transit riders in Beijing, accounting for a quarter of its population. About 10 million bus transits, as well as 10 million metro transits, take place every day. A grid of 100 by 100 is made to generate cell grids, and 5032 cells are within the Beijing administration boundary.
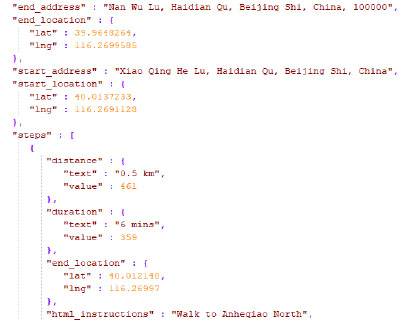
Suppose the center coordinate of a cell area is (N40.0137251, E116.2691643), Google Direction API returns information of riding from this point to (N39.9637251, E116.2691643) in JavaScript Object Notation (JSON). The feedback script shows the first step is a walking length of 461 meters to a metro station (Fig. 7), where the rider could make a transit to point (N39.9637251, E116.2691643). The walking distances to transit access points when an individual is making the transit to west, north, and east can also be obtained in the same way. The number 0.461 (in kilometers) is averaged with other three distances to be accessibility indicator for the cell whose center is (N40.0137251, E116.2691643).
When all the accessibility indicators for the 5032 cell areas were obtained, they were reconstructed in a map according to their center coordinates (Fig. 8). Cells with short access distances were perceived as good indicators and colored in light orange.
4.2. Validation of the Approach
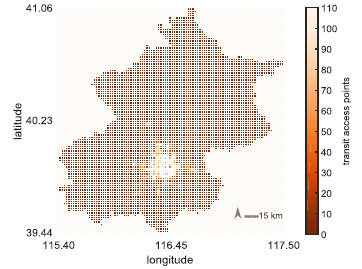
Geographic data of 23 664 bus stops and 348 subway stations were collected from open data sources (source: www.bjbus.com and www.bjsubway.com) to validate the API probing method. Bus stops and metro stations were treated equally as transit access points in the procedure. Transit access points were projected into the gridded cell areas, as shown in Fig. (9).
The spatial distribution of transit accessibility was found sharing a similar pattern with the number of public transit access points. In cells near the city center, transit access distances were found being shorter than cells in the suburb, and these cells were also found having more transit access points. On the other hand, the suburban cells were found having less number of transit access points with longer access distances to transit points.
When xi and yi were calculated, r = -0.326 and R2= 0.780. The number of r turned out to be minus, so the results suggested that the outputs of API probing had a negative correlation with the spatial distribution of public transit stations (Fig. 10).
5. DISCUSSION AND CONCLUSION
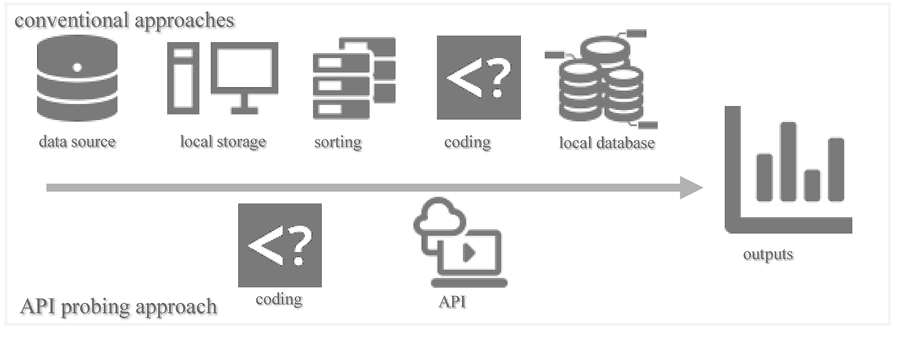
Conventionally, geographic data of transit access points and built environment are collected into local computers. The data are then rearranged for further analysis. Coding work is also included in the process. All the procedures are tedious for the researchers. Whereas, the procedure of the API probing needs no data collection. Researchers need only to define the study area and the number of grids, and Google Cloud Platform handles all the geographical computation. The advantages of utilizing open API services include: (1) almost no data collection; (2) less demanding for local computing resources; (3) the whole procedure being duplicatable; (4) and the results are easy to be examined by other researchers. The API probing approach has greatly simplified the procedure of measuring accessibility compared with conventional approaches (Fig. 10).

However, some limitations should be noticed. (1) The API probing approach is based on sampling, which means a sample point is used to represent a gridded cell area, and this causes errors. The smaller the grid, the smaller the errors (Fig. 11). However, too many cells bring more inquiry tasks and are more time-consuming. Validation using smaller grids was not conducted in this work. (2) The Google Direction API engines also undergo updates, and this causes feedbacked changes. (3) Travel purpose, socio-economics characteristics all have strong impacts on walking to the transit access points [10, 39], but these problems have not been addressed in this work. (4) Another limitation is that the reliability test and application only validated in the perspective of station distribution, further researches are needed to make this new approach more applicable to more scenarios.
These limitations suggest that the API probing approach may not fit all scenarios. Smaller grids are recommended if there is no time restriction. A further improvement over the approach could be made if problems of multi-size grids, information of riders, updates of API engine could be considered.
CONCLUSION
The conclusions could be drawn as follows:
Google Direction API might provide an efficient way of measuring public transit accessibility; open sources that provide API services could be considered in the procedures of transportation researches; open API services would function better when their drawbacks could be addressed.
CONSENT FOR PUBLICATION
Not applicable.
AVAILABILITY OF DATA AND MATERIALS
Not applicable.
FUNDING
The authors acknowledge the financial support from the Strategic Priorities Research Program of the Chinese Academy of Sciences (Grant No. XDA19040403) and financial support from National Natural Science Foundation of China (No. 41771134).
CONFLICT OF INTEREST
The authors declare no conflict of interest, financial or otherwise.
ACKNOWLEDGEMENTS
Declared none.

