All published articles of this journal are available on ScienceDirect.

Comparisons Between Braking Experiments and Longitudinal Train Dynamics Using Friction Coefficient and Braking Pressure Modeling in a Freight Train
Abstract
Background:
This paper describes the predictions and validation of the pneumatic emergency braking performance of a freight train consisting of a locomotive and 20 wagons, generally operated in Korea. It suggests the possibility of replacing the expensive and time-consuming train running tests with longitudinal train dynamic simulations.
Methods:
The simulation of longitudinal train dynamics of a freight train uses the time integration method of EN 14531. For reasonable simulation results, the characteristics of the train and brake equipment must be considered. For the train characteristics, specifications provided by the vehicle manufacturer are used. The braking characteristics are analyzed by friction coefficient tests and a braking pressure model. The friction coefficients of a locomotive and wagons are tested with a dynamo test bench and statistically expanded to account for variability. Freight trains should take into account the braking delay time. To reflect this in the simulation, the brake cylinder pressure pattern model uses pressures and exponential empirical equations measured at selective positions in a train of 50 vehicles. The simulation results are validated in comparison with those of the braking tests of a freight train consisting of 1 locomotive and 20 wagons.
Results:
The results of the longitudinal dynamics simulation show very similar results to the running test results based on the speed profile and braking distance.
Conclusion:
In particular, the statistical expansion method of the friction coefficient enables robust prediction of the distribution of the braking distance. The simulation can reduce or make up for costly and time-consuming repeated braking tests and reduce the risks that may arise during testing.
1. INTRODUCTION
Since the 1990s, as Korea's industrial structure changed from mass production to multi-variety small-scale production, road freight transport has rapidly increased while freight transport by railroad has been decreased [1].
Recently, according to the government policy for improving the economic efficiency of freight trains and linking with continental railroad routes such as TSR (Trans-Siberian Railway) and TCR (Trans China Railway), the demand for freight transport by rail has been increased [2, 3]. According to the operating company's freight vehicle plan, orders for new freight trains are expected to increase rapidly within the next two years [4].
Newly introduced freight trains are required to prove their performance in accordance with the Railroad Safety Act [5]. If the performance cannot be proved by the design data, it is necessary to carry out repeated running tests.
In particular, the braking performance of a freight train is one of the most important performance because it is closely related to safety, but it has only been proven by running tests. The running tests are time consuming and expensive, such as the cost of rail use, installation of measuring devices, and disruption in commercial train operation during the tests.
This study suggests that Longitudinal Train Dynamics (LTD) simulation can be a method to prove the braking performance of a freight train. One of the classic applications of LTD simulation is to predict the in-train force depending on the brake system characteristics such as the delay time and brake pressure rising pattern [6-8]. LTD simulation can also be used to predict the force acting on the connector when the train is traveling on a curve or slope [9-13]. LTD simulation is also known as a suitable method for predicting braking performance [6, 7, 14, 15]. The key to LTD simulation depends on properly modeling the braking properties such as friction coefficients and braking pressures [6, 14, 16].
In previous LTD studies, the coefficient of friction was applied to assume a constant value [7-10, 12, 17]. However, the coefficient of friction presents conspicuous variations due to material hardness, surface roughness, pressure, friction speed, presence and type of lubricant, temperature and contamination [18, 19]. In this study, the results of the friction coefficient test are analyzed and the variation of the friction coefficient is considered in the LTD simulation for predicting braking performance.
The brake pressure rise pattern is affected by the pipe length, diameter, fittings and valves installed in a vehicle [16]. Therefore, it could vary depending on vehicle design. In this study, braking pressures are measured at selected vehicle positions on a train and modeled using an exponential empirical model. The results of the LTD simulation are compared and verified with the results of the repeated running brake tests.
2. FREIGHT TRAIN SPECIFICATIONS AND BRAKING SYSTEM
A freight train consists of a locomotive and a number of wagons. The locomotive generates compressed air necessary for braking and can be classified into a diesel locomotive or an electric locomotive according to the traction power. Depending on the type of cargo, wagons can be classified into the bulk wagon, a flatbed wagon carrying containers, etc.
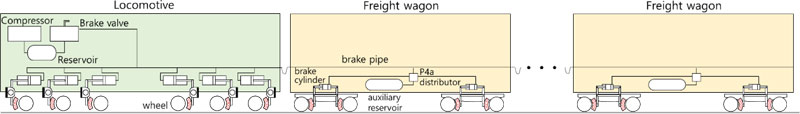
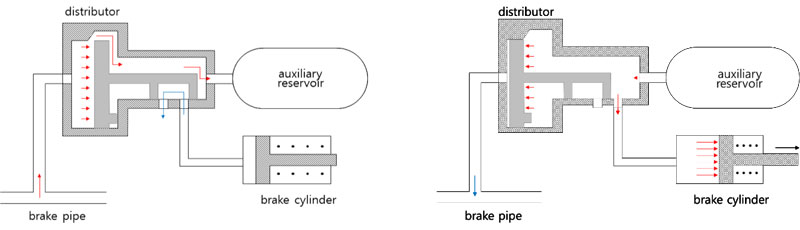
In this study, a freight train consisting of one 7600 series electric locomotive, which was introduced since 2014, and 20 flatbed wagons was studied. The braking system for the freight train uses pneumatics, as shown in Fig. (1). The compressed air from the locomotive's compressor is stored in the locomotive's reservoir. It is supplied to the auxiliary reservoir of each wagon through the brake pipe connected to the end of the train (Fig. 2a).
When the braking is necessary, the driver operates the brake valve, the pressure of the brake pipe is released to the atmosphere, and the compressed air in the storage tank is supplied to the brake cylinder in a locomotive. In a wagon, the air is supplied from the auxiliary reservoir to the brake cylinder through the pressure drop of the brake pipe with the unique structure of the distribution valve (Fig. 2b).
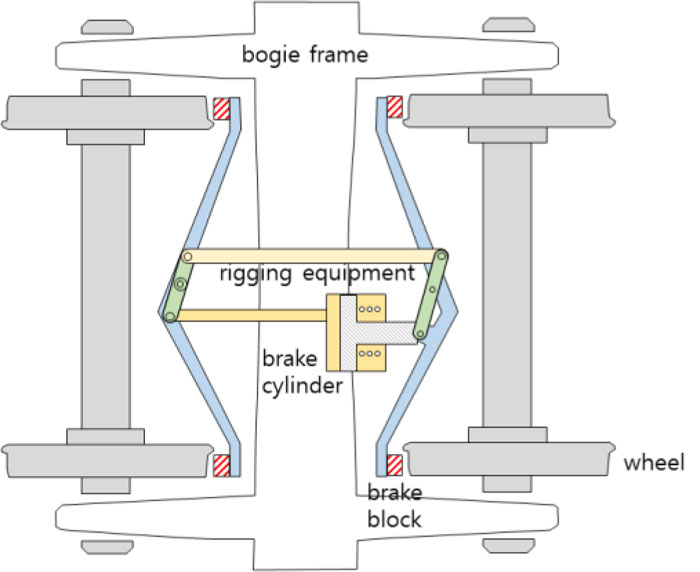
As shown in Fig. (3), when compressed air is supplied to the brake cylinder, the amplified braking force is transmitted to the brake shoe through the rigging equipment of the same principle as the lever, and rubs against the wheel (tread brake system). Table 1 shows the brake system and specifications of the freight train.
During braking, the movements and acting forces on the train can be defined as the sum of the braking, running, curving, and gradient resistances.
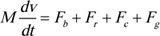 |
Where M is the total weight of the train,v is the speed of the train, Fb is the braking force, Fr is the running resistance, Fc is the curve resistance, and Fg is the gradient resistance.
The running resistance is expressed by an empirical formula, which is composed of friction resistance and air resistance. Curving resistance is also included by another empirical formula related only to the curve radius. The gradient resistance is the parallel component of the vehicle weight. Thus, the basic forces can be defined as
 |
| Specifications | 7600 Series Electric Locomotive |
Flatbed Wagon |
|---|---|---|
| Quantity | 1 | 20 |
| Weight (empty) [tonne] | 132 | 22 |
| Vehicle length [m] | 22 | 13.7 |
| Wheel diameter [mm] | 1067 | 860 |
| Brake cylinder Area [m2] | 0.0506 | 0.0730 |
| Brake efficiency [-] | 0.97 | 0.97 |
| Rigging ratio [-] | 2 | 5.25 |
| Braking pressure, empty [bar] | 4.5 | 1 |
| Cylinder quantity | 10 | 2 |
| Number of brake shoes per brake cylinder [Qnty] | 1 | 4 |
Where A, B, and C are the relevant coefficients for the running resistance, R is the curve radius in meters, and i is the thousandth of the gradient [20, 21]. In braking on a straight flat track, other terms are negligible except for running resistance.
The braking force can be simplified as follows.
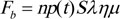 |
Where Fb is the air brake force of each car, n is the number of brake cylinders, S is the area of the cylinder piston, λ is the rigging ratio, η is force transmission efficiency, µ is the equivalent friction coefficient of a brake shoe, and p(t) is the brake pressure. In the braking force, it is determined by the mechanical specification except for the friction coefficient and braking pressure.
3. EXPERIMENTS AND MODELING METHODS
3.1. Friction Coefficients
The friction coefficient, in general, varies depending on material properties and thus is not constant. In this study, with reference to UIC 541-4 [18], which stipulated the test conditions for the composite brake shoe for railway vehicles, a short program was constructed as shown in Table 2 [22, 23], and friction material testing was performed using a brake bench (Fig. 4). The locomotive and wagon had different wheel diameters and different brake shoe suppliers, so friction coefficient tests were performed in each case. The program in Table 2 was repeated four times. Since a locomotive can tow passenger cars with a higher speed than freight wagon, the coefficient of friction has been tested even at speeds higher than wagons.
According to UIC 541-4, the average coefficient of friction is influenced by speed and braking force and may have a distribution rather than constant at the same speed. The mean friction coefficient shows that it can be modeled in a linear relationship above a certain speed (60 km/h) [18, 24]. In order to predict the distribution of the mean friction coefficient for use as the input of the LTD simulation, the test results were linearly interpolated and statistically estimated using Confidence Interval (CI) and Prediction Interval (PI) [25].
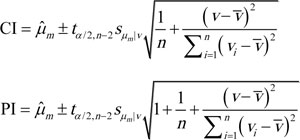 |
 is the estimated mean friction coefficient, t is the t-statistic for the input confidence level and the number of points in the regression data. sµm|v is standard error, n is the number of points in the regression data. v is the speed.
 is the average test speed.
The results of the predicted range of the 95% confidence level of the friction coefficient of the locomotive and wagon are shown in Fig. (5). Table 3 shows the range of the estimated mean friction coefficient of the locomotive and the wagon at the selected speeds. As the confidence level increases, the prediction interval of the friction coefficient increases [25].
3.2. Braking Pressures
Since the brake cylinder pressure patterns of locomotive and wagon are different, modeling is required for each vehicle for LTD simulation. The pressure of the brake cylinder (BC) of the locomotive was measured while the braking operation was in a stationary state. The measured results are shown in Fig. (6). In the locomotive, the brake pipe (BP) pressure rapidly decreases with the braking, and the BC pressure starts to rise. The BC pressure rises rapidly to 1 bar and then linearly to 4.5 bar.
The braking pressure characteristics of the wagon are affected by the pipe and valves used. It also depends on the number of vehicles that make up a train. Models for estimating the braking pressure of the wagons are hydrodynamic and empirical methods. Hydrodynamic and empirical models are used to estimate the braking pressure of the wagon. A hydrodynamic model is a method of physically modeling a vehicle's brake system, such as pipes and valves and performing a fluid dynamic analysis. This method is useful for unknown brake systems, but it is difficult to model and verify all components of the brake system. The empirical method uses limited measurement results. The model has the limitation that it can be applied only to known brake systems, but it has the advantage of providing highly reliable information and a short calculation time [14].
| Locomotive | Wagon | ||
|---|---|---|---|
| Initial Speed [km/h] | Braking Force [kN] | Initial Speed [km/h] | Braking Force [kN] |
| 50 80 100 120 150 165 |
40 | 55 60 75 90 95 120 |
20 |
) ranges for locomotive and wagon at selected speeds.| Speed [km/h] |
95% PI (min) |
95% CI (min) |
Estimated mean |
95% CI (max) |
95% PI (max) | |
|---|---|---|---|---|---|---|
| Locomotive | 60 | 0.325 | 0.357 | 0.372 | 0.387 | 0.419 |
| 80 | 0.299 | 0.333 | 0.345 | 0.356 | 0.391 | |
| 100 | 0.273 | 0.308 | 0.318 | 0.327 | 0.363 | |
| 120 | 0.245 | 0.281 | 0.291 | 0.300 | 0.336 | |
| Wagon | 60 | 0.303 | 0.322 | 0.331 | 0.339 | 0.358 |
| 80 | 0.270 | 0.291 | 0.297 | 0.303 | 0.324 | |
| 100 | 0.236 | 0.256 | 0.264 | 0.271 | 0.291 | |
| 120 | 0.201 | 0.218 | 0.230 | 0.242 | 0.259 |
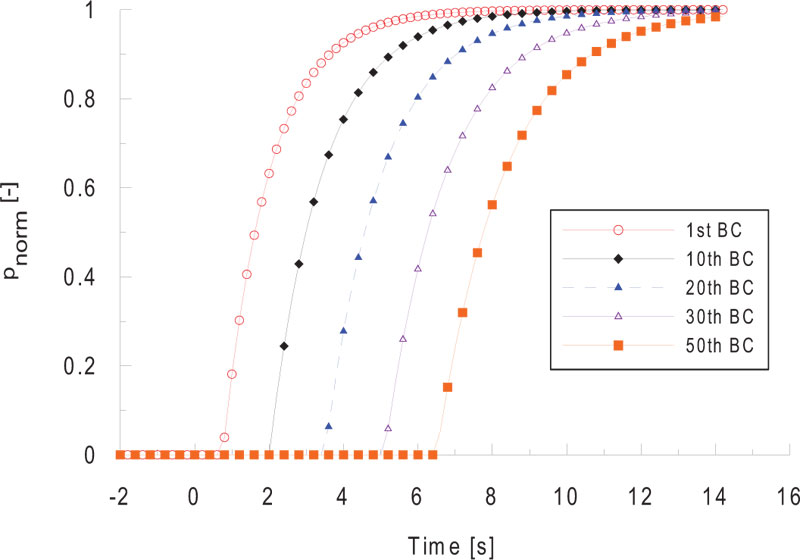
In this study, an empirical model using an exponential function was used for the pattern of braking pressure obtained through a real vehicle test. It consisted of the maximum possible wagons (50 vehicles) to measure the brake pressure pattern according to the configuration, as shown in Fig. (7). The pressure in the brake cylinder was measured on 1st, 10th, 20th, 30th and 50th vehicles at the same time.
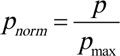
The braking pressure is proportionally controlled according to the loads in order to have a constant braking performance even in the various cargo weight. The maximum measured braking pressure can vary from vehicle to vehicle. Therefore, the pressure in each vehicle was normalized to the maximum pressure, and the results are shown in Fig. (8).
 |
When braking, the BP pressure decreases rapidly, and the BC pressure increases sequentially in the order away from the locomotive. In the 50th vehicle, the braking is engaged about 5 seconds after the first vehicle is fully engaged. In addition, the pressure rise pattern between vehicles showed a similar pressure rise pattern except for the last vehicle. The pressure profile in the last vehicle is similar to the result of [26], and in [27], the pressure transition process is considered as the internal friction and hysteresis characteristics of the distribution valve [28]. The exponential function model simulates pressure rise using an exponential function [29, 30].
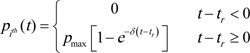 |
Here, pith (t) is braking pressure in each vehicle constituting the train, pmax is the maximum braking pressure achieved when braking, tr is the time when the braking pressure starts to rise, and δ is a characteristic variable according to the brake system. The time delay and the braking characteristic variables at which the braking pressure starts to rise are regressed using the test results and shown in Fig. (9).
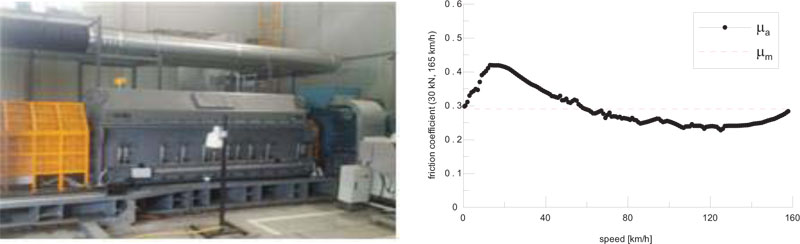
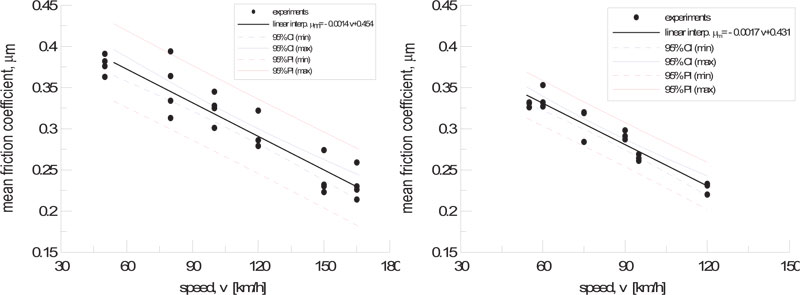
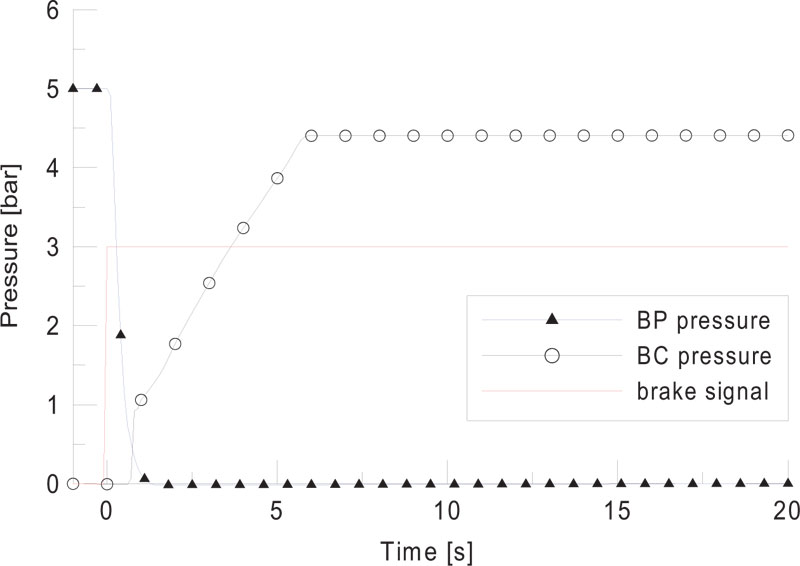
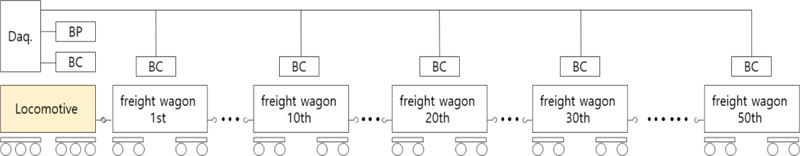
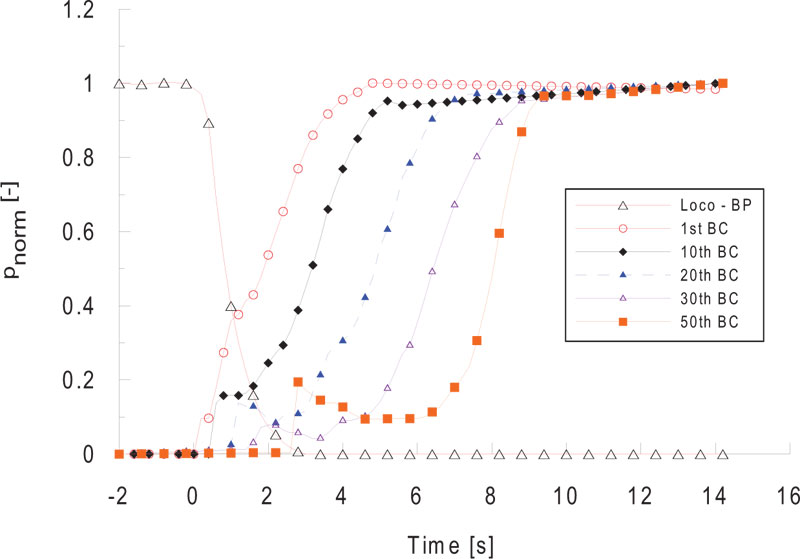
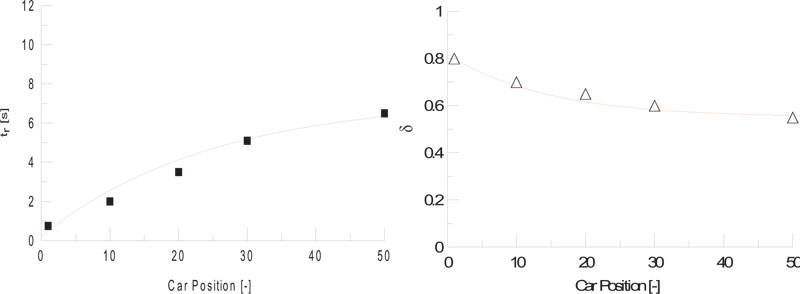
Fig. (10) shows the braking pressure rise pattern reflecting the time delay and characteristic variables. Although the braking characteristics of the last vehicle could not be reflected, relatively similar predictions were made for each vehicle's location.
4. RESULTS
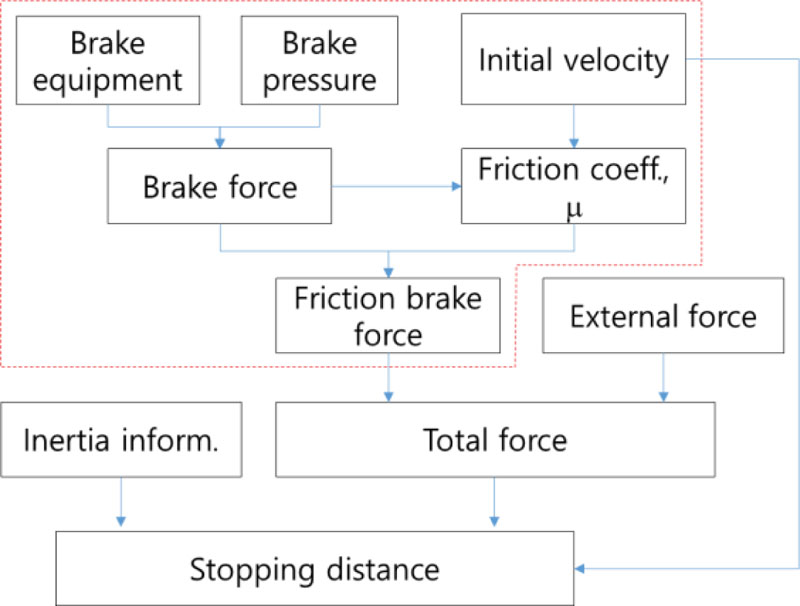
The time integration method presented in EN 14531 is the typical method used for longitudinal train dynamics simulation of a train brake system [28, 31]. In this study, the simulation process, according to EN 14531 in Fig. (11) and friction coefficient, brake pressure modelled from experimental results were used as input data.
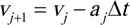
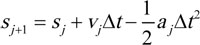
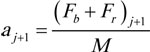
The time integration method, according to EN 14531 at the time t = tj+1 is expressed as follows. Where, j is the time integral segment, ∆t is the computational time interval, s is travel distance and α is deceleration.
Speed
Travel distance
Deceleration
The coefficient of friction was applied to the statistical expansion model of the measured results. The pressure rise was applied to the locomotive through experiments, and the exponential pressure rise model was considered for wagons.
In order to verify the simulation, the braking tests of the freight train consisting of a 7600 series locomotive and 20 wagons were repeatedly performed on a straight flat track. In the test, when the speed of the train reached 120 km/h, the emergency braking was applied until the train completely stopped. The speed of the train during braking was measured using a tachometer installed on the wheel. The test was repeated 10 times.
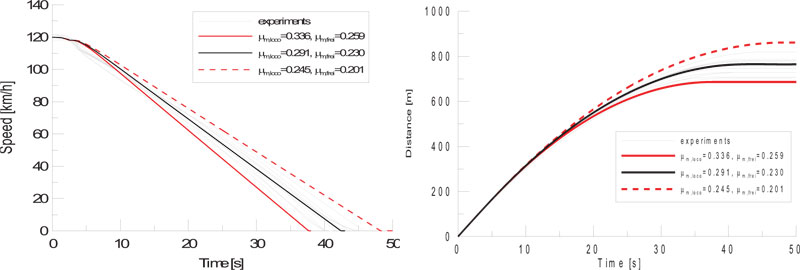
A graph comparing the results of the simulation and the experiment is shown in Fig. (12) and Table 4. The freight train traveling at 120 km/h may have a deviation of about 175 m in the same braking, depending on the variability of the friction coefficient. Except for the initial braking, the results of LTD simulations and tests show very similar trends. In the test, the mean braking distance was 754.9 m and the standard deviation was 38.25 m. In the simulation, the mean braking distance was predicted to be 764.6 m, and the difference from the test was predicted very accurately within 2%. The LTD simulation, which applied the friction coefficient as a 95% prediction interval, covers enough of the experimental results, but it can be approached conservatively by applying a friction coefficient with a high prediction interval.
| µm,loco [-] | µm,wagon [-] | Braking Time [s] | Braking Distance [m] |
|---|---|---|---|
| 0.245 | 0.201 | 48.2 | 860.9 |
| 0.291 | 0.230 | 42.4 | 764.6 |
| 0.336 | 0.259 | 37.7 | 686.0 |
5. DISCUSSION
This study suggests the possibility of replacing or supplementing the brake running tests of a freight train with LTD simulation. LTD simulation requires information on friction coefficients and braking pressure. As a coefficient of friction, the results of the dynamo test are used. The friction coefficients are not constant, even under the same test conditions. This means that the friction coefficient of each vehicle may be different even in the same braking. The brake shoe specifications of Korean freight train operators (KORAIL) allow for a 30% variation of the average friction coefficient [19]. In the simulations, the estimated maximum and minimum friction coefficients are applied to predict braking performance with a statistical method.
As a braking pressure, the braking pressures measured at the selective positions of a train composed of 50 vehicles are used. The pressure characteristics are similar to those of the previous studies [12] and [17]. The pressure in each vehicle is modeled using an exponential empirical model.
LTD simulation results, taking into account friction coefficient variations and empirical pressure model, are compared with the results of repeated field tests. In the comparisons, the braking performance can be properly predicted with LTD simulation. Predicting in-train forces considering the variability of friction coefficients will be covered in future studies.
CONCLUSION
This study is about the possibility of replacing or supplementing a costly and time consuming real-time braking test with LTD simulation. For LTD simulation, the specifications of the vehicles constituting the train, the friction coefficient variation, and the pressure rise pattern of the brake cylinder must be accurately modeled. The friction coefficient test was repeated using a dynamo test bench and statistically extended to predict the distribution. The pressure rise pattern of the brake cylinder was modeled based on the stationary test. In particular, the wagon pressure rise pattern was modeled by an exponential empirical method based on the measurement of the braking cylinder pressure of 50 cars.
The LTD braking simulation used the time integration method of EN 14531 with a friction coefficient of 95% predicted interval and an exponential pressure rise model. The simulation results were compared and verified in terms of the speed profile and braking distance of the running brake tests. The results of this study showed that LTD simulations that faithfully reflect the braking parameters can replace or supplement the running brake tests.
The approach of this study can be used to predict the braking performance when a new brake system such as electronically controlled pneumatic brake is applied or when the number of vehicles constituting a train changes.
In addition, it can be used to accurately predict the amount of impact received by the coupler of the freight train and related devices during braking.
CONSENT FOR PUBLICATION
Not applicable.
AVAILABILITY OF DATA AND MATERIALS
The authors confirm that the data supporting the findings of this research are available within the article.
FUNDING
This research was supported by a grant from R&D Program of the Korea Railroad Research Institute, Republic of Korea under grant no (PK2001B1B).
CONFLICT OF INTEREST
The authors declare no conflict of interest, financial or otherwise.
ACKNOWLEDGEMENTS
Declared none.

