All published articles of this journal are available on ScienceDirect.
Quantifying the Fleet Composition at Full Adoption of Shared Autonomous Electric Vehicles: An Agent-based Approach
Abstract
Aims:
Exploring the impact of full adoption of fit-for-demand shared and autonomous electric vehicles on the passenger vehicle fleet of a society.
Background:
Shared Eutonomous Electric Vehicles (SAEVs) are expected to have a disruptive impact on the mobility sector. Reduced cost for mobility and increased accessibility will induce new mobility demand and the vehicles that provide it will be fit-for-demand vehicles. Both these aspects have been qualitatively covered in recent research, but there have not yet been attempts to quantify fleet compositions in scenarios where passenger transport is dominated by fit-for-demand, one-person autonomous vehicles.
Objective:
To quantify the composition of the future vehicle fleet when all passenger vehicles are autonomous, shared and fit-for-demand and where cheap and accessible mobility has significantly increased the mobility demand.
Methods:
An agent-based model is developed to model detailed travel dynamics of a large population. Numerical data is used to mimic actual driving motions in the Netherlands. Next, passenger vehicle trips are changed to trips with fit-for-demand vehicles, and new mobility demand is added in the form of longer tips, more frequent trips, modal shifts from public transport, redistribution of shared vehicles, and new user groups. Two scenarios are defined for the induced mobility demand from SAEVs, one scenario with limited increased mobility demand, and one scenario with more than double the current mobility demand. Three categories of fit-for-demand vehicles are stochastically mapped to all vehicle trips based on each trip's characteristics. The vehicle categories contain two one-person vehicle types and one multi-person vehicle type.
Results:
The simulations show that at full adoption of SAEVs, the maximum daily number of passenger vehicles on the road increases by 60% to 180%. However, the total fleet size could shrink by up to 90% if the increase in mobility demand is limited. An 80% reduction in fleet size is possible at more than doubling the current mobility demand. Additionally, about three-quarters of the SAEVs can be small one-person vehicles.
Conclusion:
Full adoption of fit-for-demand SAEVs is expected to induce new mobility demand. However, the results of this research indicate that there would be 80% to 90% less vehicles required in such a situation, and the vast majority would be one-person vehicles. Such vehicles are less resource-intense and, because of their size and electric drivetrains, are significantly more energy-efficient than the average current-day vehicle. This research indicates the massive potential of SAEVs to lower both the cost and the environmental impact of the mobility sector. Quantification of these environmental benefits and reduced mobility costs are proposed for further research.
1. INTRODUCTION
Transforming mobility to achieve sustainable passenger transport is one of the main challenges for the transportation sector of the coming decades [1]. Such a transformation can be realized with automation, sharing and the electrification of vehicles [2-6]. The following subsections discuss how automation, sharing, and electrification can change the mobility system and identify that completely transformed mobility systems are partly left unexplored.
1.1. A Transformation of Passenger Mobility
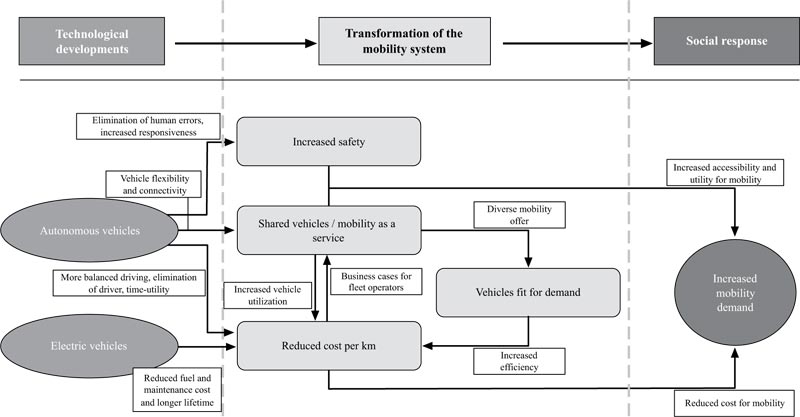
Autonomous and electric driving technologies are expected to have a revolutionary impact on the mobility sector [3, 7-12]. The elimination of the driver and reduced costs of operation could open up a huge market for shared autonomous electric vehicle (SAEV) fleets. Such fleets could provide mobility as a service with high utility, flexibility, and at low costs [13-17]. However, most of the technologies related to SAEVs are under development, and there are no commercial SAEV fleets in operation at the time of writing. Therefore, it is not yet clear if full autonomy of passenger vehicles is feasible in the future, nevertheless it is interesting to investigate how exactly SAEVs might transform the mobility sector. In literature, a variety of those transformative aspects, such as increased safety and vehicle connectivity, can be found. Fig. (1) connects these aspects and visualizes how technological developments can change passenger mobility and trigger a behavioral response.
Fig. (1) shows that increased accessibility, increased utility and reduced cost of mobility lead to an increase in mobility demand. According to the literature, this increase in mobility demand results from:
1. Entry of new user groups such as children, elderly, disabled and people without a driver’s license [13, 18, 19].
2. Modal shifts from public transport towards SAEVs [7, 20, 21].
3. Increased travel in terms of frequency and distance [7],
4. SAEV re-allocation for charging, parking and passenger pick-up [22-24].
Fig. (1) also shows that the adoption of SAEVs leads to a vehicle fleet with fit-for-demand vehicles. According to Dutch mobility behavior data (see section 3.5 Data), about 60% of passenger vehicle trips in the Netherlands are single-person trips. And part of the 40% remaining trips are ‘carry-trips’, trips to drop somebody off or to pick them up. A purpose-built SAEV fleet that is fit-for-demand could therefore consist of mainly one-person vehicles. Of course, also other options, such as premium and multi-person vehicles for business meetings or family trips, will be offered in a transformed mobility system.
1.2. Vehicle Fleet Sizes with SAEVs
Increasing mobility demand, switching to electric vehicles and using fit-for-demand vehicles will greatly affect the environmental impact of passenger transport. However, also the total fleet size and the composition of the fleet play significant roles. With the idea of sharing fit-for-demand vehicles, the question: ‘how many vehicles would a society require at full adoption of SAEVs?’ arises.
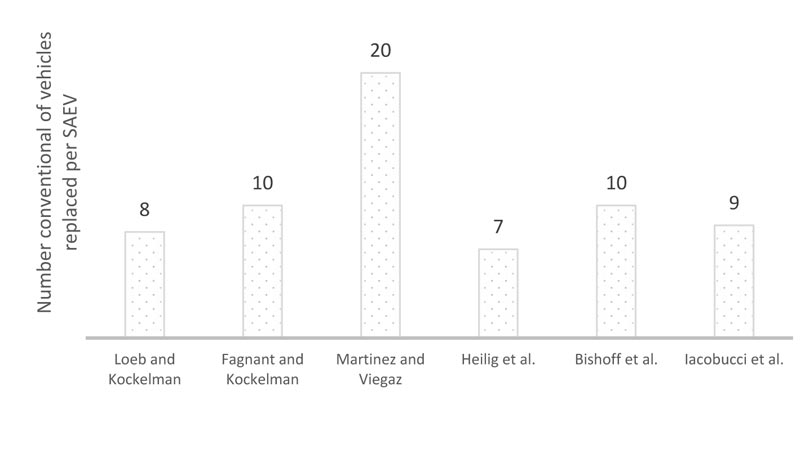
A variety of studies partly explored that question by modelling mobility systems with SAEVs and quantifying the number of vehicles required. In most cases, the results are expressed in terms of how many conventional vehicles can be replaced per adopted SAEV. The resulting value from six of these studies is plotted in Fig. (2). The lowest number of conventional vehicles replaced per SAEV in those studies was seven, as found by Heilig et al. [24]. The highest value for this, twenty vehicles replaced per SAEV, can be found in the research by Martinez and Viegaz [25].
The different results of the modelling studies from Fig. (2) can mainly be explained by the differences in three important aspects of a mobility system with SAEVs. First of all, the modelled mobility demand. Secondly, the re-allocation strategies of SAEVs. And thirdly, whether sequential sharing or parallel sharing is considered [3, 22-27]. Parallel sharing are modes where rides are shared between passengers, and with sequential sharing, passengers finish their trip before the next passenger can occupy the vehicle. Given the recent impact of Covid-19, it is possible that parallel sharing becomes less desirable and less convenient for individuals.
1.3. Research Gap
The previous studies on SAEV and mobility demand, such as depicted in Fig. (2), performed their analyses mainly from a current mobility perspective. In doing so, two important factors of a mobility transformation from SAEVs are being omitted: 1) the increase in mobility demand (called induced mobility demand in the remainder of this article), and 2) the use of fit-for-demand vehicles. Induced demand is frequently discussed in qualitative studies about SAEVs. Literature discussing fit-for-demand vehicles are significantly less common, even though the adoption of fit-for-demand vehicles could have major environmental and societal implications. In terms of quantification, we have not encountered modeling studies that take both induced demand and fit-for-demand into account. With the major societal implications that go hand-in-hand with the adoption of SAEVs, it is important to close this research gap. This article, therefore, presents an agent-based modelling approach to explore and quantitatively predict fleet compositions in such scenarios. Mobility data of the Netherlands is used as a case study to quantify the number of vehicles required and the fleet compositions in a high and low scenario of SAEV induced demand.
1.4. Article Outline
The next section discusses previous modelling studies on SAEV fleet sizes and clearly identifies that exploring the combination of SAEV induced demand and fit-for-demand vehicles are lacking in the literature. The third section discusses the modeling approach and the data implementation for the case study. The results demonstrate the simulation outcomes, discuss the real-world applicability limitations, and explain how the model can be used in further research. Finally, the conclusion summarizes the findings and contributions of this research.
2. RELATED MODELLING WORK
This section goes through previous studies on SAEV fleet sizes and SAEV dynamics with agent-based modelling. In Appendix A, a short overview of these studies is provided in the form of a table.
2.1. Previous Modelling Studies on SAEV Fleet Quantification
Martinez and Viegas [25] used an agent-based approach to study the fleet size, travel times and CO2 emissions when ride-sharing SAEVs replace all car and bus trips in Lisbon. They found that CO2 emissions can be reduced by up to 40% and congestion by 30%. The vehicle-kilometres per day increase from 30 km per vehicle to 250 km per vehicle. This could imply that one SAEV replaces about 8 privately owned passenger vehicles. However, induced demand was excluded in this study, and the SAEVs were comparable to current day taxis.
Fagnant and Kockelman [22] developed an agent-based model to study the fleet requirements and environmental impact of a SAEV fleet when trips are generated in a grid-based neighbourhood. The study only looked at ride-sharing. The results indicated a replacement rate of 11 vehicles per SAEV and increased travel distances of 10% due to re-allocation and pick up.
Heilig et al. [24] modelled the mobility behaviour of the city of Stuttgart and excluded the private vehicles as a modality option while adding SAVs. Current trips with private vehicles were in this study performed by the other available modes (including SAVs). As a result, number of trips with all modes, such as walking and bus trips, increased. The study involved only ride-sharing SAEVs and assumed that the conditions of using SAEVs are similar to that of current-day private cars. Trips within the same 15 minute timeslot and with the same destination and departure zones are bundled in SAEVs. The results show that the number of vehicle trips reduces by 46%, the vehicle kilometres by 20%, and that a fleet size can be reduced to 15%. The number of vehicle trips reduced because of modal shifts from vehicles towards other modes. Modal shifts from public transport towards SAEVs and induced mobility demand were not considered. In our opinion, this study fails to depict a realistic picture of the future mobility system, and it also assumes a high willingness to share rides with other passengers.
Iacobucci et al. [23, 32] studied fleet size and charging dynamics of a SAEV fleet in order to assess power grid integration. Car and taxi trip dynamics of Tokyo were implemented. They found that more trips per hour with SAEVs result in shorter waiting times for trips. From a fleet size that equals 1.4 times the number of trips per hour, the waiting times seem to converge to 15 to 25 minutes depending on the number of trips per hour. This implied about 5-7 vehicles per 100 trips per day, and one SAEV would replace 7 to 10 private vehicles. Improved traffic fluidity with SAEVs was not taken into account as a driving speed during the peak hour of 20 km/hr was applied. Charge scheduling and V2G (vehicle-to-grid) employment was found to reduce the cost/km by 33% in the case of high adoption of renewable energy. V2G and charge scheduling were set up such that they did not influence the service level of the SAEV fleet.
2.2. Other Modelling Studies on SAEV Systems
Several studies developed agent-based models to assess the impacts of SAEVs on urban space and parking demand. Zhang et al. [28] developed a ride-sharing agent-based model and concluded that parking demand can be reduced by about 90% with sufficient SAVs in the system. The authors argue that at the expense of vehicle-miles-travelled, even greater reductions can be achieved. Miliard-Ball [29] identified and modelled three strategies for how private autonomous vehicles could avoid parking costs in city centres. He argues that autonomous electric vehicles have the incentive to cause congestion and advocates congestion tariffs in order to counteract this effect. However, he states that shared fleets will reduce the induced congestion, and he did not take increased driving fluidity and more packed parking of autonomous vehicles into account.
Other studies looked at SAEV demand as a last/first-mile solution through integration with a Public Transport (PT) system. Scheltes et al. [30] concluded that, in their case study, a last-mile solution of a 1.8 km connection from a train station to a university campus, an automated last-mile transport system may have difficulties to compete with bicycles. However, they pointed out there are benefits that can be obtained by using existing road infrastructure with SAEVs as opposed to constructing new rails or roads. In the agent-based model of Shen et al. [31], passengers on the least economical bus routes from a metro station in Singapore were transported their last mile with SAEVs instead of with buses. They found increased service quality, financial benefits and less congestion as a result of SAEV implementation.
Kamel et al. [20] developed an agent-based model to simulate modal choices of a synthetic population of travellers based on heterogeneous user preferences. Whenever a trip is generated, a trip score representing the disutility of a specific modality, is calculated for all the available modalities. The model was calibrated with travel data from Paris, after which hypothetical user preferences for SAVs were implemented. 3.8 to 5.3 percent of the trips would be made with SAVs in a situation with their hypothetical preferences. The authors suggest further research into user preferences of SAVs in order to draw adequate conclusions for modal choices with SAV systems.
Papadoulis et al. [15] modelled autonomous driving behavior on motorways and assessed the safety consequences of connected EVs., using platoons. They found that with 25% penetration of connected AVs, up to 47% of road accidents can be avoided. At 100% adoption, this increases to about 95%. Although less accidents, travel time increased with higher AV adoption because long vehicle platoons with a slow leader reduced the average travel speeds significantly. They note that this result is susceptible to the desired speed distribution in their model.
2.3. Summary of Literature
Previous modelling studies of SAEV fleets have predominantly looked at niche solutions for SA(E)Vs from the perspective of current mobility demand. None of the mentioned studies explored a mobility system where passenger transport is dominated by purpose-built, fit-for-demand, one-person vehicles and where SAEVs induce new mobility demand. As such, in scientific literature, there have been no attempts to actually quantify the fleet composition in a completely transformed mobility system with fit-for-demand vehicles.
3. METHODOLOGY
This section elaborates on the modelling approach to quantify the fleet composition in full adoption scenarios of SAEVs. The agent-based methodology, modelling mobility behavior, SAEV induced demand, and fit-for-demand SAEV are discussed. Section 3.5 elaborates on data sources, input parameters and input distributions.
3.1. Agent-based Modelling to Study Mobility Demand
The mobility behaviour of a population can be modelled in many different ways. Depending on the research focus, elements like traffic fluidity, geo-spatial routing, modal choices, micro-economics, and consumer preferences can all be taken into account. In this research, the aim is to assess the number of SAEVs required for passenger mobility at full adoption of SAEVs. A realistic narrative for the temporal mobility demand of a representative synthetic population is therefore key. As such, the main focus of our model approach is: when people go on what type of trip and with what transport mode. Agent-Based Modelling (ABM) is a perfect fit for this as it is designed to model heterogeneous decision-making processes of large populations [33].
A major advantage of agent-based models is straightforward calibration with real-world data due to the intrinsic connection between real-world entities, such as people and vehicles, and the modelled agents, such as people-agents and vehicle-agents [34]. It is also an efficient method for both ‘what-if’ analyses and modifying the model-logic once a base model is developed. For example, with an agent-based model that simulates mobility demand with people-agents that make biking and passenger vehicle trips, a new transport mode, such as trains or autonomous vehicles, can be added with minor changes to decision trees and input parameters.
3.2. Modelling Mobility Behaviour
The core of the model is a population of people-agents where each agent decides on daily trip patterns based on their individual preferences at the start of each day. For example, ‘Person 345’ is an adult woman who lives 40 km from her work and commutes by car. She leaves in the morning at her preferred departure time and comes back in the afternoon. On some days, she may go shopping or to the gym in the evening, on other days, she does not make any leisure trips. ‘Person 1012’ is 71 years old man that does not work but does own a car. He may undertake visiting or shopping trips several times a week, it is possible that he makes three trips a day, but that does not happen often.
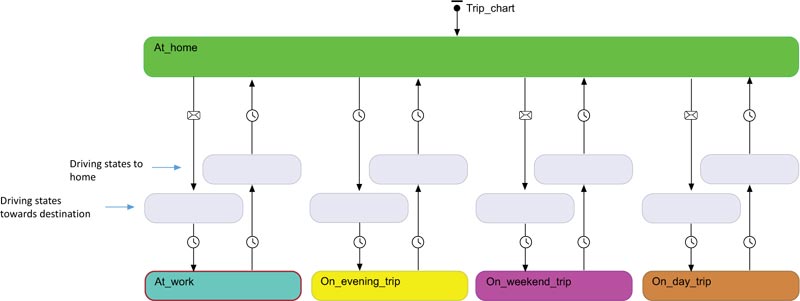
At the start of a simulation, 10.000 people-agents are created. In time steps of minutes, their mobility behaviour with passenger vehicles throughout the day is simulated with a state diagram. Some agents make trips with other transport modes, like public transport; those trips are tracked with variables, not with a state diagram. In agent-based modelling, state diagrams are a useful tool to keep track of agent-states, for example, physical activity, location, or the level of happiness. A state diagram can only have one active state, but a single agent can have multiple state diagrams. State transitions can happen through a variety of interactions and timers that are defined by the modeller. In our model, the mobility state of each adult-agent (all people-agents with age > 18) is determined with the mobility state diagram of Fig. (3).
Adults start in the state ‘At home’ and can move throughout the day to other states, for example, to ‘At work’ via ‘Driving to work’. Departure from home or another location is triggered by a timer that is stochastically set at the start of each day based on that specific agents’ mobility parameters and variables (departure time distribution, probability of making trips, distance to work, trip type, etc.). These mobility parameters and variables are dictated by the input settings of the model. In this research, these are defined based on Dutch mobility data (see section 3.5). Elderly-agents follow the same state diagram, but their parameters are set up to fit driving patterns of the elderly based on the same Dutch mobility data. Children have a slightly different state diagram that involves school instead of work.
The heterogeneity of mobility behaviour within the population results from a combination of socio-demographic spread and preferences for mobility demand. Both are attributed to the agents’ population through distributions of age, departure times, modal choices, trip durations, and trip distances (see section 3.5). The distributions that prescribe trip characteristics vary per trip type. School trips, commuting trips and leisure trips all have different distance and departure time distributions associated with them. Also, different socio-demographic groups have different values for their trip parameters. Table 1 shows the split in socio-demographic groups in the model and the type of tips each of those groups make.
| Category | Age Group | Mobility Characteristics |
|---|---|---|
| Very young children | 0 – 6 y/o | No mobility demands |
| Young children | 6 – 12 y/o | Primary school, infrequent leisure trips |
| Teenage children | 12 – 18 y/o | Secondary school, leisure trips |
| Commuting adults | 18 – 69 y/o | Commuting and leisure trips |
| Non-commuting adults | 18 – 69 y/o | Leisure trips |
| Elderly | 69 + y/o | Leisure trips |
Trips with passenger vehicles can be made as passengers and as drivers. Therefore, to avoid double counting a trip, the number of vehicles required should only be measured by the trips made as drivers. For example, trips made by children are not specifically modelled as a trip with a vehicle from the perspective of the child, They are counted by the carry trips made by their parents. This is not modelled specifically but follows from the implementation of the Dutch mobility data (section 3.5).
3.3. Modelling SAEV Usage and Scenarios
A parameter is added that dictates the percentage of the population using SAEVs. Whenever a person departs with an SAEV, a SAEV agent is created that virtually picks up the passenger and takes them to their destination. Each person using SAEVs makes longer trips, more frequent trips, their public transport trips can be shifted to SAEVs, and they add a relocation time to the SAEV after the trip. Also, some children and elderly that initially did not make trips with passenger vehicles can use SAEVs for trips. The parametrisation of these dynamics and the probabilities of trips and modal shifts happening define the induced demand scenario. The induced demand scenario can be varied each simulation run. In this article, three scenarios are explored:
- A reference scenario with the current mobility demand, i.e., no induced demand,
- A SAEV low scenario with relatively low values for induced demand, and
- A SAEV high scenario with relatively high values for demand.
The exact values used for the per scenario are shown in Table 2. The values of the reference scenario are based on the data analysis of the Dutch mobility behaviour (section 3.5 Data). The additional vehicle usage time and additional mileage for re-allocation of SAEVs are set at 10%, based on the findings of Fagnant and Kockelman in their study on re-allocation of SAEVs with a geo-spatial model [22]. The remaining values are, after careful consideration, based on our best estimates for a high and low scenario of induced demand since there are no previous studies that explored full adoption SAEV scenarios with induced demand to this extend. Our agent-based modelling approach allows for easy adjustments of these values when more accurate estimates becomes available.
3.4. Modelling Fit-for-demand
To explore the fleet composition required in the SAEV scenarios, trip distances and user preferences are probabilistically linked to fit-for-demand vehicle types. Three types of SAEVs are implemented: basic SAEVs, standard SAEVs and premium SAEVs. Basic SAEVs represent simple one-person vehicles for short-range mobility demand in urban areas. Standard SAEVs provide more room and/or power for, for example, longer distance trips. Premium SAEVs represent SAEVs used for trips such as family, holiday or luxury trips.
The choice model that prescribes SAEV types to trips is shown in Table 3. A simple choice model is applied as it is difficult to argue for more detailed and complex choice models without further knowledge of SAEV consumer behaviour. When more data is available, the choice model is easily adapted and improved. The current values of the choice model follow from reasoning that basic SAEVs are designed for short trips and that a certain percentage of the trips will be made with premium SAEVs.
| Parameter | Reference Scenario | SAEV Low Scenario | SAEV High Scenario |
|---|---|---|---|
| Percentage of SAEV usage | 0% | 100% of adults | 100% of adults |
| Probability of shifting from public transport to SAEV | 0% | 10% | 60% |
| Re-allocation time* | 0% | 10% of trip time | 10% of trip time |
| Re-allocation distance* | 0% | 10% of trip distance | 10% of trip distance |
| Avg. increase of trip distances | 0% | 5% | 30% |
| Elderly first trip probability | 18% | 25% | 40% |
| Elderly additional trip probabilities | 0% | 10% | 25% |
| Non-commuting adult day trip probability | 68% | 72% | 78% |
| Adult additional trip probability | 25% | 30% | 40% |
| Perc. teenage children using SAEVs | 0% | 10% | 40% |
| Teenage children avg. SAEV trip distance | 0 km | 6 km | 12 km |
| Perc. young children using SAEVs | 0% | 10% | 25% |
| Young children avg. SAEV trip distance | 0 km | 5 km | 8 km |
| Type of SAEV | Trip Characteristics | Vehicle Characteristics |
|---|---|---|
| Basic SAEV | Trips < 15 km, and trips made by children | 1-person, low luxury, mainly for urban environment |
| Standard SAEV | Trips > 15 km | 1-person, avg luxury, fit for longer trips |
| Premium SAEV | All trips for adults and elderly have a probability of 0.2 to become a trip with a premium SAEV | Multi-person, high luxury, fit for longer trips |
Energy consumption of vehicles and battery technologies are expected to make significant improvements during the next decades [7]. It is, therefore, reasonable to assume that SAEVs last a full day on a single charge. Charging of the SAEVs would occur when a vehicle is not in demand, for example, during nighttime. This means that the utilization of the SAEV fleets can be modelled without the complexity charging constraints.
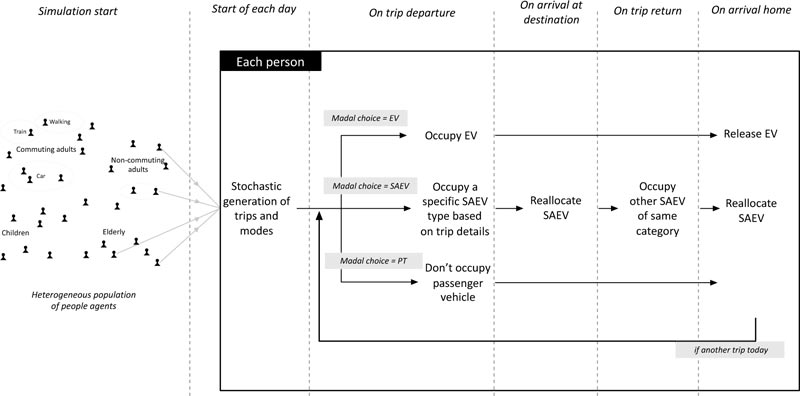
A conceptual overview of how the model runs is shown in Fig. (4). At the start of a simulation run, the agent-population is created. During the simulation, individual people-agents plan a daily trip pattern at the start of each day. As explained at the beginning of this section, the heterogeneity of these trip patterns follows from the input distributions, and these differ for each socio-demographic group as defined in Table 1. During the day, the planned trips are carried out with their respective modes of travel. In the reference scenario, private vehicles are used for trips with passenger vehicles, while in the SAEV scenarios, these trips are performed with SAEVs. SAEVs are reallocated after each trip.
3.5. Data
Two data sources were used to determine the input values for the model and, as such, define the case study of this article. The first is the expected age distribution of the Netherlands in 2050 [35]. This distribution prescribes ages to the people-agents. Due to phasing out of privately owned vehicles, it seems reasonable to assume that full adoption will not occur during the next two decades. For this reason, the age distribution of 2050 instead of the current age distribution is used.
The second data source contains mobility behaviour from the Netherlands. This is a dataset resulting from a survey with about 40.000 respondents that is yearly gathered by Statistics Netherlands [36]. It contains socio-demographics of the respondents and a rich amount of details on the daily trip pattern they had on a specific day, among which the travel modes, departure times, trip purposes, arrival times, and other passengers. In total, about 200.000 trips are logged. The data is added to the supplementary material of this paper.
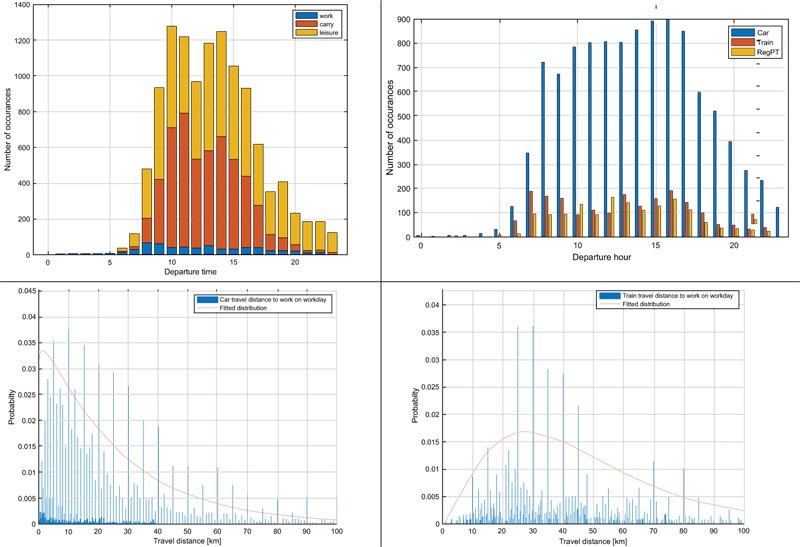
After filtering the Dutch mobility data for weekdays, distributions that prescribe the mobility patterns for the socio-demographic groups of Table 1 were extracted. Fig. (5) shows four examples of this. The top-right graph of Fig. (5) contains the departure times of non-commuting adults with each transport mode. This distribution is implemented in the model such that the non-commuting adults of the population follow these departure times with the corresponding transport modes. Other distributions, including the remaining three in Fig. (5), such as trip distances and public transport trips, are implemented in the same way. More details on this and the values of the distributions can be found in the model itself, which is openly available (see section 4.5).
4. RESULTS AND DISCUSSION
This section demonstrates and discusses the simulation outcomes that quantify the potential future mobility demand and SAEV fleet composition in the Netherlands. The last subsection explains how the open-source model can be applied to other case studies and different SAEV scenarios.
4.1. Impact of Induced Demand on the Vehicle-miles-travelled
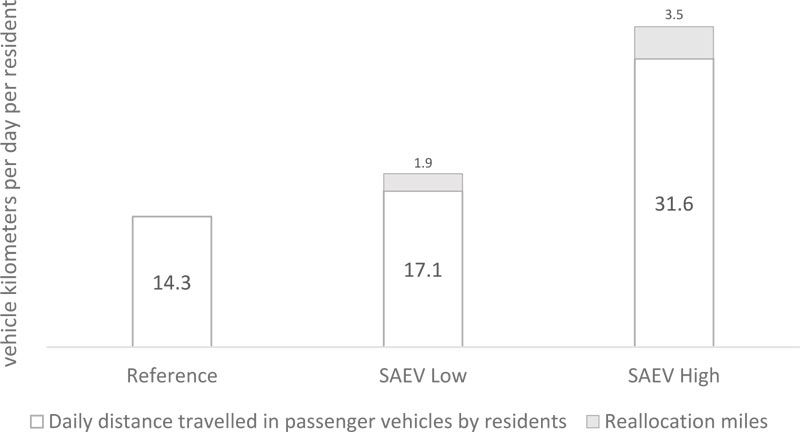
The induced mobility demand of SAEVs results in an increase in the Vehicle-Miles-Travelled (VMT) per resident. Fig. (6) shows that the average VMT in the Netherlands increases from 14.3 km/day per resident to 19.0 km/day (+33%) per resident in the SAEV Low scenario and to 35.1 km/day (+145%) per resident in the SAEV High scenario. Part of this additional mileage is re-allocation miles, which is mileage made without passengers.
4.2. Number of Vehicles Required
Fig. (7) shows an example of Dutch vehicle utilization during a day in the reference scenario. In the reference scenario, which simulates the current mobility demand of the Netherlands, the maximum number of simultaneous vehicles on the road reaches about 500.000 vehicles. The number of vehicles occupied peaks around 12:00 o’clock at almost 3.250.000 vehicles. The difference of 2.75 million vehicles is a result of the underutilization of vehicle assets in a mobility system with privately owned vehicles. The magnitude of underutilization in the Netherlands is in fact, much higher, as there are about 8.5 million passenger vehicles in the Netherlands.

The model simulates the time a vehicle is in use based on the distance of the trip and an average driving speed. The average driving speed is a function of the trip distance via a gamma distribution extracted from the Dutch mobility data. This gamma distribution, which can be found in our model, is time-invariant, while in practice, driving speeds differ throughout the day, specifically during rush hours. Thus, in practice, the higher and wider peak of vehicle utilization is expected than those in Fig. (7).
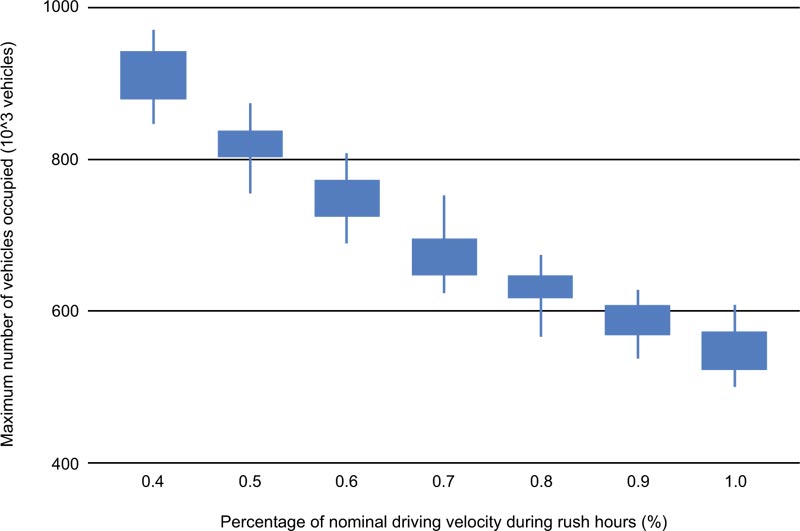
As no specific data is available on reduced driving speeds during rush hours in the Netherlands, a sensitivity analysis on reduced driving speeds during peak hours is performed. The results, demonstrated in Fig. (8), show that the morning peak of the number of vehicles on the road increases gradually from 500.000 to 900.000 as the driving velocities during rush hours reduce from 100% to 40% of the nominal driving velocities. However, reduced driving speeds during peak hours are not necessarily applicable to SAEV scenarios. Autonomous driving might increase driving speeds due to traffic smoothening, optimised driving, less accidents, and increased speed limits. Therefore, the dynamics of reducing driving speeds are not applied when simulating the SAEV scenarios.
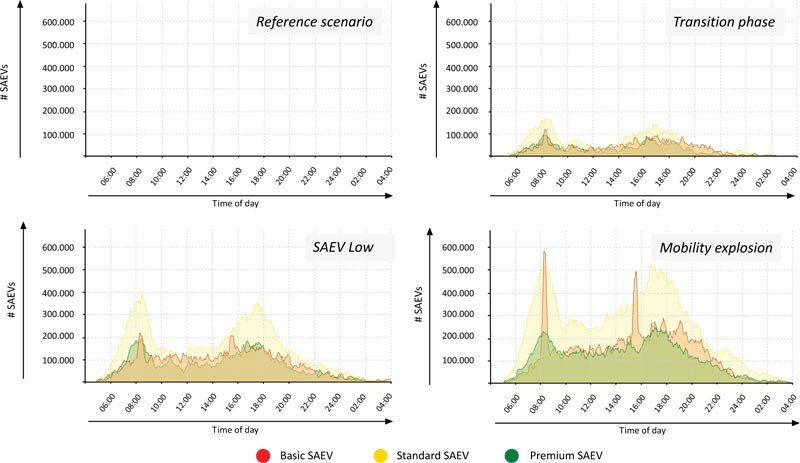
The vehicle utilization in the SAEV scenarios is shown below in Fig. (9). Re-allocation of the SAEVs for charging, picking up passengers, etc., is included in these graphs. The maximum number of SAEVs on the road thus equals the number of SAEVs required. In the reference scenario, the maximum number of vehicles on the road was 500.000. This increases to 800.000 in the SAEV low scenario and 1.400.000 in the SAEV high scenario.
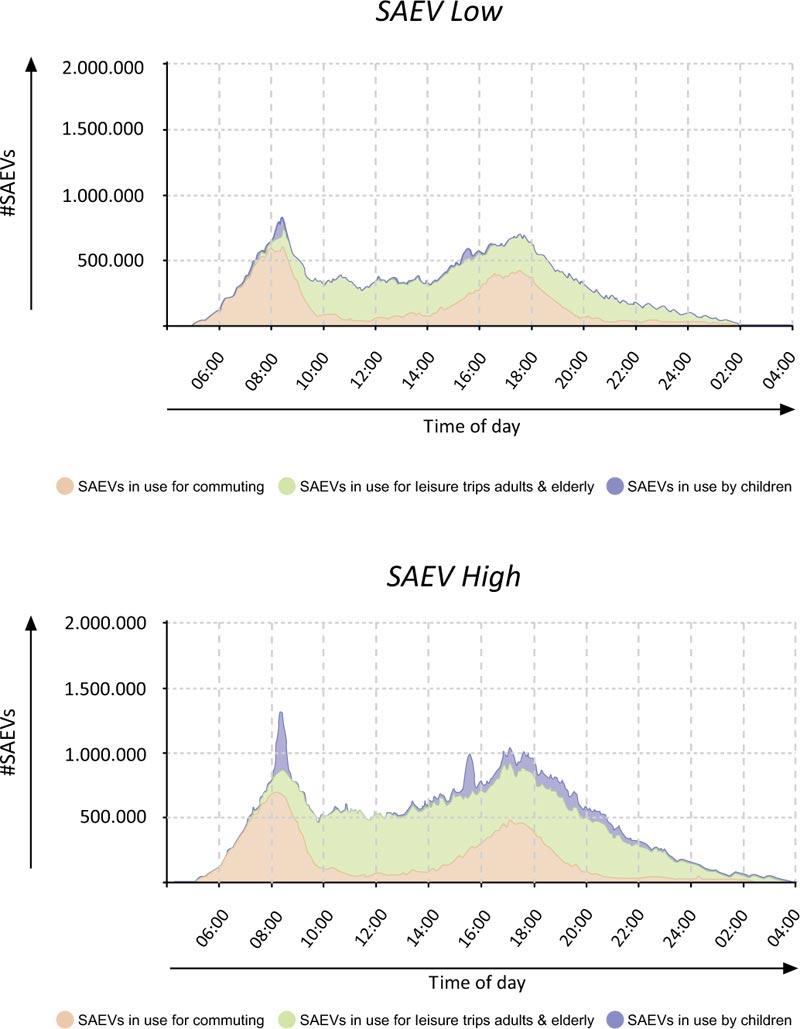
Section 4.1 shows the daily mileage more than doubles in the SAEV high scenario. Fig. (9) shows that even with such extreme increased mobility demand, one SAEV can still replace about 6 privately owned vehicles since there are about currently about 8.5 million privately owned vehicles. A significant contribution to the peak demand (about 40%) in this scenario comes from children going to school. Most of the induced demand is spread out over the day; and does not contribute to the peak demand or the number of vehicles required. In the SAEV low scenario, one SAEV can replace about 10 privately owned vehicles.
The mobility demand simulated in the above scenarios is based on the average mobility demand of the Netherlands during weekdays. A larger vehicle fleet will be required at monthly or yearly highs. Such variations in demand can be caused by, for example, weather conditions or national festivities. Future fleet operators might counter high fluctuations in demand by varying trip prices based on the demand. Such methods could be applied to optimize the vehicle fleet and reduce the total fleet size. Additionally, with regards to the recent covid-19 developments, the number of vehicles required during rush hours could also reduce due to increased working-from-home and societal acceptance of it.
4.3. SAEV Fleet Composition
Each simulated trip with SAEVs is linked (via the choice model of Table 3) to one of the three SEAV types defined in Section 3.2. Plotting the daily demand profiles for each type of SAEV provides a first impression of the fleet composition in a mobility system with full adoption of SAEVs. Fig. (10) shows an example day of these figures. The resulting fleet compositions, which are the peaks of the graphs, are summarized in Table 4. From Fig. (10) and Table 4 can be deduced that the potential of SAEVs to reduce the resource intensity of passenger transport is enormous since about 80% of the required vehicles are one-person vehicles in both scenarios.
4.4. Model Limitations
The results presented in the previous sections provide a first impression of the required vehicle fleet in a mobility system with full adoption of SAEVs. However, as with any modelling exercise, the real-world applicability is limited by assumptions and model simplifications. The parametrization of the induced demand, as shown in Table 2, is an example of this. How SAEVs will exactly induce demand is unknown. It is possible that SAEV demand from children remains very limited, while increased demand from elderly triples. Although the scenarios have been constructed to encompass the high and the low end of the spectrum, many different sub-states are possible that lead to different mobility demands. Also, modal shifts from walking and biking trips were not implemented in the SAEV scenarios of this research.
| - | Reference Scenario | SAEV Low | SAEV High |
|---|---|---|---|
| Privately owned vehicles | 3.250.000 | 0 | 0 |
| Basic SAEVs | 0 | 200.000 | 600.000 |
| Standard SAEVs | 0 | 400.000 | 520.000 |
| Multi-person SAEVs | 0 | 200.000 | 240.000 |
In this research, full adoption of sharing is assumed. However, even if autonomous and electric vehicle technologies reach full adoption, vehicle sharing might not. In such scenarios, the results of this research can be scaled with the share of the population that does adopt sharing. Several other factors regarding the applicability of the results to real situations have already been discussed throughout this paper, these are:
- The usage of Dutch mobility behaviour (other case studies have other driving patterns),
- Traffic congestion and driving speeds with SAEVs,
- Optimisation effects of fleet management, and
- Seasonal or yearly peak demands.
4.5. Open Source Model to Study SAEV Fleet Compositions
The model developed in this study is an open-source model. A fixed version of it with only the user interface can be run from the Anylogic cloud1, which is a cloud service from The Anylogic Company, the company that develops Anylogic [37]. Anylogic is the java-based modelling software used in this research. The source code of the model can also be downloaded from the Anylogic cloud.

The model is intended to be used for other scenario and case studies. Input values and distributions can be changed to define other SAEV scenarios and case studies. The model is also adaptable with extendable decision trees that dictate, for example, the choice model for SAEV categories. Adding new dynamics requires relatively little modelling effort. Examples for this are time-dependent re-allocation times, parallel sharing of the SAEVs and congestion dynamics for SAEV fleets. Working with the model in Anylogic requires some basic Anylogic knowledge.
Several steps are required to use the open-source model for exploring new SAEV case studies: 1) condense the mobility patterns of the case study into distributions, 2) construct a representative population of people-agents, 3) define and parametrize the induced demand scenarios, 4) design a choice model for the fit-for-demand vehicles, and 5) run the simulations. These steps are shown in Fig. (11).
Recommendations for improving the model are adding multi-destination and multi-model trips, although the complexity of both the model and data synchronisation increases rapidly with such functionalities. The approach in this research was to simplify this by treating multi-destination trips as a single destination trip with the trip distance equal to the total of the multi-destination trip. Also, modal shifts from bicycles and walking trips can be implemented. In the Netherlands, it is not uncommon for people to make several bicycle trips per day. On rainy days a modal shift from bicycles to SAEVs could substantially increase the SAEV demand. However, like with monthly peak demand, this could partly be managed by fleet operators’ optimisation strategies. Besides, in many countries, biking trips play a smaller role than in the Netherlands.
CONCLUSION
Shared Autonomous Electric Vehicles (SAEVs) have the potential to completely transform passenger transport as we know it. Cheaper, safer, and more accessible mobility will increase mobility demand. Sharing of autonomous vehicles could lead to a fleet of fit-for-demand vehicles with mainly one-person vehicles. This could have massive implications for both the environment and the societal aspects of the transport sector.
Several modelling studies explored how many conventional vehicles could be replaced per SAEV. But fit-for-demand vehicles and new SAEV induced mobility demand go mostly unmentioned. Specifically, the more transformative aspects, like fit-for-demand vehicles and children as new user groups of passenger vehicles, are often ignored in those quantification studies. Due to the societal relevance and the impact of mobility on our climate, it is important to gain some first insights into the number and types of vehicles required in full SAEV adoption scenarios. This study closes that research gap by developing an agent-based model to explore such scenarios.
The developed model is open source and can be applied to any case study or SAEV scenario. In this research, mobility dynamics of the Netherlands were applied and a high and a low scenario for induced mobility demand were defined. To explore future fleet compositions, three SAEV categories were defined; small one-person SAEVs for short trips, more potent one-person SAEVs for longer trips, and multi-person/luxury SAEVs for other mobility demand such as business meetings or family holidays. The model simulates individual trips of a large population. If the transport mode of a trip is a SAEV then the trip's characteristics determine probabilistically which category of SAEV is used.
The simulation results indicate that at full adoption of SAEVs the Netherlands would require 0.8 million to 1.4 million vehicles. Compared to the 8.5 million passenger vehicles at the time of writing, each SAEV would replace 6 to 10 privately owned vehicles. On top of this, 75% to 80% of the trips can be provided by one-person SAEVs. The reductions in vehicle ownership are despite increases in a vehicle-miles-travelled per resident of 35% in the SAEV low scenario and 145% in the SAEV high scenario.
Summarizing these results several major advantages of SAEV adoption can be identified. First of all, significantly reduced resource intensity of passenger mobility because of a six- to tenfold reduction in the required number of vehicles and because the majority of these required vehicles would be one-person vehicles. Secondly, it significantly reduced energy demand related to the production of vehicles. Thirdly, significantly reduced energy consumption from road transport due to electrification and fit-for-demand vehicles. And finally, other societal benefits related to SAEV adoption such as less road accidents, safer and greener cites, and increased utility of travel time.
The results of this research provide a first perspective on how full adoption of fit-for-demand SAEVs could transform a vehicle fleet for passenger transport. Mobility behaviour with SAEVs and consumer acceptance of sharing can go in many directions and thus pose some limitations on the applicability of the results. Nevertheless, this exploration provides a very promising perspective that is worthy of future research. Some suggestions are to focus on the quantification of emissions or energy consumption, improving on the open source model by addressing one of the limitations, or applying our approach to other case studies.
NOTES
CONSENT FOR PUBLICTION
Not applicable.
AVAILABILITY OF DATA AND MATERIALS
The authors confirm that the data supporting the findings of this study are available within the article.
FUNDING
This research is supported by the Dutch Technology Foundation STW under grant no. 811171, which is part of the Netherlands Organization for Scientific Research (NWO), and which is partly funded by the Ministry of Economic affairs.
CONFLICT OF INTEREST
The authors declare no conflict of interest, financial or otherwise.
ACKNOWLEDGEMENTS
The authors would like to thank the reviewers for their efforts to improve this article.
APPENDIX
| Authors | Scope | Fit-for-demand Vehicles? | Induced Demand? |
|---|---|---|---|
| Martinez & Viegas [25] | Modelled ride-sharing services in the city of Lisbon with current-day mobility patterns. Full replacement of private vehicles was considered in two ride-sharing scenarios. Modal choice, which also included metro, rails and walking, was based on a decision tree. | Partly, demand was fitted to vehicles (4p sedans + minivans) trough ride-sharing | No |
| Fagnant and Kockelman [22] | Explored service level and vehicle miles travelled of different relocation strategies with mid-sized SAVs. The model involved random trip generation on a synthetic grid. SAV service was limited to a 15 mile distance. Lack of realistic narrative. | No | Only relocation of the vehicles |
| Zhang et al. [28] | Studied the parking space that could be saved in a SAV system. Used hypothetical gridded city where 2% of people use SAVs instead of private vehicles. | No | No |
| Kamel et al. [20] | Developed an ABM methodology to analyze modal choices when SAVs become an additional option. The method requires input about user preferences of modal choices. Cost and travel time are the main components determining heterogeneous decisions. Mobility behaviour of Paris was implemented. | No | No |
| Scheltes et al. (Scheltes et al. 2017) | Looked at the SAEV feasibility as an alternative last mile solution for a 1.8 km corridor from a train station to university. | Partly, vehicle fit for trip type. However, just one trip type was modelled | No |
| Milliard-Ball [29] | Studied how private AVs can impact congestion and parking dynamics with three strategies to avoid parking costs. It was found that there is incentive for AVs to induce congestion if private AVs intent to avoid parking costs by free-floating. | No | Partly, additional parking mileage |
| Shen et al. [31] | Examined how SAVs can replace scheduled-fixed route buses as a last-mile solution from metro stations in the city of Singapore. | No | No |
| Iacobucci et al. [23] | Studied fleet size and charging dynamics of an SAEV fleet in order to assess power grid integration. Car and taxi trip dynamics of Tokyo were implemented. | No | No |
| Heillig et al. [24] | Modelled a future scenario with 100% AVs and without private cars to determine the number of AVs required to cover the mobility needs of the city of Stuttgart. | No, four person ridesharing SAEVs | Partly, longer trips |

