All published articles of this journal are available on ScienceDirect.

Impact of Experience and Training on Traffic Knowledge of Young Drivers
Abstract
Background:
An acceptable level of knowledge of traffic rules is needed for any driver to drive on public roads. This knowledge is typically acquired at a younger age during the process of attaining a driver's license.
Aim:
The purpose of this study is to investigate the level of knowledge among young drivers and how it could be improved. The study also explores the relationships between driving experience and knowledge scores as well as between driving training and knowledge scores for young drivers.
Methods:
A questionnaire survey that covered questions related to traffic law, fines, demerit points, traffic signs, and different driving situations was conducted among young drivers to assess their knowledge level. In addition to the different demographic questions, the survey included questions related to their licensing-related training and driving experience.
Results:
The participants revealed an acceptable level of knowledge in general, measured in terms of the percentage of correct responses. The participants showed an above-average level of knowledge of traffic signs, an acceptable level of knowledge in questions related to handling different driving situations, but they lacked knowledge of questions related to fines and demerit points. Drivers who attended a driving course before obtaining their driver's license performed better than drivers who did not. Similarly, drivers with more driving experience performed better than drivers with less experience.
Conclusion:
In summary, the results suggest that providing driving courses and acquiring driving experience are relevant to the acquisition of driving knowledge for young drivers.
1. INTRODUCTION
Identifying the factors that affect drivers’ behavior is an essential step in raising road safety standards [1]. New drivers must gain an acceptable level of knowledge of the traffic rules to drive a vehicle on public roads [2-4]. This type of knowledge is usually accumulated at a young age as part of the process of acquiring a driver's license. Young drivers are at a higher risk of being involved in a crash compared to older and more experienced drivers [5]. There is a general public perception that young drivers do not accumulate an acceptable level of knowledge. Although there is no demonstrable link between a lack of knowledge and increased crash risk [6-8], there is a high number of fatalities and injuries among young drivers compared to other age groups in many countries [9-11]. Therefore, it is essential for young drivers to have an acceptable level of knowledge.
Trying to understand the level of knowledge acquired by young drivers in Qatar, the purpose of this study is to assess their awareness of traffic rules and to investigate whether their knowledge is correlated with their driving experience and driving training. Qatar is located in the Arabian Gulf region. To drive in Qatar, drivers must be at least 18 years old. Traffic laws in Qatar are extremely similar to those in Western countries [12], and aggressive driving is common among drivers [13, 14]. Young drivers are involved in more traffic crashes and violations than any other age group [15, 16], and distractions among young drivers are of particular concern in the country [17-20].
Several researchers have studied different areas of drivers’ knowledge of traffic rules. In Saudi Arabia, a study used a driver survey to assess drivers’ knowledge of different types of traffic signs and pavement markings. The study showed that the drivers had a low level of comprehension of the different traffic control devices. The overall correct responses were approximately 63.3%. The percentages of drivers who properly identified the regulatory signs, warning signs, and pavement markings were 69.7%, 61.3%, and 52.5%, respectively [21].
In Canada, another study was conducted to evaluate drivers’ knowledge of traffic law. A practice test was conducted ina large sample of drivers. Only 11.4% of the drivers scored a passing mark. The passing rates increased to 38.6% after excluding the questions related to drivers’ licensing, demerit points, and parking. Those passing rates showed that the drivers’ knowledge of the traffic law was low. The results for the male drivers were better than those of the female drivers, and the results for the younger drivers were better than the older drivers [22].
A study in Delhi, India, was conducted on a sample of drivers to ascertain their knowledge of traffic rules and road signs. The analysis of the data highlighted the maximum level of awareness about road signs regarding driving on hilly roads (89.0%), seatbelt usage while driving (89.0%), the safe way of stopping during an emergency (40%), safe places to park the vehicle (39.0%), and road markings (27.0%). Overall, drivers showed an average to an above-average level of awareness: 52.0% to 77.0% [23].
Several studies have focused on young drivers’ knowledge in different areas of traffic rules. In Kuwait, a survey was conducted among university students. The results revealed that 85% of the students properly identified the traffic signs and traffic rules [24]. In India, another study aimed to investigate the knowledge of traffic rules among university students indicated that the participants had significantly low knowledge about some of the rules, including alcohol (4.2%), wearing seatbelts (20.0%), and the use of mobile phones while driving (61%). The students showed better awareness of the traffic signs. More than half of the participants recognized all the signs accurately. The results showed slightly better results for females (20.6%) than males (19.9%) [25].
A similar study was conducted on 260 medical students in India. The study measured the students’ knowledge of traffic rules. The knowledge of female participants (20.6%) was slightly higher than male participants (19.9%). The participants had low knowledge of the rules related to alcohol and driving (4.2%), the use of seatbelts (20.0%), and the use of mobile phones without hands-free devices (6.1%). Higher knowledge of traffic signs was identified. More than half recognized all the signs correctly [26]. Another study was carried out in Saudi Arabia among students from high schools and universities. As part of the study, the participants’ knowledge of traffic signs was tested. The study showed that a relatively high number of participants lacked the knowledge of many important traffic signs, especially signs designated for yielding to traffic and pedestrians. For example, 46.0% of the participants did not know the purpose of a yield sign [27].
This study contributes to the existing literature in several ways. The study assesses the knowledge of drivers in a wide variety of areas (i.e., traffic law, fines, demerit points, traffic signs, and different driving situations). Moreover, the study analyzes several variables that were not explored in previous research, such as licensing-related training and driving experience. Furthermore, this is one of the first efforts to investigate these factors in Qatar and the Arab Gulf country. This region has different characteristics, cultures, and languages. The results of this study can help policymakers in the region to allocate the proper resources needed for traffic education.
2. MATERIALS AND METHODS
2.1. Survey Design
A questionnaire was designed to investigate the drivers’ knowledge of different traffic laws and rules. As shown in Fig. (1), the questionnaire had four parts. The first set of questions required the respondent to identify the purpose of 14 widely used traffic signs on the roads in Qatar. The signs included seven regulatory signs and seven warning signs. The warning signs included Signal Ahead, Roundabout Ahead, Pedestrian Ahead, Road Works Ahead, Dead End, Intersection Ahead, and Side Road signs. The regulatory signs included Stop, Wrong Entry, No Parking, No Left Turn, No U-Turn, Speed Limit, and No Overtaking signs. The second set comprised 21 questions related to handling different driving situations. The situations included overtaking based on different pavement markings, going through roundabouts, going through signalized and unsignalized intersections, and handling different types of pedestrian crossings.
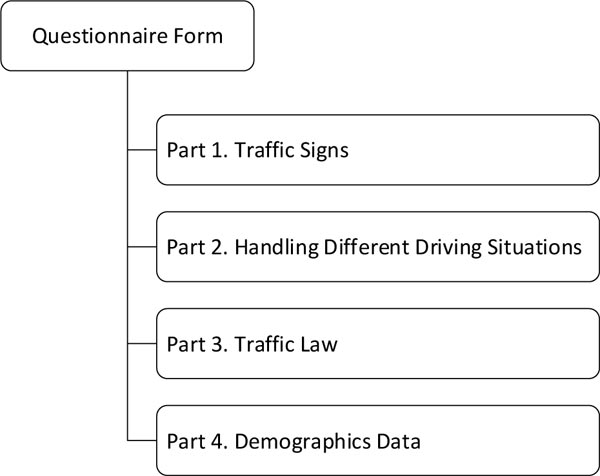
The third set of questions was added to the questionnaire after receiving feedback and suggestions from key public agencies and decision-makers, including the Traffic Department at the Ministry of Interior Affairs, Ministry of Municipality and Urban Planning, Hamad General Hospital, General Secretariat for Development Planning, Qatar University, Ashgal, and Office of the Minister of Interior Affairs. This section is related to the fines and demerit points associated with the different types of violations and is based on the actual licensing test. The additional section may seem to be of less importance than being able to recognize common traffic signs and handling various driving scenarios; however, knowing this information is important in motivating drivers not to intentionally break the traffic laws. The third set comprised 15 questions similar to those on the actual driver’s licensing theory test in Qatar. The licensing theory test is mandatory, and all drivers must pass it before taking the practical test. This set of questions required the respondents to identify the fines and demerit points for some violations, such as not using a seatbelt, running a red light, exceeding the speed limit, wrong-way driving, and using handheld mobile phones while driving.
In addition to the 50 questions in the first three parts, the participants were asked to provide information regarding their age, gender, nationality, driving experience, and type of driving course attended before obtaining their driver’s license, if any. Qatar has a unique composition of the population. The Qatari nationals (14.3%) form a minority in the country [14]. Many drivers come from various backgrounds, some from developed countries, where similar traffic rules exist, and many from developing countries where different traffic rules exist. Therefore, it was necessary to include this variable in the study.
It should be noted that there were many types of driving courses offered in Qatar at the time this study was conducted. These courses were offered by certified driving schools and were recommended for new learners to prepare them for the theoretical and practical tests. All courses included six hours of theoretical lectures and varied hours of practical driving. For new drivers, two types of practical driving courses were available: a partial driving course (12 to 25 hours) and a full driving course (40 hours). Other types of courses were available for drivers with previous driving experience, drivers holding a driver's license from another country, and drivers who just need a driving refreshment course.
2.2. Data Collection
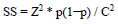
Three interviewers were trained on how to conduct the interviews. A pilot study was completed on a sample of 50 young drivers. The purpose of the questionnaire was to verify if the form was simple to understand and could be completed in an acceptable time frame. The minimum sample size was estimated as follows:
 |
(1) |
Where, SS = Sample size, Z = Z-value, p = Percentage of population, C = Confidence interval.
Assuming a 95% confidence level (Z=1.96) and a 5% confidence interval (C=0.05), the minimum sample size was 385. Five hundred forms were printed to share with young drivers. Convenience sampling was used for administering the survey instead of random sampling due to the limited budget. Young drivers were approached and interviewed in common places such as libraries, cafeterias, student centers, activity buildings, and college buildings. The questionnaire was presented as an opportunity to make a difference in improving young driver's knowledge of traffic rules in Qatar. The participants did not receive any compensation for their participation.
Over 1,400 participants were approached to complete the 500 forms with an approximate response rate of 35%. All participants were above 18 years old, less than or equal to 25 years old, and had a valid driver’s license from Qatar. The demographics of the participants, such as nationality and gender, were regularly checked to ensure that the sample was truly representative of the population. The participants completed the survey themselves in the presence of the trained interviewers. They were encouraged to approach the interviewers to answer any questions or concerns. Out of the 500 forms, 440 surveys were fully completed and were considered in the analysis. Each interviewer was responsible for converting his survey forms from paper forms to electronic sheets to process them further. The survey papers and data entered were checked by other team members who were not involved in the data-entry process to ensure quality. Any mistakes identified in the data entry were corrected.
3. RESULTS AND DISCUSSION
3.1. Demographic Characteristics of the Participants
The percentage of male participants (79.8%) was higher than female participants (20.2%). This difference is consistent with the unbalanced population in Qatar (76.7% males). The Qatari drivers in this study formed 28.4% of the sample, compared to 14.3% of the population. The oversampling of the Qatari drivers was needed to ensure enough members from this group within the population for the results to present both the non-Qatari population and the minority Qatari subgroup. As shown in Table 1, 59.8% of the participants were in the age group of 20 years or less. Most of the respondents (78.7%) completed a type of driving course (partial or a full driving course). A partial driving course is defined throughout this study as any driving course that is less than the full course of 40 hours. Furthermore, 39.5% of the participants had more than two years of driving experience.
3.2. Scores for Different Types of Questions
Descriptive statistics (i.e., mean, frequency, percentage, and standard deviation) were calculated and are shown in Table 2. The mean score for the participants was 58.0%±13.0%. The mean scores for male drivers, drivers aged 20 years or less, Arab non-Qatari drivers, drivers with a full driving course, and drivers with more than two years of driving experience were slightly higher than the other groups.
As shown in Table 2, the lowest overall score was for questions related to the traffic law (38.8%±16.1%). The overall score for handling different driving situations was acceptable (57.0%±18.1%) but slightly lower than the overall mean score (58.0%±13.0%). The best overall score was for questions related to traffic signs (83.1%±15.4%). The correlation between the three categories was calculated, as shown in Table 3. According to the Pearson correlation, significant positive correlations were found between the knowledge of the three areas.
| Variables | - | Frequency | Percent |
|---|---|---|---|
| Gender | Male | 351 | 79.8% |
| Female | 89 | 20.2% | |
| Age | 20 or less | 263 | 59.8% |
| More than 20 | 177 | 40.2% | |
| Nationality | Qatari | 125 | 28.4% |
| Non-Qatari Arab | 184 | 41.8% | |
| Others | 131 | 29.8% | |
| Driving Course | No driving course | 94 | 21.4% |
| Partial driving course | 233 | 53.0% | |
| Full driving course | 113 | 25.7% | |
| Driving Experience | One year or less | 147 | 33.4% |
| One to two years | 119 | 27.0% | |
| More than two years | 174 | 39.5% |
| Driver Characteristics | Traffic Law | Traffic Signs | Driving Situations | Overall | ||
| Gender | Male | Maximum | 87.0% | 100.0% | 90.0% | 84.0% |
| Minimum | 7.0% | 7.0% | 10.0% | 14.0% | ||
| Mean | 39.9% | 83.0% | 57.1% | 59.2% | ||
| Std. Deviation | 16.2% | 15.1% | 18.3% | 13.1% | ||
| Female | Maximum | 73.0% | 100.0% | 86.0% | 78.0% | |
| Minimum | 7.0% | 14.0% | 19.0% | 18.0% | ||
| Mean | 34.6% | 83.1% | 56.6% | 57.4% | ||
| Std. Deviation | 14.9% | 16.5% | 17.2% | 11.6% | ||
| Age | 20 or Less | Maximum | 87.0% | 100.0% | 90.0% | 84.0% |
| Minimum | 7.0% | 7.0% | 10.0% | 18.0% | ||
| Mean | 39.7% | 83.0% | 58.4% | 59.6% | ||
| Std. Deviation | 16.0% | 15.9% | 17.9% | 12.8% | ||
| More Than 20 | Maximum | 73.0% | 100.0% | 90.0% | 80.0% | |
| Minimum | 7.0% | 14.0% | 0.0% | 14.0% | ||
| Mean | 37.5% | 83.2% | 54.8% | 57.6% | ||
| Std. Deviation | 16.2% | 14.7% | 18.3% | 12.8% | ||
| Nationality | Qatari | Maximum | 87.0% | 100.0% | 90.0% | 80.0% |
| Minimum | 7.0% | 21.0% | 5.0% | 16.0% | ||
| Mean | 40.3% | 82.0% | 52.9% | 57.2% | ||
| Std. Deviation | 17.7% | 15.7% | 19.3% | 14.4% | ||
| Non-Qatari Arab | Maximum | 87.0% | 100.0% | 90.0% | 84.0% | |
| Minimum | 7.0% | 7.0% | 10.0% | 20.0% | ||
| Mean | 38.0% | 83.5% | 59.5% | 59.7% | ||
| Std. Deviation | 16.2% | 14.9% | 16.6% | 12.0% | ||
| Others | Maximum | 67.0% | 100.0% | 90.0% | 80.0% | |
| Minimum | 7.0% | 21.0% | 0.0% | 14.0% | ||
| Mean | 38.6% | 83.5% | 57.3% | 59.0% | ||
| Std. Deviation | 14.2% | 15.8% | 18.3% | 12.1% | ||
| Driving Course | No Driving Course | Maximum | 73.0% | 100.0% | 90.0% | 80.0% |
| Minimum | 7.0% | 21.0% | 5.0% | 18.0% | ||
| Mean | 39.0% | 81.3% | 53.7% | 57.0% | ||
| Std. Deviation | 16.6% | 16.6% | 19.9% | 14.4% | ||
| Partial Driving Course | Maximum | 87.0% | 100.0% | 90.0% | 84.0% | |
| Minimum | 7.0% | 7.0% | 0.0% | 14.0% | ||
| Mean | 38.3% | 82.2% | 57.5% | 58.6% | ||
| Std. Deviation | 16.0% | 15.4% | 17.7% | 12.4% | ||
| Full Driving Course | Maximum | 73.0% | 100.0% | 90.0% | 82.0% | |
| Minimum | 7.0% | 7.0% | 10.0% | 16.0% | ||
| Mean | 39.8% | 86.4% | 58.6% | 60.7% | ||
| Std. Deviation | 15.9% | 13.9% | 17.0% | 12.0% | ||
| Driving Experience | One Year or Less | Maximum | 87.0% | 100.0% | 90.0% | 84.0% |
| Minimum | 7.0% | 7.0% | 0.0% | 20.0% | ||
| Mean | 39.3% | 84.5% | 56.2% | 59.0% | ||
| Std. Deviation | 16.8% | 14.9% | 19.6% | 13.6% | ||
| One to Two Years | Maximum | 67.0% | 100.0% | 86.0% | 80.0% | |
| Minimum | 7.0% | 7.0% | 10.0% | 16.0% | ||
| Mean | 36.6% | 80.2% | 57.1% | 57.4% | ||
| Std. Deviation | 14.8% | 17.9% | 17.6% | 13.2% | ||
| More Than Two Years | Maximum | 87.0% | 100.0% | 90.0% | 84.0% | |
| Minimum | 7.0% | 21.0% | 5.0% | 14.0% | ||
| Mean | 40.0% | 83.8% | 57.5% | 59.6% | ||
| Std. Deviation | 16.3% | 13.6% | 17.1% | 11.8% | ||
| Total | Maximum | 87.0% | 100.0% | 90.0% | 84.0% | |
| Minimum | 7.0% | 7.0% | 0.0% | 10.0% | ||
| Mean | 38.8% | 83.1% | 57.0% | 58.0% | ||
| Std. Deviation | 16.1% | 15.4% | 18.1% | 13.0% | ||
| - | Traffic Law | Traffic Signs | Driving Situations | |
|---|---|---|---|---|
| Traffic Law | Pearson Correlation | 1 | - | - |
| Sig. (2-tailed) | - | - | - | |
| Traffic Signs | Pearson Correlation | 0.249 | 1 | - |
| Sig. (2-tailed) | <0.001 | - | - | |
| Driving Situations | Pearson Correlation | 0.328 | 0.463 | 1 |
| Sig. (2-tailed) | <0.001 | <0.001 | - | |
3.3. Logistic Regression
Logistic regression analysis was used to explore the relationship between the dependent variable (driver knowledge) and independent variables. This type of analysis is suitable to identify the factors affecting the response of the drivers, given that it intrinsically adjusts each factor considered for the presence of the other factors. Binary logistic regression is suitable in the case of a binary independent variable. To use this method for analysis, an assumption was made that a participant should answer 50 percent or more of the questions to have a fair knowledge of the traffic rules. The maximum likelihood is the procedure used to estimate the coefficients. The target is to obtain the best linear combination of independent variables.
The response variable (passing) was assumed to be a binary (dichotomous) with two levels: 0 for answering less than 50 percent of the questions correctly and 1 for answering 50 percent or more of the questions correctly. Regarding the independent variables, five categorical variables were used in the analysis, including the driving course (1=no driving course, 2=partial driving course, and 3=full driving course), driving experience (1=one year or less, 2=one to two years, 3=more than two years), gender (1=male and 2=female), nationality (1=Qatari, 2=non-Qatari Arab, 3=other), and age (1=20 or less and 2=more than 20). The analysis identifies the coefficient that makes the observed outcome—namely, passing—in the model most likely using the maximum-likelihood method. The odds ratios (OR), a measure of the association, were obtained for the different models as shown in Table 4.
| Passing the Test | Total | Gender | Age | Nationality | Driving Course | Driving Experience | ||||||||
| - | Male | Female | 20 or Less | More Than 20 | Qatari | Non-Qatari Arab | Others | No Driving Course | Partial Driving Course | Full Driving Course | One Year or Less | One to Two Years | More Than Two Years | |
| Not Passing | 83 | 59 | 15 | 45 | 29 | 26 | 26 | 22 | 24 | 37 | 13 | 30 | 23 | 21 |
| Passing | 357 | 292 | 74 | 218 | 148 | 99 | 158 | 109 | 70 | 196 | 100 | 117 | 96 | 153 |
| % of Success | 81.1% | 83.2% | 83.1% | 82.9% | 83.6% | 79.2% | 85.9% | 83.2% | 74.5% | 84.1% | 88.5% | 79.6% | 80.7% | 87.9% |
| B | S.E. | Wald | df | Sig. | Odds Ratio Exp(B) |
95% C.I. for EXP(B) |
||||||||
| Lower | Upper | |||||||||||||
| Gender [Female] vs [Male] | -0.073 | 0.346 | 0.044 | 1 | 0.834 | 0.930 | 0.472 | 1.834 | ||||||
| Age [20 or less] vs [More than 20] | 0.558 | 0.332 | 2.831 | 1 | 0.092 | 1.747 | 0.912 | 3.345 | ||||||
| Nationality [Non-Qatari Arab] vs [Qatari] | 0.336 | 0.325 | 1.066 | 1 | 0.302 | 1.399 | 0.740 | 2.646 | ||||||
| Nationality [Others] vs [Qatari] | 0.214 | 0.335 | 0.407 | 1 | 0.524 | 1.238 | 0.642 | 2.387 | ||||||
| Driving Experience [One to Two years] vs [One Year or Less] | 0.278 | 0.331 | 0.703 | 1 | 0.402 | 1.320 | 0.690 | 2.525 | ||||||
| Driving Experience [Two or More Years] vs [One Year or Less]* | 1.211 | 0.401 | 9.147 | 1 | 0.002 | 3.359 | 1.532 | 7.364 | ||||||
| Driving Course [Partial Driving course] vs [No Driving Course]* | 0.732 | 0.331 | 4.883 | 1 | 0.027 | 2.078 | 1.086 | 3.977 | ||||||
| Driving Course [Full Driving Course] vs [No Driving Course]* | 1.190 | 0.410 | 8.420 | 1 | 0.004 | 3.287 | 1.471 | 7.344 | ||||||
| Constant | -0.069 | 0.483 | 0.020 | 1 | 0.887 | 0.934 | - | - | ||||||
| * Refers to significance at 5 percent level | ||||||||||||||
Most of the drivers (81.1%) answered 50 percent or more of the questions. Drivers who attended a full driving course and drivers with more experience were more successful in passing the test than others. The binary logistic regression model identified significant factors directly associated with passing. Table 4 lists the model estimation and the odds ratio for the independent variables. The model showed that the odds of drivers with two or more years of experience were 3.3 times higher than the odds of drivers with one year or less of experience in passing the test.
In addition, the odds of drivers who received a full driving course were 3.3 times higher than the odds of drivers with one or less years of experience in passing the test. The odds of drivers who receive a partial driving course were 2.1 times higher than the odds of a driver with one or less years of experience in passing the test. In summary, the analysis indicated that drivers with more years of driving experience and drivers who attended a full driving course have higher odds of passing the test. The results did not indicate any significant differences in drivers’ knowledge for the different age, gender, and nationality groups.
CONCLUSION
Young drivers, newly licensed in particular, have exceptionally high crash rates [28]. The purpose of this research was to investigate young drivers’ awareness of traffic rules and to study whether their knowledge is correlated with their driving experience and driving training. The overall knowledge level, measured in terms of the percentage of correct responses, was 58.0%. The mean scores for male drivers, drivers aged 20 years or less, Arab non-Qatari drivers, drivers who completed a full driving course, and drivers with more than two years of driving experience were slightly higher than the other groups.
A detailed analysis of the different types of questions showed that the participants performed worse on the questions related to traffic law (38.8%±16.1%). These results may suggest that either the drivers are not interested in learning this information or the information is too detailed to commit to memory. The knowledge of such information can help save lives and prevent future crashes. Furthermore, respondents showed acceptable knowledge scores for handling different driving situations (57.0%±18.1%). The participants received the highest mean score in the questions related to the traffic signs (83.1%±15.4%). The results indicate that more resources should be allocated to improve the young drivers’ knowledge of the two lowest score categories.
The logistic regression model indicated that the odds of young drivers with two or more years of driving experience were 3.3 times higher than the odds of young drivers with one year or less of experience in passing the test. The results may imply that driving experience could help improve young drivers' knowledge. No evidence from the literature documents the relationship between experience and knowledge. However, previous research had shown that the risk of a crash during the first month of licensure was substantially higher than during any of the next 11 months. In addition, the likelihood of a first citation during the first month of licensure was also higher than during any of the subsequent 11 months [29].
The model also revealed that the odds of drivers that received more education in the form of a full driving course and a partial driving course were 3.3 times and 2 times higher than the odds of drivers with one year or less of experience in passing the test. There was no literature to support these results. However, in a study that assessed the impact of an education program on knowledge of sleepiness and driver behavior in young adult drivers, the results indicated that the education program had improved driver knowledge about sleep and safety [3]. It should be noted that previous studies failed to show that formally trained young drivers had a lower frequency of crashes [28, 30] or lower violations [31].
RECOMMENDATIONS
There are different possible approaches to improve the knowledge of traffic rules among young drivers in Qatar. First, combining all the information related to the three areas investigated in one attractive guidebook can help drivers to find all the information in one reliable source. The guidebook can also be used to study for the driving test. Second, improving the driver training programs by including new attractive methods in addition to the traditional training methods such as driving simulators or simple games. Providing information through a simple game may attract the attention of young drivers. Previous research suggests that these methods can be effective in engaging and educating young drivers [32, 33]. Third, initiating different public education programs using different easy-to-read materials such as flyers, fact sheets, brochures, posters, and stickers in addition to public campaigns through public figures, radio shows, TV programs, websites, and social media can be successful in educating drivers. These types of campaigns were found to be successful in reducing risk behavior among drivers [34, 35]. Finally, it is important to understand how young drivers might acquire and understand information, which can be important in developing new driver technologies such as advanced driver assistance systems and autonomous vehicles [36, 37].
LIMITATIONS AND FUTURE WORK
Several limitations with the current study should be noted. One of the limitations of this study had to do with the use of a convenience sample, which was necessary due to the relatively low cost of this technique compared to other techniques. In addition, it was necessary to set a limit to the number of questions included in the study to control the time to complete the survey form. However, all questions were carefully selected to cover the main topics. Lastly, the study was conducted in Qatar, a country in the Arabian Gulf region with unique characteristics. Therefore, some of the results may be locale-dependent. However, due to the similarity of culture, characteristics, traffic laws, and traffic enforcement strategies, the results can also be applicable to the other countries in the same region, including Kuwait, Bahrain, Oman, Saudi Arabia, and the United Arab Emirates [14].
Future research is needed to assess the change in the knowledge level after applying any interventions. Furthermore, drivers' awareness of traffic rules is important, but there is no clear link between knowledge and crashes or risky driving behavior [6-8]. Therefore, future research should consider examining the association between knowledge and driving performance, violations, and crashes. If a strong association exists between traffic knowledge and crashes or risky driving behavior, improving the knowledge and education of young drivers will be more critical and a needed priority to improve safety.
CONSENT FOR PUBLICATION
Not applicable.
AVAILABILITY OF DATA AND MATERIALS
The data sets used during the current study can be provided from the corresponding author [K.S], upon reasonable request.
FUNDING
None.
CONFLICT OF INTEREST
Dr. Khaled Shaaban is the Editorial Board Member of The Open Transportation Journal.
ACKNOWLEDGEMENTS
Declared none.

