All published articles of this journal are available on ScienceDirect.

Improving the Capacity and Level of Service at the Sixth Circle in Jordan by Using Traffic Signals and Roundabout Metering Approach
Abstract
Background and Objective:
This study aims to improve the capacity and level of service at the sixth circle in Jordan by using traffic signals and a roundabout metering approach.
Methods:
VISSIM software and C++ program were used to improve the capacity and level of service. The site area (Sixth circle) was located near Crown Plaza and the Jordan Gate Towers project, which causes congestion due to heavy traffic flow. Therefore, this paper assesses the traffic in the sixth circle and presents the possible solutions to reduce the daily traffic flow for the users of this circle.
Results:
Four signals were placed at the roundabout in the second scenario, which was connected to each other with different cycle lengths. 90-second cycle length gives D value of the level of service. The third scenario was placed adaptive signals on the roundabout, which connects traffic signals with ground detectors placed at a certain distance before the signal and based on the queue length of the flow cars that pass the detector.
Conclusion:
The adaptive signals worked on the opening and closing and were designed according to the language simulation and the adoption of the language C++. The first two signals were opened considering the Swefieh road with the reference of King Faisal for a period of 45 seconds. It was then closed for 45 seconds to open the signal from the next street from the fifth circle with Zahran street.
1. INTRODUCTION
Traffic conditions are considered a major indicator, which defines the advancement of the modern urban area [1]. Officials and professionals in major urban areas dedicate resources and efforts to improve traffic conditions as they are a vital issue for national prosperity [2–5]. It influences the competencies of human societies in all fields; including the economic, social, and tourism sectors. Globally, cities allocate a substantial portion of their budget to enhance and develop traffic conditions and infrastructure, where governments have worked harder to identify suitable solutions and developed plans for managing traffic within their premises [6–9] The case study used for this study was the sixth circle in Amman, the capital of Jordan. Amman is one of the biggest cities in the Middle East that has a well-developed roadway network. As in the case of most modern cities, high traffic congestion level prevails on the main arterial network.
In transportation system modelling, microsimulation is mainly used to test the performance of suggested alternatives before they can be implemented [10]. AIMSUN [11], VISSIM, and PARAMICS [12], CORSIM [13] are considered the most popular and implemented microsimulation software worldwide. In addition, there are some open-source microsimulation models such as SUMO and MITSIMLab [14]. VISSIM microsimulation package has the most required modelling features for acquiring reasonable surrogate measures [15].
The installation of traffic signals is one means to provide solutions to long queues and delays at one or more of the roundabout approaches, which result in high directional flows. Signal tactics have not been comprehensively used for traffic congestion control and management in Jordan. This study utilizes microsimulation modelling for enhancing capacity and smooth traffic flows at roundabouts with the exploration and identification of low-cost untraditional configurations. This approach can further be integrated by planners and engineers for evaluating and reducing confrontations on different intersections on urban arterials. Therefore, we used the VISSIM model to assess the roundabout metering and to improve the capacity and level of service for the case study roundabout.
2. PAST STUDIES AND CASE STUDY
In Australia, where there is most of the applications of roundabout metering in the world, Akcelik reported those applications extensively [16–19]. Akcelik stated that “roundabout metering signals help to create gaps in the circulating stream to solve the problem of excessive queuing and delays caused by unbalanced flow patterns and high demand flow levels” [19], where he used SIDRA software to determine signal timing and queue length [18, 19].
Victoria State Roads described that performance of roundabout is vulnerable to imbalanced traffic flow, where high traffic volume approach that entered the roundabout prevents adjacent approach from entering the roundabout. The imbalanced traffic flow can cause operational deficiency for the downstream traffic approach. It was suggested to provide metering signals to control the high traffic approach and provide a sufficient gap for downstream traffic approaches [20].
A comparison of the performance for metered roundabout was discussed in the NCHRP report, where metering signals were mentioned several times by providing a diagram and photo of existing examples in the USA and Australia [21]. The safety and operational benefits of replacing numerous intersections, in Florida, with a roundabout metering signal were discussed. One of the other advantages of metering signal is to help clearing the roundabout upon arrival of emergency vehicles by using different modes for triggering the metering signal, such as inductive loop and remote device controlled by traffic staff or police [10]. Hummer et al. [22] investigated how roundabouts can manage peak period demand in the USA by developing a microsimulation model based on Highway Capacity Manual. The study found that the delay declined comparing to roundabout without metering signals. Hong-bo Qian, Ke-ping Li and Jian Sun [23] studied the development and lifecycle of roundabouts from simple roundabouts to unconventional roundabouts. They provided a comparison of the different roundabout configurations by discussing the advantages and disadvantages of each alternative based on the case study they had in China. Their analysis showed that two-stops left turning roundabouts provided an improvement at all large conventional roundabouts suffering from high volumes of traffic. However, further analysis showed that modern roundabouts outperforms signalized roundabouts providing higher efficiency and requiring less acquisition of lands in case of low traffic volumes at interchanges.
Yuntao CHANG, Yu BAI and Jian SUN [24] built a delay-focused model that was used to analyse the metered roundabouts based on traffic movements, signal control and the theory of wave, taking into consideration the HCM2000 delay function. Their study utilized the traditional dual ring traffic signal control pattern used at four-legged intersections. They also developed a delay function based on MATLAB software which proved to provide good performance as compared to other known methods.
As the case in many modern urban areas, the city of Amman has witnessed high growth in its size and population, which resulted in adverse effects on the transportation system in the city. This study used the sixth circle in Amman as the case study as it is considered to be a major intersection linking four major commercial areas in the city. This study focused on the level of service, traffic volume, engineering design, signal design, and time delay of the vehicle at this intersection using the VISSIM program. This study also considered the future growth in traffic volumes at the selected site, which was identified to be 7% annually based on historical data at the site obtained from the Greater Amman Municipality (GAM).
On the contrary, due to the complexities experienced to measure microscopic parameters from the field, the calibration process is not that simple and easy [25–29]. Thereby, the majority of these calibration methods depend on field-measured macroscopic parameters rather than measuring microscopic parameters. Several optimization-based techniques are utilized for improving the calibration process, which includes gradient searches, genetic algorithms, and simplex-based tactics [30–33]. For instance, model validation can be utilized for testing the accuracy of the model by comparing the traffic flow data gathered from the field with that generated by the model [34, 35]. It is essential for identifying important issues on model validation such as collecting the essential data, quantifying uncertainties, predicting MOEs, and establishing the comprehensive meaning of model validation [36–38]. It is related to the model calibration process directly as adjustments in calibration are essential to boost the ability of the model for replicating the traffic dynamics observed from the field [39, 40]. It is essential in selecting and identifying critical calibration parameters and for determining acceptable variations for each of the calibration parameters throughout the microscopic simulation model [9]. There are a number of such parameters associated with a microscopic simulation model that might be calibrated for replicating realistic field situations [41, 42]. Some of these parameters encompass desired speed, clearance distance, acceleration, waiting time before diffusion, lane change distance, minimum headway, standstill distance, and emergency stopping distance [43]. The calibration is often needed for all default software parameters [44]. Factorial design, elementary effects methods, and sensitivity analysis have been recently implemented for identifying the critical parameters to be calibrated [45]. Sensitivity analysis is conducted for reducing the number of candidate calibration parameters and for keeping the parameters that substantially influence the simulation [46–49].
Therefore, the emphasis was to have the best solution to this sixth circle with the lowest cost and service for the maximum amount of time that can analyse all information and data collected in this study. In the first step, the location information and changes in the geometric state of the sixth circle were analysed. The time delay shows the service level in the current situation, which will follow the development of traffic for each approach and how this solution can reduce delay time to an acceptable level. The study area is characterized as a region of vital and commercial activities, which hosts a number of restaurants, cafes, and entertainment venues. Most importantly, it hosts company headquarters, banks and hotels, and insurance companies. In addition, it is classified as one of the luxury residential areas. This study aims to evaluate the sixth circle and to assess the current conditions aiming at improving its operating condition.
The study contributes to the field of transportation by evaluating the geometric, traffic, and signalized aspects for the sixth circle using VISSIM software. The study also optimizes the cycle length of sixth circle using VISSIM and calculation. The information for sixth circle was converted to traffic signals for reducing traffic jams on similar roads. The study has developed traffic circulation plan based on a clear concept that would reduce the delay and improve road performance conditions. The study also encourages investment in the city and in the whole country by enhancing the means of transportation. With the development of model, this study saves time and effort for citizens to drive on streets or any other transport facilities. The objective of this study was to calibrate VISSIM for reproducing realistic delay. In this regard, the study has collected video measurements at different signalized intersections in Jordan and extracted data on time to pass the intersection, arrival distributions, and data on headway. A VISSIM model was developed for each intersection and the data extracted were utilized for calibrating the models using the measurements. The correct calibration of the models was validated through the total delay.
3. MATERIALS AND METHODS
The methodology used in this study presents a detailed description of data collection procedures, either collected from the field or historical data from other sources. It is important for identifying Measures of Effectiveness (MOEs) [50] adequate for validation and calibration before the data collection. It is further important for identifying performance measures and determining both uncontrollable and controllable input parameters. For instance, a performance measure can be travel time between two data collection hubs in the network [51]. Controllable input parameters could be minimum headways, minimum and maximum look-ahead and look-back distances, waiting time before diffusion, lane changing distances, etc [52]. Existing geometry and traffic counts are included in uncontrollable input parameters, etc. Therefore, it is vital for identifying all such performance measures prior to proceeding additionally or validation and calibration analysis [53].
Google Earth was used to extract the geometric data, while field measurements were used for validating the extracted data. The design attributes of the roundabouts included were cross-walks, non-mountable central island, and truck apron as they were close to the yield line. A Google Play store downloaded an Android smartphone app to log in to the waypoints of an observer on a test vehicle. The travel time was estimated for each section on the basis of the average of seven runs for each floating car for the survey period. The downloaded application provided the speed, time and distance data of the test vehicle. Moreover, according to the approach suggested by Jiang and Li [54], the maximum queue length was calculated from the travel time profile. The length of the queue was defined as the start and end timestamps of the queue on the time-speed profiles and the difference between their subsequent reference point distances.
Furthermore, the simulation model was developed through basic input data such as network geometry, traffic control systems, traffic volume data, stop signs, vehicles’ characteristics, and vehicle mix on the movement of turning vehicles. Afterward, data on different MOEs were obtained for model calibration, including maximum queue, average link speed, and travel time. The field data were collected by practicing the prevailing standard procedure. Traffic volume data were collected with optimum accuracy and care as traffic volume is one of the most influential parameters to indicate the subsequent operations. A trade-off was made between delay, safety, and operational capacity for all roundabout approaches for enhancing the performance of the intersections. At a signalized intersection with a number of phases, the signal was designed to operate as a two-phase traffic classification system on the basis of demand for traffic and delay observations on the route. The length of the cycle was also kept short as likely to reduce traffic delays. In this regard, by putting the main road traffic on one phase and all other movements on the other phase, the number of phases was reduced to three, such as the all-red phase.
3.1. Site Selection Municipality
The site was selected after detailed discussions with the officials and professionals at Greater Amman Municipality (GAM) to identify the best site which could be used to achieve the objectives of this study. The sixth circle was nominated being one of the most congested intersections in the city of Amman. Also, it is geometry and the availability of traffic data made it a suitable candidate for the study (Table 1).
| Geometric Features | |||
|---|---|---|---|
| Central island diameter | 37 m | No. of lanes in Entry width | 1 lane |
| Inscribed circle diameter | 50 m | Entry angle 32 | 32 Deg. |
| Circulating width | 6 m | Entry path radius | 48 m |
| Number of legs | 4 m | Splitter radius | 54 m |
| Entry Width | 6 m | Pedestrian crossing | No |
| No. of lanes in circulating width | 1 lane | Police patrol No | No |
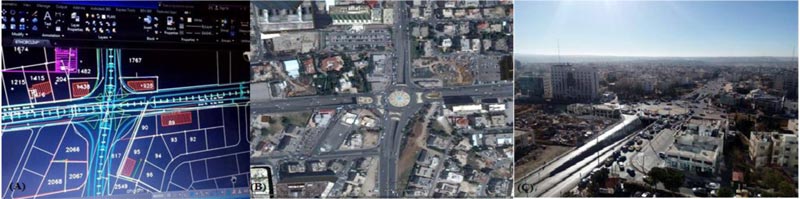
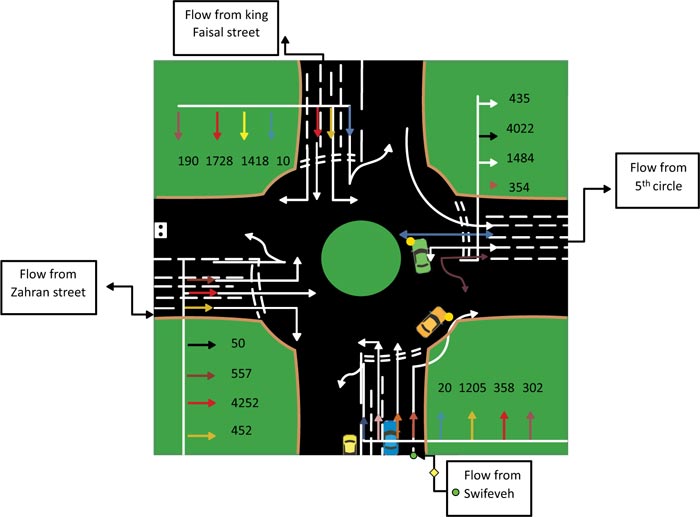
The general features of the case study site are shown in Fig. (1).
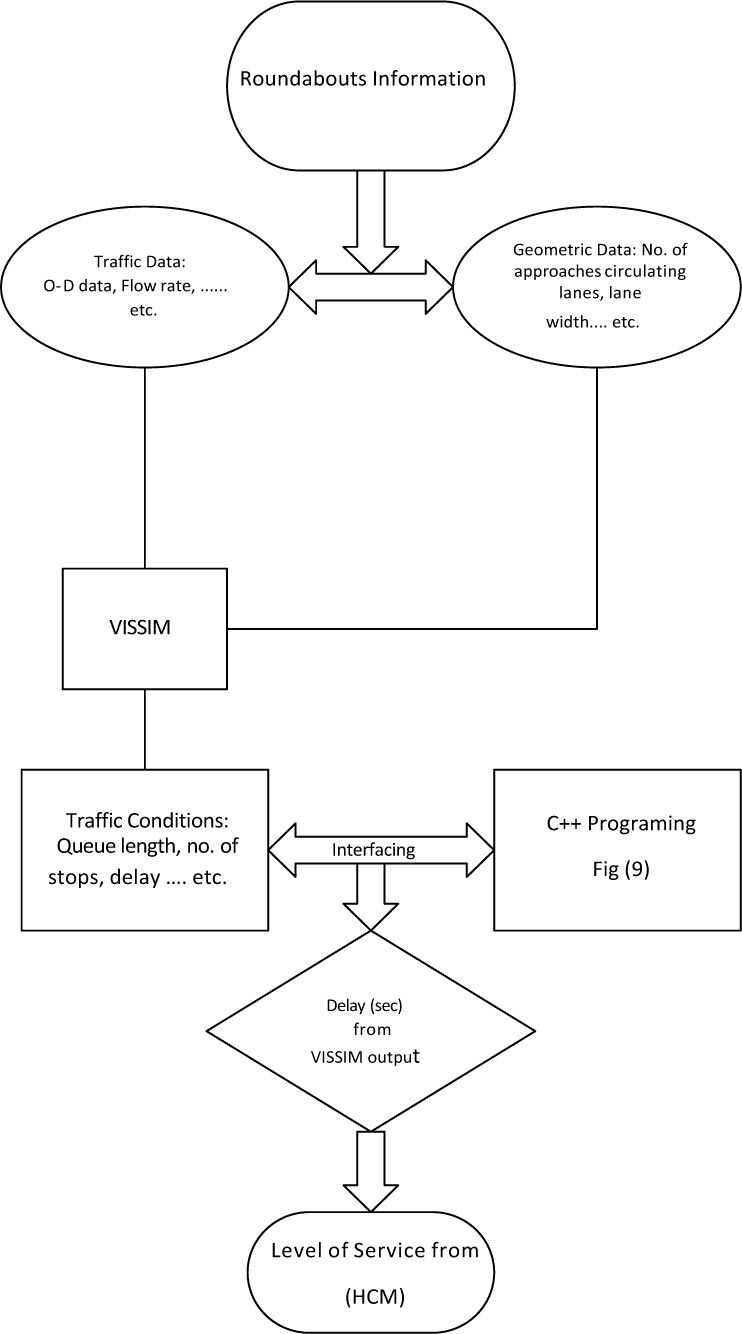
The roundabout has four major approaches and two underground tunnels to facilitate the through movements on the major approaches. Therefore, the roundabout is mainly used for the turning movements since the through movements are served by the tunnels. The methodology used in this study presents a detailed description of data collection procedures, either collected from field or historical data from other sources, and is explained in the following sections. A summary of the methodology is presented in Fig. (2) below.
3.2. Traffic Data Collection
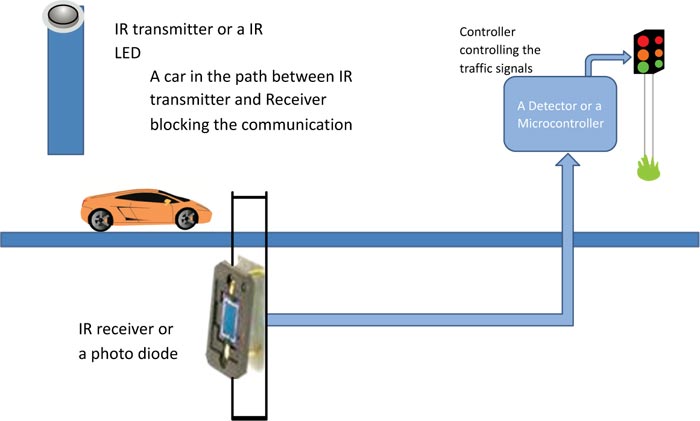
To collect the needed traffic data for the study, several visits to the site were made to identify the special conditions at the site and capture the traffic characteristics during the peak periods. In addition, the traffic count data was collected from GAM to identify the peaks that will be modelled in addition to the traffic patterns in the case study area. The data records were obtained from the ground sensors data for the sixth circle from the central traffic department. The platform for the ground sensors used to collect the traffic data is illustrated in Fig. (3)
3.3. Model Development
VISSIM was used for the analysis of networks from each crossing to whole metropolitan areas of all sizes.VISSIM has been able to model all practical roadway classifications within these transport networks, from freeways to parking lots and driveways. The versatility of VISSIM's network also enables multimodal facilities such as transit, bicycle and pedestrian facilities to be easily built. Network construction was done easily by importing from VISUM or SYNCHROTM. Vissim outcomes delay, level of service, simulation video, calibration model, average queue length, and vehicle flow and time were evaluated in this project. The topology of the connector allows the highest versatility, accuracy and detailed 1/10 resolution in combination with vehicle movements. VISSIM provides a COM interface that allows professional users and researchers to use Visual C++, Python, Javascript, Visual Basic or other macro languages for programming large applications. In this project, the researcher has used C++ macro language. VISSIM simulates individual driver behaviour and characteristics by using a link connector to draw any type of intersection in its interface and provides higher amounts of details. Various parameters like reduction in speed areas, 3D modelling, etc., were included for modelling in VISSIM. It has an Application Programmers Interface (API) package that enables users to integrate their own signal control and driver behaviour.
The capacity of both signalized and unsignalized options was undertaken as the optimum throughput for the period of analysis undertaking the existence of a continuous queue of approaches for all cycles during the microsimulation process. The data collection tool was placed for counting the entering vehicles on the approach yield lines in VISSIM. Travel measurement sections were defined for obtaining delays in VISSIM, which commenced from an upstream point of the yield or stop lines and ended at the stop or yield lines. The mean travel time was computed for vehicles that traverse the travel time measurement sections. On the contrary, to calculate the mean travel time, the difference between the theoretical travel time and the actual travel time was used. Queue counters were placed to determine the average and maximum queue length on the approach yield or stop lines. Queues were measured at all times as the distance between the queue counter and the last car was in the queue. In this study, a vehicle is in the queue when its speed is less than 5 km/h and remains at the queue. Videos were recorded using VISSIM for the sixth circle during peak hours for improving the sixth circle (Figs. 4 and 5).
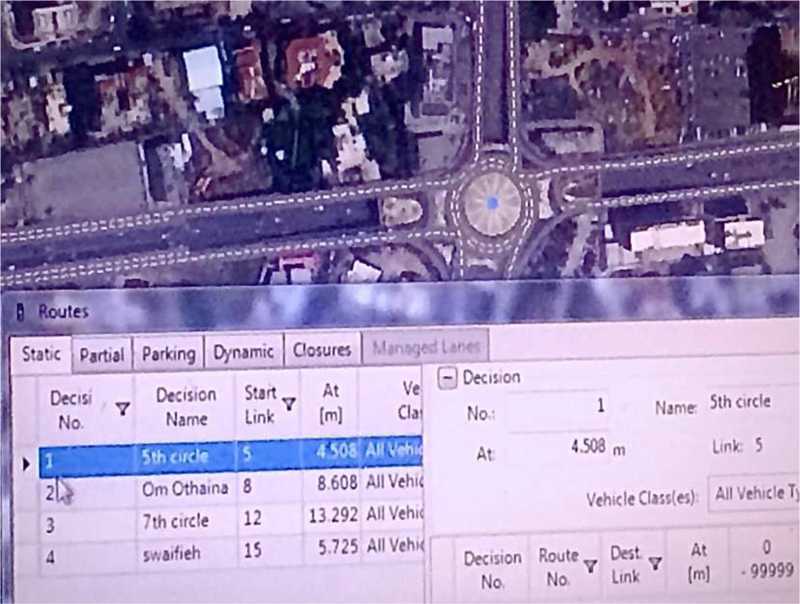
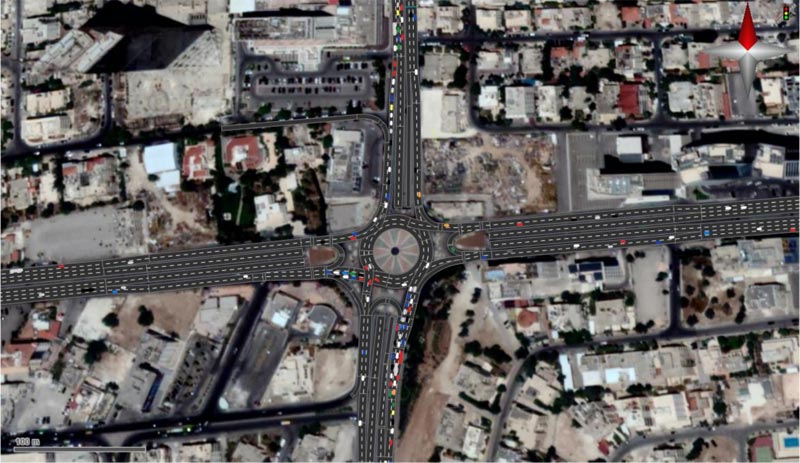
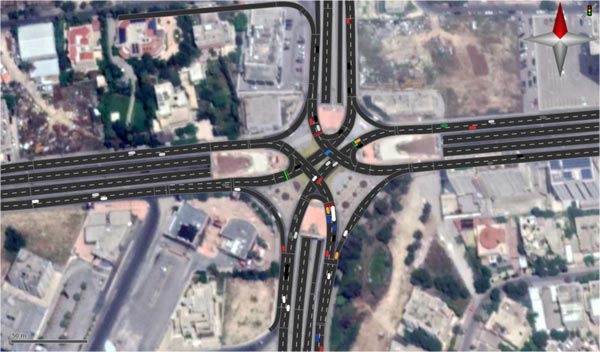
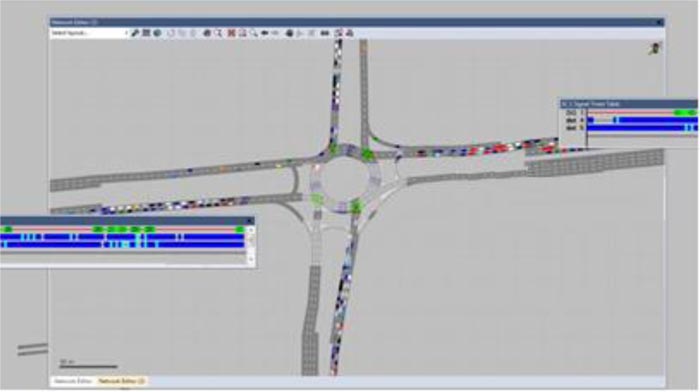
Fig. (6) shows the current situation based on the values of the true density of the cars for the sixth circle. The current circle setting calculates the level of service from delay and the roundabout LOS.
3.4. Calibration Parameters
It is essential for identifying the critical calibration parameters as well as for determining approved variations for each of the calibration parameters throughout the microscopic simulation model. There are different parameters that can be calibrated in VISSIM [55]. Acceleration, clearance distance, and desired speed are reported by a previous study, while emergency stopping distance, lane change distance, standstill distance, minimum headway, waiting time before diffusion were used by other studies [56–58]. On the contrary, not all of them were equally substantial for calibration. In the literature, several sensitivity analyses have been reported for the determination of substantial calibration parameters. The simulation delay is compared with the delay attained by utilizing the default parameter values. The parameter is accounted for as sensitive if the change in default value affects delay.
Gap parameters were adjusted for performing calibration until travel times were predicted by the model travel times observed from the video recordings. Volume throughput is often utilized for calibrating models, but it is likely that vehicles entering the network did not equalize the observed vehicular demand. The travel times were utilized as a primary calibration parameter since it is assumed that several approaches might be oversaturated. The travel time of the model with the travel time of the video was adjusted with the conflict areas in the VISSIM model. A total of four parameters were dealt within the conflict area, including safety distance factor, front gap, rear gap, and visibility. The complexity of the model infers that the existing calibration-level must be sufficient for the analysis even though the calibration procedure was not competent for precisely matching travel times to observed values.
4. RESULTS AND DISCUSSION
After the base model results were obtained, the first scenario was built by removing the roundabout and replacing it with a four-legged signalized intersection. Due to the geometric properties of the intersection, the signal phasing modelled was a two-phase signal. This was done so that the two signals opposite to the direction should open and close at the same time, as shown in Fig. (6).
After this attempt, several timing plans were tested using cycle time 90, cycle time 100, cycle time 120, with free rights, and without free rights. The best result was observed in cycle time 90.
For the following scenario, the geometry of the roundabout was preserved, but traffic signals were added to improve its operation. The modelled scenario has kept the roundabout as it was setting up for adaptive signals to regulate the traffic and reduce congestion and accidents (Fig. 7).
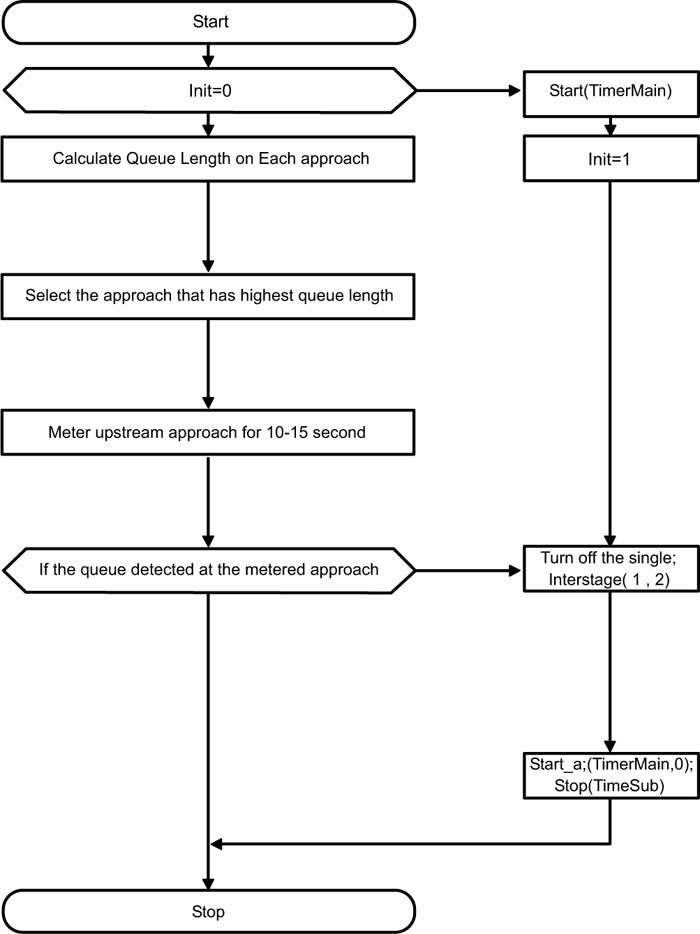
ASCT can determine red and green interval and the signal timing plans by receiving and processing data from strategically placed traffic sensors. ASCT helps to enhance the level of service that local roads and highways provide users. The method is straightforward. Second, data collection is provided by traffic sensors. The next step is the evaluation of traffic data and the implementation of improvements to signal timing. Finally, ASCT implements signal timing updates by Interfacing Between VISSIM Software and C++ Computer Program (Fig. 8). Every few minutes, the process is repeated to ensure smooth flow. ASCT increases the time of travel by over 10 percent on average. Improvements maybe 50 percent or more in areas with especially outdated signal timing.
4.1. Faster Responses to Traffic Conditions
The typical method of signal timing consumes time and needs large quantities of traffic data manually recorded. Traditional signal timing plans for the time of day do not accommodate variable and unexpected traffic demands. Users, frustrated drivers and degraded safety result in this. Months or years may pass before inefficient traffic signal timing settings are changed in the absence of complaints. The ASCT collects data and continuously updates the signal timing.
In this modern technology, there is no need to calculate the delay because it is constantly changing as soon as sensors feel congestion on a line that turns from red to green, so the delay is very limited. As for the level of service, this modern technology provides the highest level of service and limited change, which is possible to be the level of service between (B - C). It may change to a little less or more because of the constant change of sensors to open and close, but as a level of service in general.
4.2. Volumes at Peak Hours (PM)
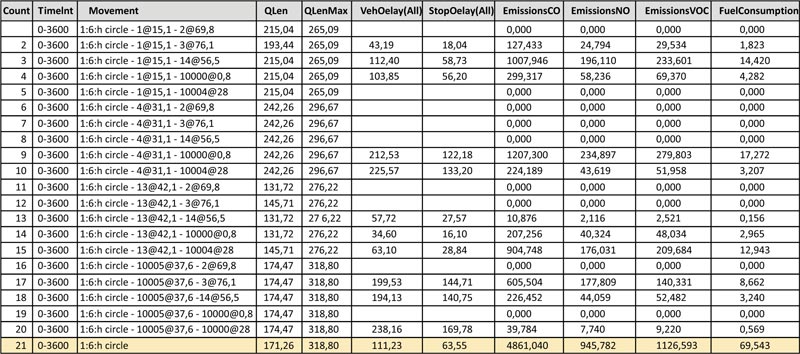
The level of service for an unsignalized approach is based on “control delay” (Table 2). After collecting the traffic volume from the ground sensors, the researcher has inserted them in VISSIM software with different cycle lengths to show the best solution and delay then, we calculate the level of service according to HCM (Table 3).
The findings have been explained as heavily congested with all strategies performing at LOS F. This is further evident from the delays and long queues with all approaches performing at LOS F. The average queues vary from 115 to 179 m respectively, with the maximum in each case. The average delay per vehicle varies from 42.4 seconds to the overall movement of vehicles. The average queue and flow rate can be classified to 76.2 m and 1358 vph on average, while the maximum queue was attributed to north-east, north, and north-west approaches. On the contrary, the maximum flow rate was observed in east-south, north-east, and south-east approaches.
The operational performance of the single-lane roundabout intersection enhances substantially when removed with the proposed signalized roundabout option. The queue length, at 6th cycle, was decreased by more than 100%, from 221.3 m to 76.2 m. Moreover, the average flow rate was increased significantly. Due to heavy congestion, site observations have shown a dual carriageway throughout the peak, which allows drivers to make detours via other networks for joining the roundabout at the north and south approaches. Alternatively, by putting movements on different phases of the signal; this problem can be solved.
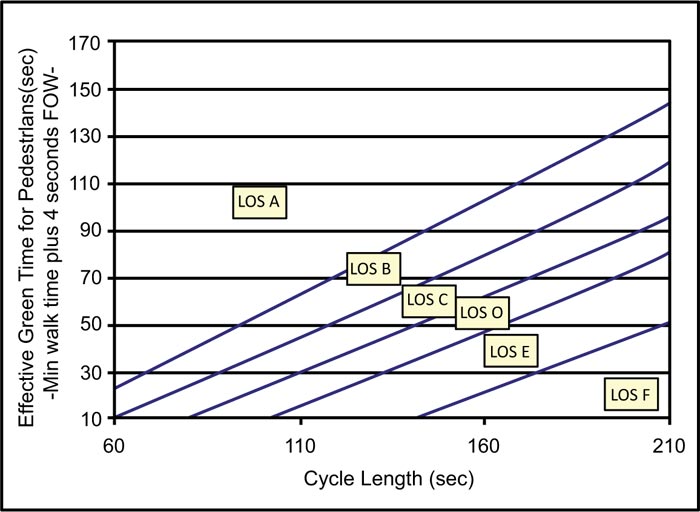
The study has shown that this data and simulation provided the best solution to every 15 minutes and 90 seconds cycle time (Table 2). Figs. (9 and 10) show 6th circle section traffic volumes and the relationship between cycle length with time and level of service, respectively. The movement patterns at 6th Circle are shown in Fig. (11).
| LOS | Control Delay (sec) |
|---|---|
| A | ≤10 |
| B | >10& ≤20 |
| C | >20 & ≤35 |
| D | >35 & ≤55 |
| E | >55 & ≤80 |
| F | >80 |
| Movement | Cycle Length (sec) | |||||||||||
|---|---|---|---|---|---|---|---|---|---|---|---|---|
| Current Condition (Unsignalized) | 120 | 100 | 90 | |||||||||
| Flow (vph) | Delay (sec) | Av. Queue Length (m) | Flow (vph) | Delay (sec) | Av. Queue Length (m) |
Flow (vph) | Delay (sec) | Ave. Queue Length (m)) |
Flow (vph) | Delay (sec) | Ave. Queue Length (m) |
|
| E-E | 0 | 0 | 182 | 50 | 82.1 | 270.6 | 71 | 37.9 | 173.5 | 68 | 38.4 | 144.7 |
| E-N | 3 | 96.9 | 272.6 | 42 | 91.6 | 270 | 64 | 39.9 | 173.5 | 75 | 41.3 | 144.7 |
| E-S | 16 | 152.8 | 182 | 211 | 80.2 | 206 | 303 | 32.3 | 123 | 306 | 33.9 | 39.8 |
| N-E | 13 | 123 | 303.8 | 212 | 114.1 | 209 | 269 | 77 | 146.6 | 269 | 54.2 | 95.6 |
| N-N | 0 | 0 | 156.8 | 0 | 0 | 209 | 0 | 0 | 146.6 | 0 | 0 | 95.6 |
| N-W | 7 | 153.8 | 295.9 | 41 | 128.3 | 205.7 | 26 | 93.1 | 146.6 | 31 | 69.4 | 95.6 |
| S-E | 27 | 189.2 | 308 | 21 | 137.7 | 205.7 | 88 | 54.9 | 135.7 | 106 | 52.3 | 67.9 |
| S-S | 0 | 70.7 | 173.5 | 140 | 198 | 205.7 | 2 | 79.8 | 135.7 | 2 | 8.1 | 67.9 |
| S-W | 36 | 61 | 341.6 | 1 | 156.7 | 136 | 248 | 70.6 | 135.7 | 267 | 51.6 | 67.9 |
| W-N | 4 | 28.5 | 205.2 | 120 | 133.7 | 136 | 155 | 14.3 | 12 | 154 | 18.5 | 13.6 |
| W-S | 16 | 11 | 208.3 | 107 | 151.6 | 136 | 44 | 20.7 | 12 | 45 | 19.6 | 13.6 |
| W-W | 5 | 15 | 149 | 29 | 185 | 140 | 8 | 24.7 | 12 | 8 | 18 | 13.6 |
| ALL | 127 | 199 | 221.3 | 862 | 115.7 | 200 | 1278 | 50.1 | 112.7 | 1358 | 42.4 | 76.2 |
| LOS | F | F | E | D | ||||||||
When the single-lane roundabout is changed to a signaled roundabout alternative with exclusive bypasses for right turning movement, the intersection performs effectively. In general, there is a substantial elevation in maximum throughput, mitigation in queue lengths and approach delays, particularly on the west and south tracks. Due to the high ratio of left-turning traffic from adjacent approaches, the minor roads did not experience a reduction in delay, unlike the main road through traffic.
At the base, adaptive traffic signal controls reduce traffic congestion, change signals, and adapt based on the demand of actual traffic. Therefore, an adaptive system can react in real-time to the vehicles at the intersection rather than adhering to a fixed cycle as most traffic controllers and systems used. This is accomplished with a combination of advanced hardware and software. Measuring systems is used to recognize traffic demand. There may be loops at a basic level, but a camera or a thermal camera may also be available. These sources detect the presence of vehicles and provide traffic data into the software.
This software adapts the traffic controller by responding to the presence of vehicles at any given time and appropriately prioritizing signal changes. This technology makes the traffic controller adaptive by reacting to the presence of the vehicle at any given time and giving proper priority to signal changes. There are no accurate figures for the delays and the level of service in this modern way because of the continuous changes in these results and the presence of accurate sensors working to open and close the signal in case of increasing the length of the waiting queue or a delay.
CONCLUSION
This study presented an approach that could be used for programming adaptive traffic signals using C++ algorithms. The developed approach was tested on a real-life congested roundabout in the city of Amman, Jordan. The roundabout had severe congestion levels with long queues extending for more than 90 meters during the peak periods. VISSIM microsimulation software was used to develop the base (existing condition) scenario in addition to different modelled scenarios that were tested. The modelled scenarios included the existing condition, removing the roundabout and using a 2-phase signalized intersection in addition to a signalized roundabout. The adaptive traffic signal timing plans were developed using the C++ algorithms and integrated into VISSIM software, where the results showed significant improvement in the LOS and reductions in the delay at the intersections by almost 75%. The approach presented in this study could be implemented for different signalized intersections, and the results showed that it could improve the efficiency of the signalized intersections and produce better LOS and lower intersections delays for different configurations.
CONSENT FOR PUBLICATION
Not applicable.
AVAILABILITY OF DATA AND MATERIALS
The data and materials used to support the findings of this study are available from the corresponding author [I.K] upon reasonable request.
FUNDING
This research is not funded by any resource.
CONFLICT OF INTEREST
The authors declare no conflict of interest, financial or otherwise.
ACKNOWLEDGEMENTS
The author is very thankful to all the associated personnel in any reference that contributed in/for the purpose of this research.

