All published articles of this journal are available on ScienceDirect.

A Framework for Estimating Future Traffic Operation and Safety Performance of Restricted Crossing U-Turn (RCUT) Intersections
Abstract
Background:
Despite numerous studies demonstrating the effectiveness of Restricted Crossing U-Turn (RCUT) intersection design, its implementation remains uneven and close to zero in some large states, including California. This paper provides a comprehensive framework to estimate the operational and safety performance of future RCUT designs. The framework is demonstrated for a geometrically constrained intersection located on a high-speed rural expressway. The operational evaluation relies on microscopic simulation models of existing TWSC and alternate RCUT designs used to estimate network-wide performance measures.
Methods:
Two approaches are demonstrated for future safety estimation; first, an HSM-prescribed Empirical Bayes (EB) approach that uses Safety Performance Function (SPF) predictions combined with the crash history of the site. For typical applications, EB estimates may be combined with CMFs for RCUT found in the literature. This approach remains the preferred option for safety estimation. However, for geometrically constrained locations where atypical RCUT designs need to be evaluated, a surrogate measure-based approach that uses trajectory data from the simulation model is described.
Results:
Surrogate measure-based safety analysis revelated that the RCUT design with no-left turn from mainline would be the most appropriate design for this location.
Conclusion:
The framework demonstrated here may be used by agencies to estimate the future benefits of the first-time application of treatments that have been successful elsewhere.
1. INTRODUCTION
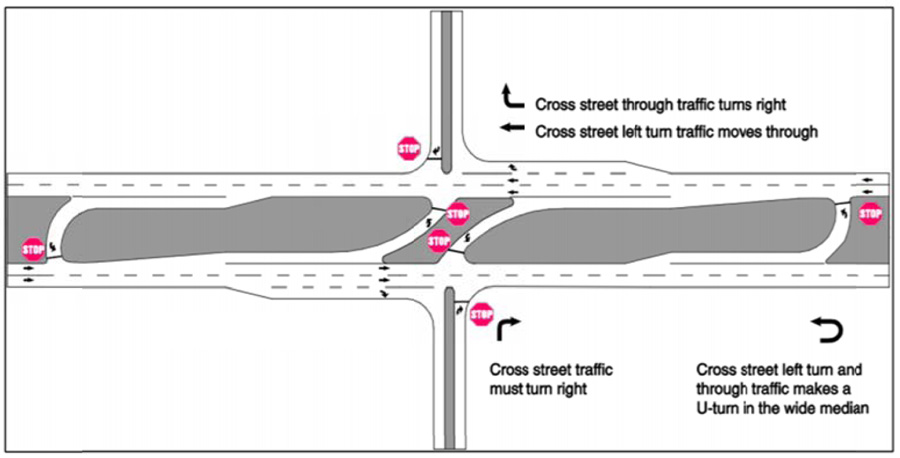
Despite the significant amount of research on alternative designs ([1-18]), there are still existing gaps in the literature, for example, with regards to RCUT intersections in rural areas with challenging topography. Improved access to highways has been identified as a critical equity issue for rural areas [19]. Several rural communities rely on 2-way STOP-controlled intersections with high-speed expressways for access to markets or tourism traffic. These intersections do present operational and safety challenges [20]. If the economic cost of converting Stop-controlled approaches into a grade-separated interchange cannot be justified, often the concerned agencies shut down the intersections severely impacting businesses such as local farms and wineries [21, 22]. RCUT intersections are an innovative low-cost intersection design where all traffic on the minor road must turn right at the main intersection, thereby eliminating the conflicts leading to severe far-side angle crashes (Fig. 1). Despite the lower cost and potential to address operational and safety concerns through the elimination of severe conflicts [1-18], their application is not uniformly distributed throughout the US. For example, they are widely used in North Carolina and Michigan, but to the best of our knowledge, there is no known application of these designs on rural expressways in CA.
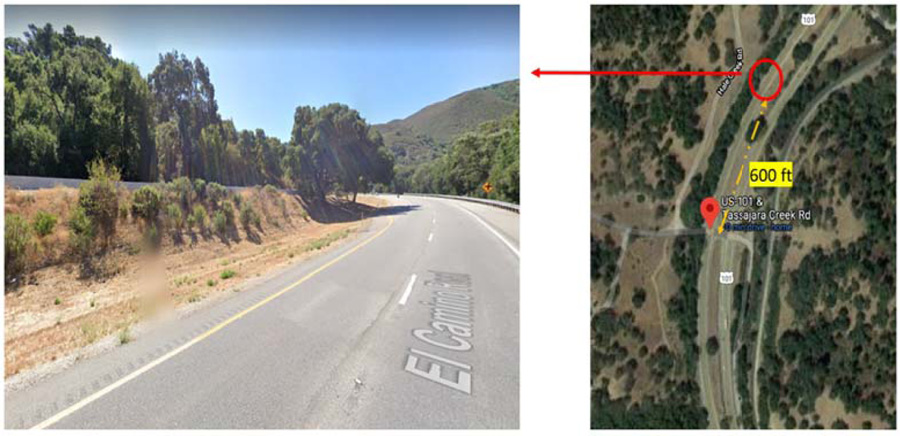
This research presents a framework to estimate the expected safety and operational performance of RCUT intersection designs as possible substitutes for a conventional Two-way Stopped Controlled (TWSC) intersection. The framework is demonstrated with an application case study at a rural California intersection (Figs. 2 and 3) with challenging geometric features and limited right-of-way (ROW). The analysis framework for considering and evaluating such treatments could provide new insights for transportation designers and engineers. Moreover, published research that matches their local or regional context may push practitioners in large states like California to at least evaluate such alternatives where they may be appropriate. The framework used in this study will allow agencies to:

1. Define possible RCUT alternatives and identify geometric constraints that may affect the range of the alternatives.
2. Estimate the expected future operational conditions, including the vehicle travel times for the RCUT designs in comparison to existing TWSC.
3. Establish a procedure to estimate the safety performance of the RCUT designs in comparison to the existing intersection by using the following methods:
a. Empirical Bayes approach prescribed by the Highway Safety Manual [23, 24].
b. A surrogate measure-based approach;
4. Discuss the relative merits and select from the two approaches to estimating safety
The study utilized the microsimulation approach to estimate operational performance. Simulation output from PTV-VISSIM [25] is also used in conjunction with SSAM (Surrogate Safety Assessment Model) [26] for the surrogate measure-based safety estimation.
2. BACKGROUND
The first traces of alternative to the traditional 4-legged intersections go back about 70 years ago when jug-handle intersections were constructed in New Jersey [27]. Median U-turn (MUT) intersections were introduced in Michigan in the 1960s, and there are many of them all around the US that still perform well. Based on past studies, MUT intersections could improve traffic operation and safety in locations with lower left-turn traffic by reducing the number of signal phases and conflict points [28]. Alternative intersections gained great attention again during the 1990s with growing traffic volume and tighter budgets for funding new infrastructure in the US. In the last three decades, hundreds of alternatives to traditional 4-legged intersections designs, including roundabouts, quadrants, RCUTs, and Contraflow intersections (CFIs), have been built in the US.
RCUT intersection (it is also called a superstreet, synchronized j-turn, or reduced conflict intersection) is a variation of the MUT design. However, in contrast to the MUT, traffic coming from the minor roads is not allowed to proceed straight across the major roads. Also, left-turn traffic on the major roads would access the minor roads using exclusive left-turn lanes at the intersection (instead of using U-turns like MUTs). RCUT intersections could be stop-controlled, yield controlled or signalized. Fig. (1) shows a typical rural RCUT intersection [14].
According to past studies [4, 29, 30], RCUT intersections illustrated excellent performance in terms of traffic operation as well as safety when there is a low through and left-turn demand on the minor road. A study on a rural four-lane high-speed major road in Missouri [12] showed high potential for RCUT in terms of traffic safety performance; however, the vehicle travel times at RCUT intersections were slightly higher than the existing TWSC intersection. A before-after analysis of fatal and injury, angle, and left-turn crashes showed that these crashes reduced by more than half after upgrading a conventional stop-controlled intersection to an RCUT intersection. Sideswipe, rear-end, and other types of crashes decreased by a lesser degree or slightly increased [14]. Another study examined the safety performance of five RCUT (with stop signs) installations on a rural, four-lane highway in comparison to a conventional stop-controlled intersection on minor roads [11]. Data was gathered three years before and after the installations. It was found that the RCUT intersections reduced the total number of reported crashes by an average of 35%. Additionally, no fatal crashes happened during the study period after installation. While the literature provides significant evidence of the efficacy of these intersections based on post hoc analysis, the literature is lacking in framework to evaluate the future expected performance of RCUT intersections for jurisdictions (e.g., Caltrans) where they have not yet been implemented. This study provides such a framework for future safety and operational performance evaluation framework using case study from a site in rural California.
3. METHODS
3.1. Modeling Context
3.1.1. Site Description
The case study site used to demonstrate the framework is located at the intersection of US-101 and Tassajara Creek Road in San Luis Obispo County (Caltrans 5) of California. Based on the California Department of Transportation (Caltrans) database, the Annual Average Daily Traffic (AADT) for this US-101 segment was 52,060 in 2018. Overall, six crashes were reported at the intersection between 2015 and 2019, with 2 of those crashes resulting in injuries. US 101 is an expressway with a speed limit equal to 65 mph in this segment. Similar to (Fig. 1), left-turn movements from the major road (US 101) and all traffic movements coming in from the minor roads are stop controlled. In terms of geometry, there are two through traffic lanes and one exclusive lane for each turning movement from the major road, while there is only one traffic lane in each direction on the minor road.
3.1.2. Simulation Modeling
Since the objective of the study is to propose a framework for proposed designs for the future, microsimulation was the most appropriate tool for the operational evaluation. Note that the simulation output is also used for surrogate measure-based safety evaluation. PTV VISSIM was chosen to model the existing and proposed designs. VISSIM can realistically model various traffic patterns with detailed geometric features and drivers’ behavioral characteristics [25]. Besides, VISSIM is one of the microscopic simulation packages from which the vehicle trajectory data (in the form of .trj files) may be used directly with SSAM. SSAM was used to estimate the frequency and type of narrowly averted vehicle-to-vehicle interactions (i.e., conflicts). SSAM utilizes the vehicle trajectory files from VISSIM along with a specified time-to-collision (TTC) threshold to identify the number and type of simulated conflicts (i.e., near misses) between vehicles. Details of the SSAM functionality may be found in [26].
3.1.3. Design Constraints
As mentioned previously, the existing intersection is located on mountainous terrain, and examining potential RCUT design for such location remains a relatively unexplored question in the literature. Here are some of the issues with the location, along with the impact it had on the alternatives proposed and examined in this study:
- Due to the significant elevation difference between northbound (NB) and southbound (SB) directions north of the intersection, it is not possible to consider a U-turn crossover at a typical distance of 600-ft from the main intersection. (Fig. 3) shows a clear view of this issue. Hence, two alternatives were included in this study to be compared with the existing TWSC design:
- RCUT #1: an RCUT with a 400-ft distance between the northern U-turn and the main intersection, but with no left-turn lanes in the center of the intersection. In this scenario, small left-turn demand from the major road will use the U-turn crossovers),
- RCUT #2: an RCUT similar to alternative #1 but with an additional left-turn lane from the northbound direction. In both designs, a 600-ft distance was considered between the southern U-turn and the main intersection.
Fig. (4) shows the two proposed alternatives modeled in VISSIM. Based on the FHWA guideline on RCUT (Hummer et al., 2014), a distance of 400-800 ft is recommended from the main intersection to the U-turn at an RCUT intersection with stop signs.
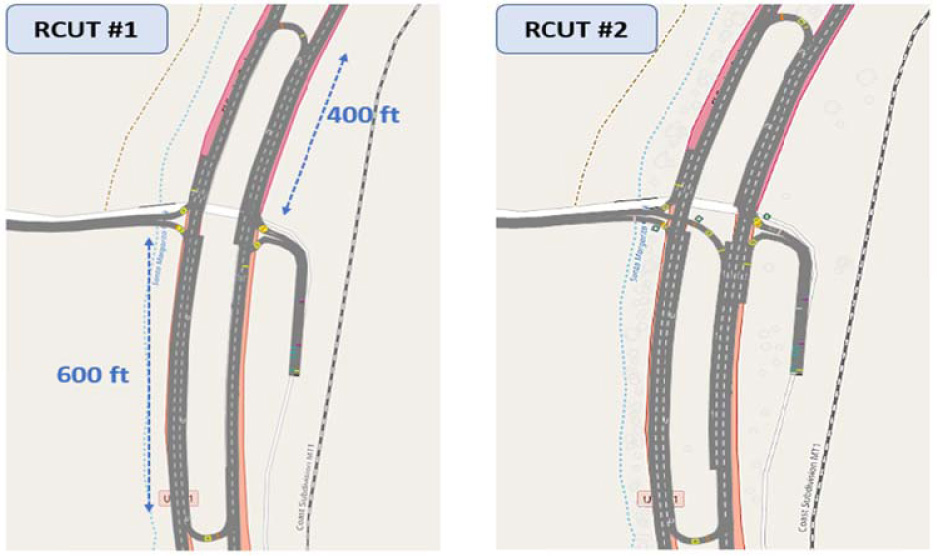
Table 1 shows geometric data collected from 14 existing RCUT intersections in a past study [30], and it guided the RCUT designs modeled in VISSIM. It should be mentioned that the existing median width is 45 ft at the intersection, which is appropriate for upgrading to an RCUT design. The same number of lanes as the existing intersection was considered for the proposed designs to make a fair comparison. Since the speed limit is equal to 65 mph on the major road, no left-turn lane was considered on the SB direction to provide enough declaration-lane length for the left-turn vehicles from the NB direction. All the other geometric features were considered based on the Green Book [31], Caltrans Highway Design Manual [32], and data as reported in Table 1 [30].
| Parameters | Radius of U-turn, (ft) | Radius of Loon, (ft) | Median Width, (ft) | Distance from U-turns to the Center, (ft) |
|---|---|---|---|---|
| Average | 29 | 47 | 31 | 1030 |
| Median | 28 | 45 | 22 | 900 |
| Minimum | 15 | 40 | 8 | 500 |
| Maximum | 40 | 60 | 130 | 2400 |
To obtain statistically robust evaluations, each simulation scenario was repeated five times in VISSIM, and the average of those runs was chosen as the outcome for each scenario. Also, Analysis of Variance (ANOVA) was conducted on the simulation outcomes using IBM SPSS [33] to compare vehicle travel time of the designs.
4. CALIBRATION AND VALIDATION
The research team installed a video camera at the location to record the PM peak hour traffic. The video was reviewed to estimate average speed, headway, and allowable gap for the turning traffic. Due to the negligible turning traffic demand at the study location, another video camera was installed at a similar intersection (State Route 65 and Avenue 182) in Tulare County, California, to include a larger number of observations to estimate the distribution of the allowable gap. Among the measures from the recorded videos, vehicle speed and the acceptable gap for turning movements were used to calibrate the simulation model, while headways were used for the validation.
Table 2 shows a summary of data collected from videos. Based on the data in Table 2, speed distributions with a mean speed of 72 mph were added into VISSIM on all lanes of the major road, while vehicles had an average speed of 25 mph (same as the speed posted) on the minor road approach. Also, traffic coming from the minor road, the left-turn demand from the major road, and the U-turn vehicles (in RCUT designs) could start their movements when there was a minimum gap equal to 4.5 seconds between the conflicting vehicles. By default, VISSIM considers a 3-sec minimum gap for conflicts between through traffic and turning traffic movements. However, the 3-sec gap would not be acceptable in this study because of the high speed on the major road.
After changing the simulation model setting to desirable levels, we estimated traditional validation measures, including travel time and delays at the Stop sign. While these measures signified that the model was well-calibrated, such measures aren’t most meaningful in the context of this location. For appropriate SSAM-based safety evaluation, the distribution of simulated headways vs. field headways was the most critical validation measure. Based on simulation runs of the TWSC model, the mean headway was identified to be equal to 2.90 s and 3.01s on the left and right lanes of the major road, respectively. By conducting ANOVA, differences between real data and simulation outputs were found to be statistically insignificant at a 95% Confidence Interval.
5. SIMULATION SCENARIOS
Traffic volume was collected during AM peak (7:00 AM to 8:00 AM), mid-day (Noon to 1:00 PM), and 4:30 PM to 5:30 PM) on a weekday in June 2020. (Fig. 5) shows existing traffic volumes during PM peak hour between 4:30 PM and 5:30 PM. As shown in Fig. (5), the intersection operated almost as a T-intersection due to the very low demand from the WB direction. It should be noted that there are only a few residential houses on this side of the intersection.
For this study, in addition to exiting traffic demand conditions for three different times of day, a wide range of scenarios were defined to cover various states of current and future traffic demand, traffic distribution (on different approaches), and turning traffic ratios. Overall, 54 simulation scenarios were tested in this study. Table 3 shows the factors considered to create the 54 (3*2*3*3) different traffic condition/intersection design scenarios. These factors include:

| Parameters | Speed on the Major Road (mph) | Headway on the Major Road (sec) (Validation measure) |
Gap for a Left-turn from the Major Road (sec) |
Gap for a Right-Turn from the Minor Road (sec) |
Gap for a Left-turn or Through movement from the Minor Road (sec) | ||
|---|---|---|---|---|---|---|---|
| Left Lane | Right Lane | Left Lane | Right Lane | ||||
| Average | 72 | 73 | 2.11 | 3.15 | 9.38 | 10.59 | 9.39 |
| Median | 70 | 75 | 1.23 | 2.61 | 7.52 | 8.73 | 8.61 |
| Minimum | 61 | 61 | 0.43 | 0.47 | 4.60 | 4.14 | 4.57 |
| Maximum | 82 | 82 | 18.95 | 13.38 | 19.45 | 24.46 | 17.42 |
| Time (3 Levels) | Year (2 Levels) | Possible Future Traffic Distributions (3 Levels) | Designs (3 Levels) |
|---|---|---|---|
| AM Hour | 2020 (Existing) | Existing Distribution | Existing TWSC |
| Noon Hour | 2030 | Demand will be increased by four times on the EB, and NB left turn | RCUT #1 |
| PM Hour | Demand will be increased by eight times on the EB, and NB left turn | RCUT #2 |
- 3: Time of day scenarios
- 2: Existing and 2030 conditions based on a 2% annual growth rate
- 3: Variations of EB and NB-Left traffic demand (existing demand; 4 times the existing demand; and 8 times the existing demand)
- 3: Intersection designs (TWSC, RCUT#1, RCUT #2)
The variations in the only EB and NB-Left demand were considered based on discussions with stakeholders. The stakeholders don’t expect the WB demand to increase due to the topography of the area. Overall, there were 18 traffic volume scenarios ranging between 3,150 and 5,100 vehicles/hr for each of the three intersection designs. The next section elaborates on the key results of the evaluation.
| Design | 2020 | 2030 |
|---|---|---|
| Existing | 109 | 110 |
| RCUT #1 | 109 | 110 |
| RCUT #2 | 109 | 112 |
6. RESULTS AND DISCUSSION
6.1. Traffic Operation Analysis
Table 4 shows average travel times obtained from VISSIM for 2020 and 2030 traffic scenarios. Note that RCUT #1 and #2 (Fig. (4) show no significant increase in average travel times for all vehicles traversing the network compared to the existing TWSC design. For 2030 conditions, RCUT#2 does, on average, have a 2 second more travel time. This is consistent with past studies [2, 11, 12, 34], and either of the two RCUT designs would be an acceptable alternative for this location, given its low demand for minor approach. Therefore, even though the left-turn and through traffic from the minor road need to travel a longer distance in RCUT designs, the difference does not significantly impact the average travel time.
6.2. Safety Analysis
6.2.1. HSM-Based Analysis
As mentioned previously, there are two approaches suggested to conduct the safety analysis. The HSM-prescribed Empirical Bayes approach is considered as the preferred option for estimating safety performance. With this HSM-prescribed framework, one could estimate the expected number of crashes per year that would occur if the intersection was left as a TWSC intersection. The step by step Empirical Bayes estimation framework is provided below.
6.2.1.1. Apply Safety Performance Function from HSM to Obtain Predicted Crashes
The first question to be resolved was the nature of the SPF used for the analysis. The HSM provides the following SPFs for 3-legged and 4-legged rural TWSC intersections [24]:
 |
(1) |
 |
(2) |
where, AADTMaj = AADT of Major Approach (vpd)
AADTMin = AADT of Minor Approach (vpd)
Considering the existing 4-legged configuration of the intersection, Equation 1 should be applied. However, due to low traffic volume in the WB direction on the minor road, the equation corresponding to 3-legged stop control intersection may be a more reasonable predictor of the safety performance. This is why we ultimately selected Equation 2 for this analysis. The range of AADT for US 101 that would cover the peak hour volume scenarios described for the simulation models was between 50,000 and 60,000 vehicles per day (vpd). For the minor road (Tassajara Creek Rd), the range considered was 50 to 1600 vpd.
| Design | 2020 | 2030 | ||||||
|---|---|---|---|---|---|---|---|---|
| Total | Crossing | Rear-End | Lane Change | Total | Crossing | Rear-End | Lane Change | |
| Existing | 18 | 1 | 10 | 7 | 24 | 2 | 14 | 9 |
| RCUT #1 | 21 | 0 | 12 | 8 | 28 | 0 | 17 | 11 |
| RCUT #2 | 24 | 0 | 14 | 10 | 30 | 1 | 27 | 12 |
6.2.1.2. Combine SPF Prediction with Crash History of the Site to get Expected Crashes
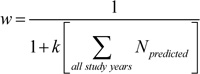
We then combined the crash history of the site (6 crashes from 2015 through 2019) with the SPF prediction obtained from Equation 2 (at the range of AADT values mentioned in Step 1) using the appropriate overdispersion parameter (2.17; for Equation 2). Equations 3 and 4 were used for this purpose.
 |
(3) |
 |
(4) |
where, Nobserved = observed historical crashes per year at a site Npredicted = predicted number of crashes per year based on the SPF (Eq. 2)
w = weighted adjustment to be placed to the PSF prediction
k = overdispersion parameter from the associated SPF
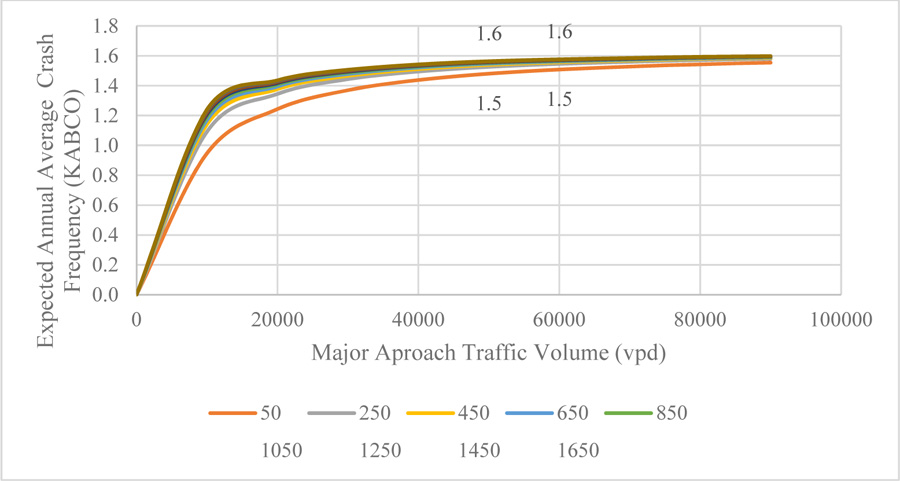
The output expected crash frequency for TWSC at different AADT values is depicted in Fig. (6).
It should be noted that the site would be expected to have 1.5 to 1.6 crashes per year as the US 101 AADT increases from 50,000 to 60,000 vpd (Fig. 6). For a typical RCUT application, the next step would be to apply the crash modification factor for converting a TWSC into an RCUT to obtain expected crash counts for the modified intersection scenarios. These CMF may be found in the latest literature [35] or from the CMF clearinghouse [36]. However, given the geometric constraint of the location, the RCUT designs used here are not typical, and hence the CMFs from the literature may not be applicable. In such a situation, a surrogate measure based approach is recommended.
6.2.2. SSAM-based Conflict Estimation
For the surrogate measure-based approach, vehicle trajectory information from each of the 54 scenarios was used in SSAM to identify the number and type of simulated conflicts for each scenario. Based on a review of past studies on applying SSAM [37-39] on rural area intersections, a TTC (Time to collision) threshold of 1.5-sec was selected for this study. Table 5 shows the SSAM outcomes on conflicts where TTC fell below the 1.5-sec threshold.
According to Table 5, RCUT #1 (the alternative with no left-turn lane in the center) would be the safest alternative. Even though RCUT #1 had more rear-end and lane-change conflicts compared to the existing design, RCUT #1 design eliminates crossing conflicts. On the other hand, the existing had the potential for safety concern due to crossing conflicts. It should be noted that the overall number of conflicts does increase with the two RCUT designs. It is likely caused by minor road traffic being involved in weaving maneuvers to access the U-turn crossovers. The constrained geometry of the location does not allow us to increase the U-turn distance and attempt to reduce these conflicts. In other words, there may be a trade-off between the RCUT and existing design such that RCUT designs increase the less severe conflicts even as reduce/eliminate crossing conflicts.
CONCLUSION
Intersection treatments, even with proven effectiveness, often have a wide discrepancy in their applications from one jurisdiction to the next. Agencies applying a certain new treatment often need a way to estimate future operational and safety benefits for their sites. Such estimations are not trivial to obtain merely based on post hoc studies from other jurisdictions. A robust framework to estimate the future operational and safety benefits of intersection treatments is proposed here. The framework may be summarized as follows:
- Develop microsimulation models for existing and potential treatment designs
- Estimate operational benefits using a well-calibrated simulation model using Measures of Performance such as travel time and delays
- Review CMF clearinghouse and other literature for assessing the safety benefits of the treatment. If the intersection treatment is typical, use the HSM-prescribed Empirical Bayes method to estimate the safety performance of the proposed design. Otherwise, use a surrogate safety-measure based approach.
This paper demonstrated this framework in the context of potential RCUT designs for a rural California intersection. Overall, 54 simulation scenarios were models using VISSIM for estimating operational performance at varying levels of travel demand for the intersection. The scenario included the base condition with TWSC intersection and two RCUT designs. Note that given the design constraints of the location, the U-turn length for the RCUT alternative was restricted in one direction to only 400 ft. This atypical design meant that available CMFs in the literature were not applicable to this location. Hence a surrogate measure-based safety analysis was conducted. The following bullet points have summarized some of the important findings:
- The proposed RCUT designs reduced or eliminated the more severe crossing conflicts.
- For both RCUT designs, there was an increase in rear-end and lane-change conflicts compared to the TWSC design. It may indicate a future trade-off between (reduced) severe vs. (increased) non-severe crashes following the installation of RCUT.
- Depending on the site context, increasing the U-turn distance may eliminate some of the weaving maneuvers that lead to increased conflicts. Of course, given the geometric constraints, it was not a viable option for this work.
CONSENT FOR PUBLICATION
Not applicable.
AVAILABILITY OF DATA AND MATERIALS
The data that support the findings of this study are available on request from the corresponding author.
FUNDING
This work was financially supported by the Center for Transportation Equity Decisions and Dollars and San Luis Obispo Council of Government (SLOCOG).
CONFLICT OF INTEREST
The authors declare no conflict of interest, financial or otherwise.
ACKNOWLEDGEMENTS
The authors would like to acknowledge the Center for Transportation Equity Decisions and Dollars and San Luis Obispo Council of Government (SLOCOG) for providing funding for this effort. Cal Poly student Mr. Blake Thomas supported data collection for this work.

