All published articles of this journal are available on ScienceDirect.

Improving Container Port Terminal Services’ by Applying CSI and QFD
Abstract
Background:
Tenau Container Port Terminal’s operation in Kupang City has low-quality services. Few studies have tried to consider the QFD and IPA methods along with other methods. Therefore, this study will try to complement previous studies using the Customer Services Index (CSI) to evaluate and improve the terminal service quality.
Objective:
The aim of this study is to analyze container operational services’ performance at the Port of Tenau-Kupang and find solutions to improve the container terminal services quality. The objective is to complement previous studies with regard to evaluating and improving the terminal service quality.
Methods:
This study uses the Customer Services Index (CSI), Importance Performance Analysis (IPA), and Quality Function Deployment (QFD) to evaluate and improve the container terminal services quality.
Results:
Several strategies such as equipment routine maintenance, truck and workers’ readiness, optimal utilization of tugboats, preparation of additional container yards, worker certification, and additional training for operators are recommended to enhance operational services’ ports.
Conclusion:
The results of this study have several similarities with the results of previous studies, especially those related to technical problems. On the other hand, there are differences in results with other studies due to differences in environmental conditions and characteristics of human resources.
1. INTRODUCTION
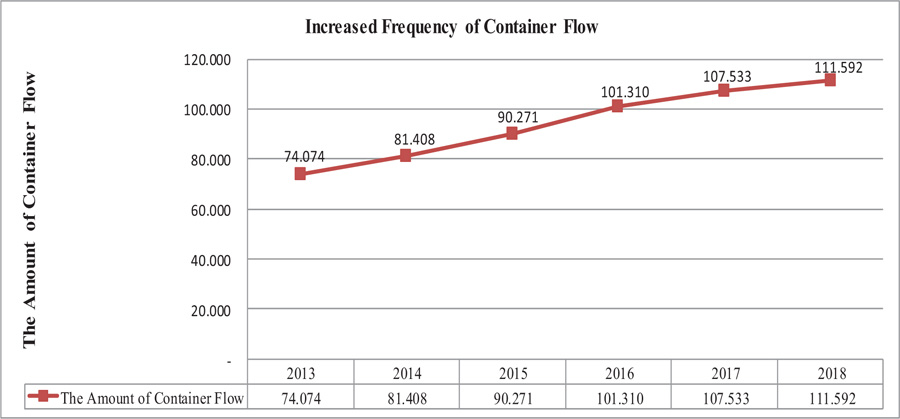
Indonesia’s enormous economic potential in all parts of the archipelago requires the transportation sector’s participation as a driver of the economy. Sea transport is the primary mode of inter-island goods transport in Indonesia, and it has overtaken land transport as the most significant mode of inter-island transport.In addition to stimulating the growth of economic, trade, and industrial activities of its area, the port is also a means of growing inter-island trade and, eventually, international trade. A container as a means of shipping goods is increasingly in demand by business operators; this can be seen from the increasing flow of containers in all ports in Indonesia. In the East Nusa Tenggara province, one of the ports leading to economic growth is the Tenau Container Port, Kupang [1]. It is noted that the flow of containers in Tenau-Kupang Port has increased quite significantly since 2013 (Fig. 1). Kupang City is the capital of East Nusa Tenggara Province, with a population of almost 450,000.
Based on such a growth situation, it is interesting to evaluate how the container port operates. Therefore, this study aims to analyze container operational services' performance at the Port of Tenau-Kupang to improve terminal service quality.
Several studies try to evaluate and improve the quality of terminal services. Several methods of improving the quality of terminal services, such as Importance Performance Analysis (IPA), Quality Function Deployment (QFD), and Port Performance Indicators (PPI), have been used in various studies. The IPA and QFD methods have been used in a previous study at the Gresik Public Port. The result shows that the operational performance at Pier 265, which serves loading and unloading general cargo, has a poor performance [2]. The study shows that the priority of handling cargo problems at Gresik port are: (a) ensuring cargo readiness, (b) warehouse usage, (c) loading/unloading equipment readiness, (d) 24 hours readiness of team for loading and unloading, (e) expansion of stacking fields, and (f) speeding up the general cargo movement in the stacking yard. The IPA method has also been used in research related to operational service performance conducted at the Port of Tanjung Perak Surabaya [3]. It was concluded that the Tanjung Perak Port of Surabaya's overall level of operational performance in 2013 had fulfilled the Indonesian Directorate General of Sea Transport Standard. This study also found the factors that affect the operational service performance are: the number and condition of the tugs boat, the availability of warehouses and stacking fields, the amount and type of equipment, and internal port access road conditions. Another study using the QFD method was the research conducted by Razik on dry bulk terminals in Malaysia [4]. This research shows that there are four main criteria for improvement: loading efficiency, infrastructure improvement, time performance, and dry bulk operation improvement. Ha, a researcher from Korea, also conducted a study related to container ports' performance using the IPA method. The result obtained that PPI is grouped into four quadrants [5]. Ha also suggests that the PPI shall be a valuable reference for stakeholders in making port development decisions.
Based on some of these studies, no research has tried to consider the QFD and IPA methods with other methods, for example, Customer Services Index (CSI). Therefore, this study will try to complement previous studies for evaluating and improving the terminal service quality.
2. METHODS
In terms of the method, this research uses three types. First, this research uses the CSI method to measure overall user satisfaction. The IPA method is applied to identify important but less satisfied variables. Finally, the QFD method identifies users' major needs by translating customer voices into the house of quality. These will become the development strategy of Tenau Container Port in Kupang City.
2.1. Customer Satisfaction Index (CSI) Method
Customer Satisfaction Index (CSI) is commonly used to analyze the overall level of satisfaction of respondents. CSI scores in this study were divided into five criteria, from dissatisfied to very satisfied [2]. These criteria are shown in Table 1.
| CSI Value | CSI Criteria |
|---|---|
| 0.81-1.00 | Very Satisfied |
| 0.66-0.80 | Satisfied |
| 0.51-0.65 | Quite Satisfied |
| 0.35-0.50 | Less Satisfied |
| 0.00-0.34 | Dissatisfied |
The steps taken to calculate CSI are as follows:
(a) Determining the Mean Importance Score (MIS) or the average importance score. This value is derived from the average interest of each consumer.
 |
(1) |
 |
(2) |
Where:
n = Number of Consumers
Yi = i-th Y Attribute Importance Value
Xi = i-th Attribute Satisfaction Value X
(b) Making Weight Factors (WF)
This weight is the percentage of the MIS value per attribute to the total MIS of all attributes.
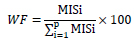 |
(3) |
Where, p = pth importance attribute made a Weight Score (WS)
This weight is the product of the WF with the average, which is the Mean Satisfaction Score (MSS).
 |
(4) |
- Determining Customer Satisfaction Index (CSI) by the ratio of the Weight Average (WA) divided by the Highest scale (HS or the maximum scale used on a scale of 5 times 100%).
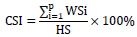 |
(5) |
Where:
p = pth attribute
HS = Maximum scale used
2.2. Importance Performance Analysis (IPA) Method
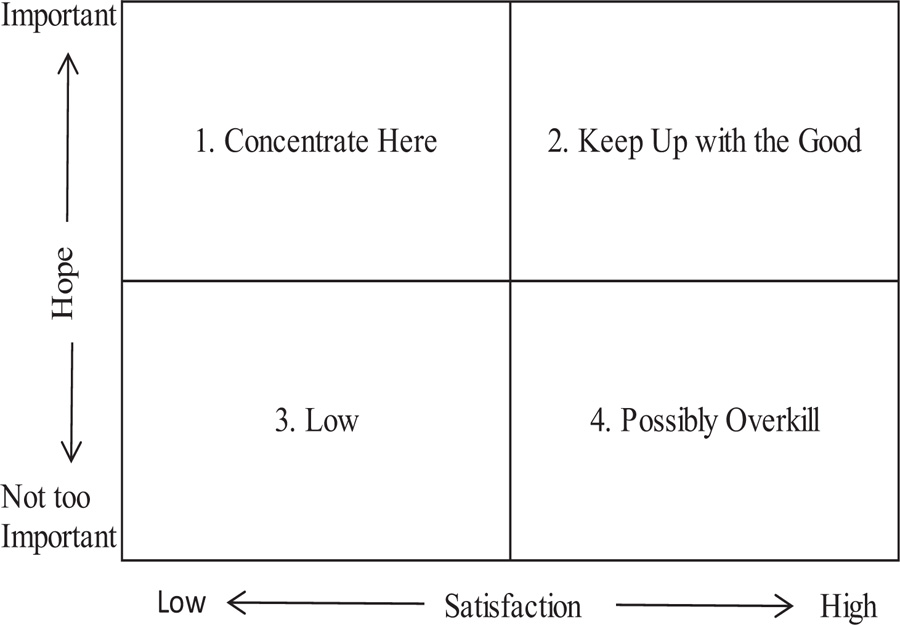
The Importance Performance Analysis (IPA) method is frequently used in measuring the level of satisfaction services, shown in the quadrants on the Importance Performance Matrix map.
The stages in the Importance Performance Analysis (IPA) method are as follows:
1. Determining the level of conformity between the level of importance and the level of quality performance of the attributes studied by comparing the performance score with the importance score, using the following formula:
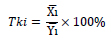 |
(6) |
Where:
Tki = Level of conformity of respondents.
Xi = The average score of the company's performance appraisal.
Yi = Average score of respondent's expectation assessment.
2. The second stage is to calculate the average for each attribute perceived by consumers, with the formula:
 |
(7) |
 |
(8) |
Where:
X = Average of the average performance level scores of all attributes.
Y = Average of the average score of the expectation level of all attributes.
k = Number of attributes that affect satisfaction.
3. The third stage is to calculate the average of all attributes of importance (Y) and performance (X), which are the limits in the Cartesian diagram, with the formula:
 |
(9) |
 |
(10) |
Where:
X = Average perception/performance score
Y = Average score of expectation/importance
n = Number of respondents
4. The fourth or final stage is the elaboration of each attribute in the Cartesian diagram. The IPA analysis makes mapping into four quadrants for all variables that affect service quality (Fig. 2).
2.3. Quality Function Deployment (QFD) Method
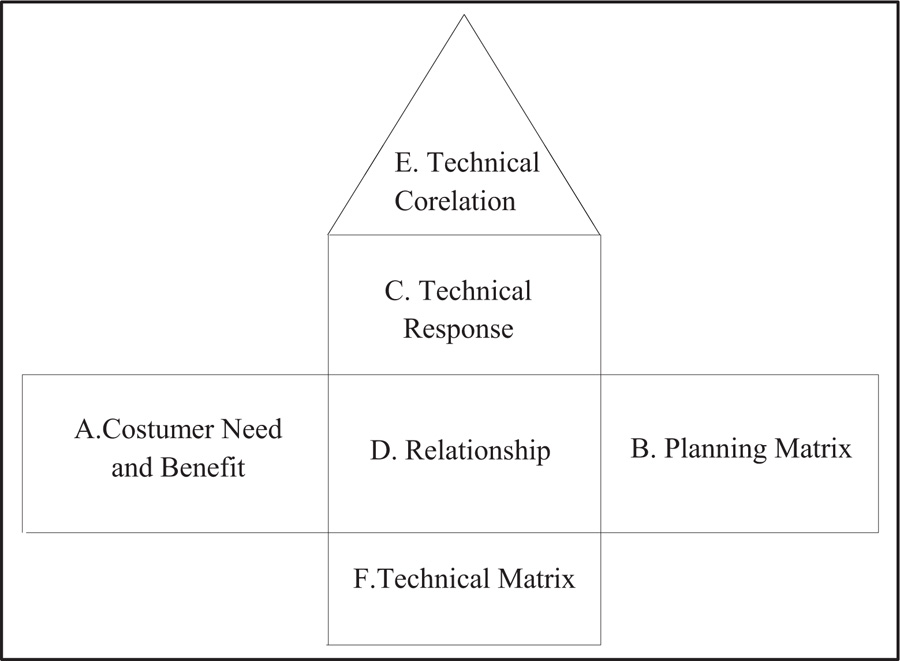
Quality Function Deployment (QFD) is a tool that is mainly used to design and develop new products that can integrate quality into the design and fulfill customer needs, translating into a technical requirement [2]. The application of QFD is to identify the customer's needs using a matrix format arranged in a form that is often called House of Quality (HoQ), with seven main sections (Fig. 3).
2.4. Data Collection Techniques
(a) Questionnaire and direct interview techniques
Data collection was done by distributing questionnaires and interviews to users of container terminal services at the Tenau Port, Kupang City.
(b) Field survey technique
The data was gathered by a direct survey in the field/research location to observe the process and mechanism of loading and unloading containers at the port.
| No | Variables | MIS | WF | MSS | WS |
|---|---|---|---|---|---|
| 1 | Quality and time length for processing the loading and unloading documents (X1) | 4.500 | 5.087 | 3.458 | 17.593 |
| 2 | The easiness of procedure for handling the loading and unloading documents (X2) | 4.208 | 4.757 | 3.833 | 18.237 |
| 3 | Document's handling fee (X3) | 4.417 | 4.993 | 3.875 | 19.348 |
| 4 | Hospitality service of port officers (X4) | 4.250 | 4.805 | 4.292 | 20.619 |
| 5 | Quick response of officers over user's complaints (X5) | 4.375 | 4.946 | 3.583 | 17.723 |
| 6 | Clarity of information related to loading and unloading (X6) | 4.500 | 5.087 | 3.625 | 18.441 |
| 7 | Skills of workers/operator (X7) | 4.500 | 5.087 | 3.625 | 18.441 |
| 8 | Productivity and speed of loading and unloading containers (X8) | 4.583 | 5.181 | 2.708 | 14.033 |
| 9 | The performance level of loading and unloading labor (X9) | 4.667 | 5.276 | 2.958 | 15.607 |
| 10 | Condition of container loading and unloading equipment (X10) | 4.667 | 5.276 | 2.042 | 10.771 |
| 11 | Security level of cargo (X11) | 4.583 | 5.181 | 3.750 | 19.430 |
| 12 | Quality of goods document services (loading and unloading permit) (X12) | 4.333 | 4.899 | 3.500 | 17.146 |
| 13 | Number of equipment for loading and unloading containers (X13) | 4.625 | 5.228 | 3.125 | 16.339 |
| 14 | Stacking field conditions and capacity (X14) | 4.583 | 5.181 | 2.958 | 15.328 |
| 15 | Pier condition (width, strength, length) (X15) | 4.500 | 5.087 | 3.708 | 18.865 |
| 16 | Accessibility of warehouse from the pier (X16) | 4.208 | 4.757 | 3.625 | 17.246 |
| 17 | Accessibility of pier from the main highway (X17) | 4.292 | 4.852 | 3.833 | 18.598 |
| 18 | Warehouse area wide (X15) | 3.958 | 4.475 | 3.625 | 16.221 |
| 19 | Accessibility of warehouses from main highways (X16) | 4.208 | 4.757 | 3.917 | 18.633 |
| 20 | Port lighting system (X17) | 4.500 | 5.087 | 3.833 | 19.501 |
| ∑ | 88.458 | 100.000 | 69.875 | 348.118 | |
| No | Variables | MIS | WF | MSS | WS |
|---|---|---|---|---|---|
| 1 | Approach time (X1) | 4.000 | 10.435 | 3.000 | 31.304 |
| 2 | Waiting time for tugs boat/ local pilot (X2) | 3.667 | 9.565 | 3.000 | 28.696 |
| 3 | Berth waiting time (X3) | 3.667 | 9.565 | 2.000 | 19.130 |
| 4 | Berthing time (X4) | 4.333 | 11.304 | 2.333 | 26.377 |
| 5 | Effective loading and unloading time (X5) | 4.333 | 11.304 | 3.000 | 33.913 |
| 6 | Quality of service of berthing time (X6) | 4.667 | 12.174 | 2.333 | 28.406 |
| 7 | The number of pilot ships needed (X7) | 4.667 | 12.174 | 3.333 | 40.580 |
| 8 | The number of tugs boat needed (X8) | 4.333 | 11.304 | 2.333 | 26.377 |
| 9 | Quick response of officers over user's complaints (X9) | 4.667 | 12.174 | 3.333 | 28.406 |
| ∑ | 38.333 | 100.000 | 23.667 | 263.188 | |
3. RESULTS AND DISCUSSION
Existing operational service performance is calculated based on users’ satisfaction level using the Customer Satisfaction Index (CSI) method. The responders to the questionnaire were separated into two groups: expedition companies and shipping companies. The population used in this study was 28 companies with an office in Kupang City, of which 4 of them were shipping companies, and the rest 24 were expedition companies. Each representative of the company was asked to fill in the questionnaire with a Likert Scale to judge the service level of operations in Tenau Container Port, as shown in Tables 2 and 3. Based on the result of the interview and questionnaire, the CSI value can be calculated using the following steps (e.g., In the groups of expedition companies, for quality and time length of processing the load and unload documents):
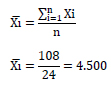
(a) Determine the Mean Importance Score (MIS) or
 |
(11) |
Y1 variable is used with ∑Y1 = 83 and n = 24. Where ∑Y1 is the total score for Y1 on the satisfaction variable and n is the total sample of 24 respondents
 |
(12) |
 |
(13) |
(b) Determine Weight Factors (WF)
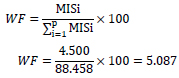 |
(14) |
(c) Determine Weight Score (WS)
 |
(15) |
The analysis results for all variables to obtain CSI values are shown in Tables 2 and 3. Then, the CSI value of expedition company groups can be calculated as follows:
 |
(16) |
Analog to step above, then the CSI value for shipping company groups can be calculated as follows:
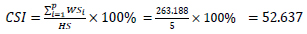 |
(17) |
Based on the CSI analysis results above, it can be interpreted that the level of service user satisfaction related to processing the container, according to the expedition companies, is 69.624 (Satisfy). For ship services, however, according to the shipping company, the CSI score is 52.637 (Quite Satisfy).
The subsequent analysis is the Importance Performance Analysis (IPA), which determines variables/attributes have a high level of importance, but a low level of performance according to port service users' perceptions. The results are obtained in a Cartesian diagram, as shown in Fig. (4) for expedition companies and Fig. (5) for shipping companies.
Fig. (4) shows several attributes of operational services in quadrant I that must get significant attention because they have a high importance level but low performance. Based on the expedition companies' group, attributes in quadrant 1 are (1) productivity and speed of loading and unloading containers (X8), (2) performance level of loading and unloading labor (X9), (3) condition of container loading and unloading equipment (X10), and stacking field conditions and capacity (X14). All these four variables are frequent in the Tenau Container Port of Kupang. The common problem is sometimes interrelated. For example, suppose old equipment is damaged, and the operator fails to work well, while the number of equipment is limited, and even the stacking field area is restricted. In that case, the performance of the container port will be much lower.
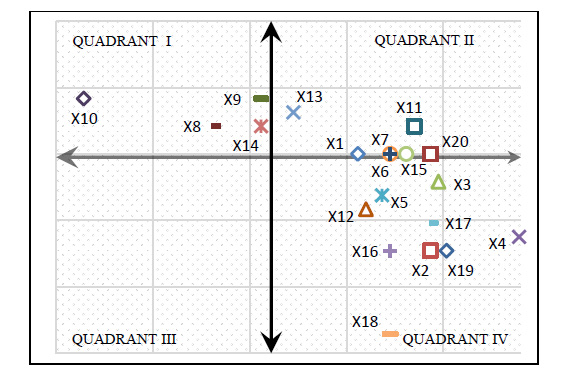
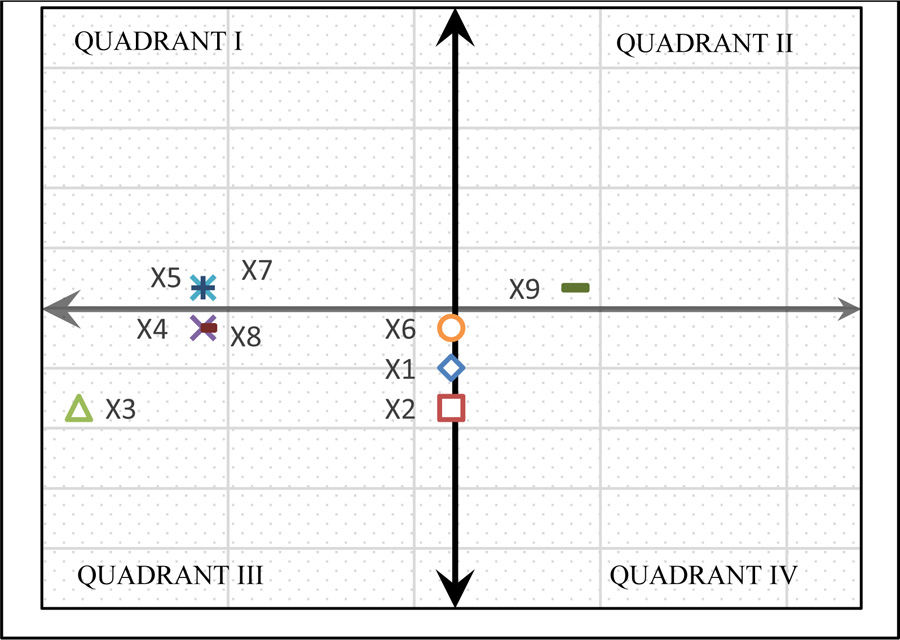
Fig. (5) shows the opinion of shipping companies on shipping services in Tenau Container Port of Kupang. The attributes included in quadrant I are effective loading and unloading time (X5) and the number of pilot ships needed (X7). Based on the survey conducted, the length of time for loading and unloading containers from ships to container yards and from container yards to trucks depends on the loading and unloading equipment's condition. The condition of the equipment that is often significantly damaged affects the loading and unloading process. Furthermore, the limited number of licensed pilot ships at Tenau Container Port has made ineffective ship access time to berth position.
Based on Importance Performance Analysis (IPA), the service variables included in quadrant I will become the input data for Quality Function Deployment (QFD) analysis. These attributes are:
(a) Productivity and speed of loading and unloading containers (X8),
(b) The performance level of loading and unloading labor (X9)
(c) Condition of container loading and unloading equipment (X10)
(d) Stacking field conditions and capacity (X14)
(e) Effective loading and unloading time (X5)
(f) The number of pilot ships needed (X7)
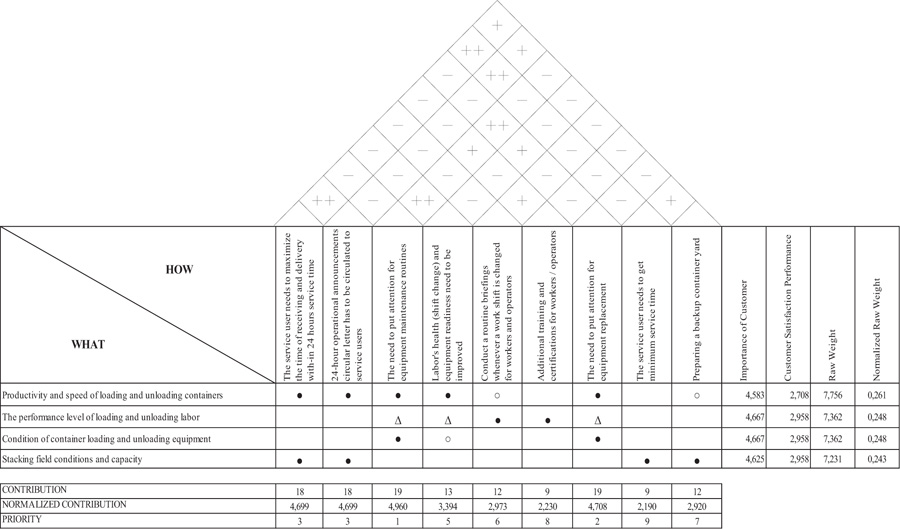
The next step is using the attributes as a question to get the technical response/answers submitted at the voice of the customer stage to the management (PT. Pelindo III Kupang). The respondents' answer was then analyzed in the following steps of forming a House of Quality (HOQ) (Table 4), using the attributes X8 and X9 as an example).
| NO | Voice of Customer | Customer Satisfaction Performance | Importance to Customer | Goal | IR | RW | NRW |
|---|---|---|---|---|---|---|---|
| 1 | Productivity and speed of loading and unloading containers (X8) | 2,708 | 4,583 | 4,583 | 1,692 | 7,756 | 0,261 |
| 2 | The performance level of loading and unloading labor (X9) | 2,958 | 4,667 | 4,667 | 1,577 | 7,362 | 0,248 |
The House of Quality analysis for attributes in Table 4 will be explained as a result. The Customer Satisfaction Performance and Importance to Customer value are taken from the IPA analysis results, namely the MIS value and the MSS value. At the same time, the goal value is obtained from the highest value between customer satisfaction and importance to customer. In this case, importance to customer value is taken. Improvement Ratio (IR) is obtained by dividing the goal value with customer satisfaction performance value. Then, the raw weight value is obtained by multiplying the goal and improvement Ratio. Finally, Normalized Raw Weight (NRW) values are taken from dividing Raw Weight (RW) value with the total RW value (Fig. 6).
The relationship between technical responses and service users' needs is explained by a matrix called the relation matrix. Four symbols of relation are used to determine the relation as follows:
- − Strong relation is given a symbol of (●) with a weighted value of 9;
- − Sufficient relation is given a symbol of (○) with a weighted value of 3;
- − Weak relation is given a symbol of (Δ) with a weighted value of 1; and
- − No relation is given a symbol of () and a weighted value of 0.
The subsequent analysis forms a correlation matrix to describe the relationship between each technical response to get the overall decision. The symbol will also be used to determine the relationship as follows:
- − A negative relationship/no relationship is given a symbol of (-);
- − A positive relationship is given a symbol of (+);
- − A very positive relationship is given a symbol of (++).
Finally, all the stages of Quality Function Deployment (QFD) can be seen in the House of Quality (HoQ) shown in Figs. (6 and 7). The items in “What” explain the service variables included in Quadrant I, whereas the items in “How” explain PT Pelindo as Service Manager as a proposed solution.
Based on the analysis shown in Fig. (6) for expedition companies respondents, it can be determined that the priority for improvement in container handling operational services at the Tenau Container Port Terminal are:
1. The operator needs to pay attention to equipment maintenance routines.
2. The operator needs to pay more attention to equipment replacement.
3. The service user needs to maximize the time of receiving and delivery within 24 hours of service time.
4. 24-hour operational announcements circular letter has to be circulated to service users.
5. Labor's health (shift change) and equipment readiness need to be improved
6. Conduct a routine briefing whenever a work shift is changed for workers and operators.
7. Preparing a backup of container yard (expansion)
8. There is a need for additional training and certifications for workers/operators.
9. The service user needs to get minimum service time.
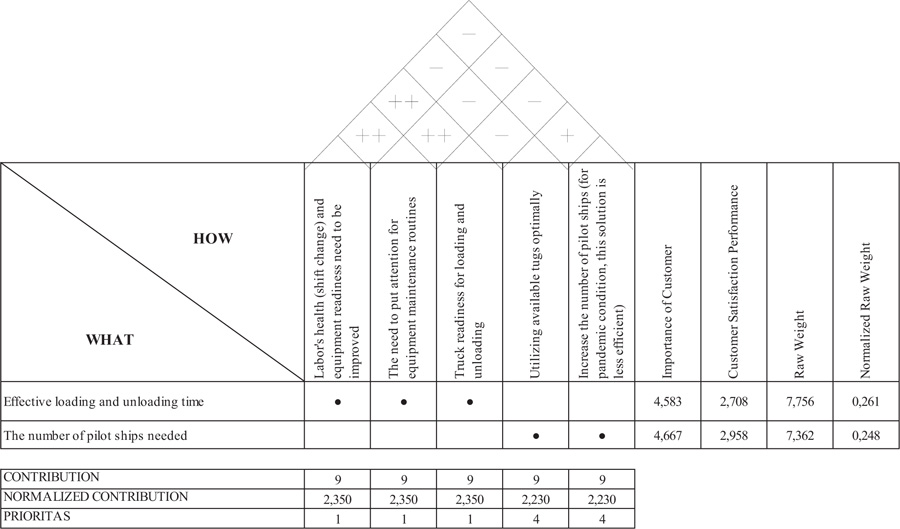
Fig. (7) for shipping companies respondent shows that the priority for improvement in ship handling operational services at the Tenau Container Port is:
1. Labor's health (shift-change) and equipment readiness need to be improved.
2. The operator needs to pay attention to equipment maintenance routines.
3. Truck readiness for loading and unloading
4. Utilizing available tugs optimally
5. Increase the number of pilot ships (for pandemic conditions, this solution is less efficient).
This study shows that the most influential factor on port performance and customer satisfaction are (1) the equipment condition and readiness, (2) container yard capacity, (3) truck readiness, and (4) human resource. Similar problems are also shown by other studies on 53 ports in Vietnam. It is observed that almost all Vietnam port efficiency is relatively low because of pure technical inefficiencies, namely technical skill, growth strategies and resource allocation, port capacities, and infrastructure to access the hinterland [6].
On the contrary, there are some different issues shown by several studies conducted in other countries. Research in South Korea shows that common service user satisfaction determinants are: management, image, and corporate responsibility factors [7]. These three factors are important in South Korea but not the primary performance factors evaluating ports in other countries, including the Tenau container port's study location in Kupang. Another research carried out at Dar Es Salaam and Mombasa ports in East Africa shows that logistics costs or prices of imports and exports in East Africa are higher [8]. This happens due to these two ports' competition practices, which encourage port authorities to over-develop the terminal capacity. Ultimately, it becomes difficult to achieve customer satisfaction with a low willingness to pay for logistics costs. The other research conducted at container ports along the “Maritime Silk Road” shows that rapidly developing container ports impact environmental pollution, so the problem focuses on reducing carbon emissions and pollution [9]. Then, research conducted in five container ports in Myanmar shows that port performance determinants are directly related to Total Container Throughput. The recommendation is to increase the pier's length and the total number of ship calls per year [10]. Labor, database management, digital technologies, infrastructures, investment, and customer attractions are the maritime field's existent trials. In Vietnam, same with Kupang in this study, human resources are lacking and are weak in quality; human resource structure is unbalanced. The lack of synchronous infrastructures is also an enormous challenge for all industries in the general and navigational fields in particular [11]. Mustafa researched container ports in the Asian and Middle East regions, concluding that a busy and efficient port is subjected to modern technology, adequate resources, and management. Besides, ports' success and efficiency are associated with significant business markets, better hinterland connectivity, a vital part of the country, and good resource management [12]. Finally, Rizal's research has tried to apply the Genetic Algorithm for Optimization of Container Crane at the Containers Terminal of Surabaya [13]. Such analysis in the future can also be used to the Tenau Container Terminal Port of Kupang to improve the operation of container crane equipment.
CONCLUSION
This study aims to evaluate and improve the quality of service at the Tenau port terminal using three different methods, namely IPA, QFD, and CSI. From the data analysis and results of this study, several things can be concluded
Customer Satisfaction Index (CSI), this method shows that the level of service expedition companies respondent's satisfaction related to operational services for containers obtained a CSI score of 69.92%, which was declared “Satisfied.” According to the shipping company, a CSI score of 52.63% for ship services was reported as “Quite Satisfisfied.”
Subsequently, Importance Performance Analysis that has been done in this study shows that there is some improvement needed; these are (a) productivity and speed of loading and unloading containers; (b) performance level of loading and unloading labor; (c) condition of container loading and unloading equipment; (d) stacking field conditions and capacity; (e) effective loading and unloading time; and (f) the number of pilot ships needed.
Afterward, QFD analysis on the priority of container operational services at Tenau Container Port Terminal towards the need of expedition companies respondent shows that the short-term improvement priority is (a) The necessity of paying attention to routine equipment maintenance; (b) The need to put more attention to equipment replacement; (c) The service user's needs to maximize the time of receiving and delivery with-in 24 hours service time; (d) 24-hour operational announcements circular letter has to be circulated to service users; (e) Labor's health (shift change) and equipment readiness need to be improved; (f) a routine briefing whenever a work shift is changed for workers and operators should be done; (g) a backup of container yard (expansion) needs to be prepared; (h) Additional training and certifications for workers/operators; and (i) The service user needs to get minimum service time. Furthermore, QFD analysis on the priority of ship handling operational services at Tenau Container Port towards the need of shipping companies respondent shows that the short-term improvement priority is (a) Labor's health (shift-change) and equipment readiness need to be improved; (b) The need to put attention to equipment maintenance routines; (c) Truck readiness for loading and unloading, (d) Utilizing available tugs optimally, and (e) Increasing the number of pilot ships (for pandemic condition, this solution is less efficient).
Further studies suggest replicating observation and analysis for other container ports in Indonesia, especially for medium-sized container ports. With more port locations to study, it will be easier for the Directorate of Sea Transport to identify low-level container terminal service symptoms and improve them, integrated with other aspects for future container terminal port development in Indonesia.
CONSENT FOR PUBLICATION
Not applicable.
AVAILABILITY OF DATA AND MATERIALS
Not applicable.
FUNDING
None.
CONFLICT OF INTEREST
The authors declare no conflict of interest, financial or otherwise.
ACKNOWLEDGEMENTS
Sincere thanks to Putri Dwi Kinanti D for data collection and statistical analysis.

