All published articles of this journal are available on ScienceDirect.

Horizontal Collaboration among SMEs through a Supply and Distribution Cooperative
Abstract
Introduction:
The 2030 Agenda for Sustainable Development encourages the governments of low and middle-income countries to support specifically small and medium enterprises to reach sustainable economic conditions. Strategic collaborative alliances among small and medium enterprises help these companies to overcome difficulties confronted in supply chain processes, such as procurement and transportation. This study describes a horizontal collaboration among small and medium enterprises (i.e., customers) where the demands are satisfied by a supply and distribution cooperative in Turkey. The cooperative is responsible for making bulk purchases with a discounted price that is not attainable for individual customers and making product deliveries to the customers. The benefits of establishing a supply and distribution cooperative that involves horizontally collaborating customers are assessed through a proposed decision support model.
Methods:
The model comprises a dynamic programming-based heuristic to determine a distribution plan and simulation to calculate total cooperative profit and customer profit shares. The model incorporates a comprehensive energy estimation approach for conventional vehicles that allows decision-makers to better estimate fuel consumption and, therefore, transportation emissions.
Results and Discussion:
The results show that horizontal collaboration among customers does not always guarantee profit. The amount of financial gain is dependent on many factors, such as logistics network, monetary demands, or discount rate observed due to the bulk purchase of the cooperative. Furthermore, such strategic alliances could allow companies to improve the efficient use of resources to have sustainable logistics systems.
Conclusion:
The proposed model can be used (i) to provide a detailed evaluation of the related costs and revenues, (ii) to provide analyses of the effects of the discount rate and the sector demand rate changes on the total cooperative profit, and (iii) to analyse the effects of uncertainties in several parameters on the total cooperative profit and customer profit shares.
1. INTRODUCTION
The 2030 Agenda for Sustainable Development introduced by United Nations is a call for nations worldwide to take action to end poverty, protect the environment, and increase prosperity [1]. Accordingly, the Sustainable Development Goals, also known as the Global Goals, were adopted by all United Nations member states in 2015, particularly aiming to support the development of low- and medium-income countries. Turkey has been on the World Bank’s medium-income countries list [2], and small and medium enterprises (SMEs) comprise more than 98% of Turkish companies [1]. Governmental institutions aim to encourage SMEs to develop strategic alliances among supply chain actors to improve the efficiency of supply chain processes, such as procurement and transportation. Establishing supply and distribution cooperatives where customers are involved in horizontal cooperation is one of the action plans taken by decision-makers. In the sharing economy, the logistics service market can smoothly facilitate the exchanges of goods or services by collaboration [2, 3]. Collaborative cooperation exploits win-win situations among either competing or unrelated suppliers, manufacturers, retailers, customers, or logistics service providers [4].
There are several types of collaboration, including horizontal, vertical, and mixed collaboration. Vertical and horizontal collaborations are widely applied cooperation strategies in supply chain management. Vertical collaboration involves two or more companies operating on different levels of the supply chain (e.g., a cooperation between a manufacturer and a retailer); horizontal collaboration, however, focuses on the partnership among several companies operating on the same level of the supply chain (e.g., cooperation between two suppliers) [5]. Horizontal logistics collaboration is the practice where all actors work together to accomplish a predefined goal and increase the efficiency of the supply chain [6]. Another sort of collaboration used to improve logistics and marketing performance in SMEs is family distribution networks, in which a member can control the decision factors for the marketing strategies of other members, and the ties are intended as a familial link. The capacity to organize like a family on topics like mutual trust, information exchange and economic assistance is provided via family distribution networks [7]. The followings are the different forms of collaboration in SMEs: network, cluster, strategic alliance, joint venture, export consortia, and strategic marketing alliance [8].
Basic organizational skills are necessary for enhancing cooperation capacity and ensuring long-term supply chain management. A crucial organizational talent that is important in the sustainability of collaboration is the desire to renew operational procedures, create and negotiate common goals, and exchange information among stakeholders [9]. Information sharing, resource sharing, goal alignment, decision reconciliation, collaborative communication, and the establishment of shared knowledge are all required for efficient supply chain cooperation [10]. For instance, policies for win-win cooperation strategies among large companies and SMEs can be developed by sharing information and technology [11]. Cooperation efficiency enhanced by improved collaboration can be measured by metrics like product variety, response time, and delivery time [12].
Our paper concentrates on horizontal logistics collaboration. Horizontal logistics collaboration among supply chain actors is regarded as an important instrument that enables non-value-adding costs elimination, bargaining power improvement, risk mitigation, and market position protection, along with several other benefits, such as higher vehicle capacity utilization and productivity, lesser empty backhauls, better customer service levels [4, 13-15]. Moreover, the use of horizontal collaboration also contributes to reducing environmental and social externalities by decreasing the density of traffic flow with the reduced number of vehicles, and accordingly, greenhouse gas emissions or improving utilization of logistics resources [16, 17].
In horizontal collaboration, supply and distribution cooperatives can provide a variety of products for their members (i.e., customers) [18] and transport these products to the members with reduced trip lengths [19]. Supply and distribution cooperatives have the potential to support the logistics operations of SMEs by (i) employing internet-based software in transportation [20], (ii) allowing direct sales to customers [21], (iii) increasing the market share of a company in foreign markets [22], and (iv) promoting cross-sector cooperation among companies [23]. Using logistics resources effectively is essential for SMEs. Increased competition and limited financial resources lead to SMEs collaborating with each other to sustain a competitive advantage under the current dynamic business environment. Horizontal collaboration provides various competitive advantages for SMEs in supply chain management, such as integrating companies into the uncertain market environment [24], sharing information rapidly among actors [25], improving financial performance [26], and developing a sustainable distribution channel [27]. Companies usually expect a remarkable cost reduction while entering a horizontal logistics partnership [28]. The transportation cost is often the highest logistics cost component for SMEs [29]. To avoid high transportation costs, unrelated or even competing SMEs cooperate to improve the efficiency of logistics operations [30]. Horizontal collaboration allows SMEs to make savings in purchasing and transportation costs as well [31]. SMEs involved in cooperative purchasing expect to decrease procurement-related costs and benefit from reduced prices by bulk purchasing [32, 33].
The current paper describes a horizontal collaboration among SMEs (i.e., customers) in Turkey, where the demands are satisfied by a supply and distribution cooperative. A governmental institute encourages SMEs to be part of a distribution network that is controlled by the supply and distribution cooperative. The cooperative is responsible for making bulk purchases with a discounted price that is not attainable for individual customers and making product deliveries to the customers. This study proposes a decision support model that can be used to assess the benefits of establishing a supply and distribution cooperative where SMEs are involved in horizontal cooperation. The model can determine a distribution plan and calculate both total cooperative profit and customer profit shares. The model incorporates a comprehensive energy estimation approach for conventional vehicles that allows decision-makers to better estimate fuel consumption and, therefore, transportation emissions. The numerical analyses demonstrate the benefits that could be obtained through the proposed model.
The rest of the paper is structured as follows. Section 2 provides a review of the relevant literature to demonstrate the contribution of the research. Section 3 presents a formal description of the addressed problem. Section 4 presents the mathematical formulation of the proposed decision support model. The computational analyses are presented in Section 5, and the study is concluded in Section 6.
2. LITERATURE REVIEW
Horizontal collaboration among companies can be considered an effective practice to improve efficiency in the transportation operations of a supply chain. Horizontal collaboration, compared to vertical collaboration, has received relatively low attention in logistics literature [13]. However, academic interest in horizontal logistic collaboration has increased with the papers published in recent years. The number of qualitative studies on the topic is relatively limited. Among these qualitative attempts, Buijs and Wortmann (2014) examined information technology applications available in collaborative transportation [34], Rodrigues et al. (2015) investigated the interaction between supply chain management and horizontal collaboration using a Delphi approach [35], and Martin et al. (2018) proposed a decision framework and a new topology to classify horizontal alliances in logistics [36]. Quantitative studies, on the other hand, particularly focus on network design [37, 38], routing [5, 39], and problems in collaborative logistics.
Aloui et al. (2021) studied horizontal collaboration among suppliers in a green logistics network design problem [17]. They proposed a bi-objective Mixed Integer Linear Programming model to evaluate collaborative and non-collaborative scenarios. There exist location, inventory and routing decisions in a two-echelon supply chain setting. The proposed model allows determining trade-offs between economic and environmental objectives. Peng et al. (2021) proposed a two-stage stochastic programming model, which involves production-inventory-distribution decisions to assess risk mitigation strategies [40]. The results showed that risk mitigation strategies allow traditional and horizontal collaborative systems to improve their performance in terms of cost and service level [41]. Giallombardo et al. (2021) investigated two mathematical models. The first model addresses an agricultural company that needs to make harvesting, storage, and distribution decisions for perishable products. The second model examines a horizontal collaboration for the distribution phase, which enables cost savings [42]. Mrabti et al. (2021) investigated a challenge with a cooperative 4.0 distribution network problem considering sustainability. They propose mono and multi-objective optimization approaches to evaluate collaborative and noncollaborative scenarios. The NSGA-II algorithm and the ε-constraint approach were used to solve the suggested model. In cooperative distribution networks, they offer a framework for the use of blockchain and the Internet of Things [43]. Karam et al. (2021) presented a fuzzy Delphi method and an analytical hierarchy process to examine the critical horizontal transport collaboration barriers in five categories [44]. These categories are as follows: (i) horizontal logistics collaboration organization-related (e.g., lack of governance agreements, lack of a coordinator, finding suitable partners etc.), (ii) information quality-related (e.g., lack of timely information updates, lack of real-time information etc.), (iii) behaviours and attitudes-related (e.g., failing to keep a commitment, uncertainties about the business future etc.), (iv) collaborative decision support system-related (e.g., unreliable profit/cost-sharing formula, inefficient collaborative planning algorithms etc.), and (v) market and business-related barriers (e.g., legal barriers to collaboration, regional imbalances of freight movement etc.) For interested readers, several surveys published on the topic could be useful to have an overview of the related literature [13, 45, 46].
As our focus is on quantitative studies with milk-run distribution applications, we have searched for the articles indexed by the Web of Science (WOS) Core Collection database with the keywords, “horizontal collaboration”, “horizontal cooperation”, “routing” and “logistics” in the “topic” field. Table 1 presents the summary of reviewed studies on the related literature.
| S.No | Article | Problem Type | Model Type | Objective Type | HC Type | HC Partners | Uncertain Component | Sustainability Concerns | Refs |
|---|---|---|---|---|---|---|---|---|---|
| 1 | Krajevska et al. (2008) | PDPTW | Heuristic | Profit | Shared transportation | Shippers | - | - | [47] |
| 2 | Lozano et al. (2013) | VRP | MILP | Cost | Shared transportation | Shippers | - | - | [48] |
| 3 | Wang and Kopfer (2014) | PDPTW | LNS-based Heuristic | Profit | Shared transportation | Shippers | - | - | [49] |
| 4 | Adenso-Dἰaz et al. (2014) | VRP | QIP | Cost | Shared transportation | Shippers | - | - | [39] |
| 5 | Pérez- Bernabeu et al. (2015) | MDVRP | Heuristics | Cost | Shared transportation | Shippers | - | E | [50] |
| 6 | Defryn et al. (2016) | SVRP | MIP | Cost | Shared transportation | Shippers | - | - | [51] |
| 7 | Kaewpuang et al. (2016) | CVRPTW | ILP.SP | Cost | Shared transportation | Shippers | D | - | [52] |
| 8 | Molenbruch et al. (2017) | DARP | ILP | Cost | Shared transportation | Shippers | - | - | [53] |
| 9 | Munoz-Villamizar et al. (2017) | MDCVRP | MILP | Distance | Shared transportation | Shippers | D | E | [54] |
| 10 | Ouhader and El Kyal (2017) | 2E-LRP | MO-MILP | Cost-Emission-Social impact | Shared location- transportation | Suppliers | - | E | [55] |
| 11 | Quintero-Araujo et al. (2017) | MDVRP | Simheuristic | Cost | Shared location-transportation | Suppliers | - | E | [56] |
| 12 | Accorsi et al. (2018) | VRP | ILP | Cost | Shared transportation | Suppliers | D | - | [57] |
| 13 | Akyol and De Koster (2018) | VRPTW | MILP | Cost | Shared transportation | Shippers | - | - | [58] |
| 14 | Fernández et al. (2018) | SCC-VRP | MIP | Cost | Shared transportation | Shippers | - | - | [59] |
| 15 | Serrano-Hernandez et al. (2018) | CVRP | ABS | Cost | Shared transportation | Shippers | - | E | [60] |
| 16 | Soysal et al. (2018) | IRP | MILP | Cost | Shared transportation | Shippers | D | E-P | [5] |
| 17 | Wang et al. (2018) | CMCVRPSDP | Bi-MILP | Cost | Shared location-transportation | Shippers | - | - | [61] |
| 18 | Chabot et al. (2018) | CVRP | ILP | Cost | Shared transportation | Shippers | - | E | [62] |
| 19 | Fardi et al. (2019 | IRP | MIP | Cost | Shared location-transportation | Suppliers | D | - | [63] |
| 20 | Muñoz-Villamizar et al. (2019) | MDVRP | Mathematical | Cost | Shared location-transportation | Shippers | - | E | [64] |
| 21 | Nataraj et al. (2019) | LRP | Scenario-based | Cost | Shared transportation | Shippers | - | E | [65] |
| 22 | Quintero-Araujo et al. (2019) | LRP | ILP | Cost | Shared transportation | Shippers | - | E | [66] |
| 23 | Stellingwerf et al. (2019) | IRP | MILP | Cost | Shared transportation | Shippers | - | E | [67] |
| 24 | Vaziri et al. (2019) | VRP | MIP | Profit | Shared transportation | Shippers | - | - | [68] |
| 25 | Wen et al. (2019) | DVRPTW | MILP | Cost | Shared transportation | Shippers | - | - | [69] |
| 26 | Zhang et al. (2020) | CVRP.SCD | MILP | Cost-time-quality-reliability | Shared transportation | Shippers | - | - | [70] |
| 27 | Karels et al. (2020) | CVRPTW | Heuristic | Cost | Shared transportation | Carrier | - | - | [71] |
| 28 | Padmanabhan et al. (2020) | CCVRPPD | heuristic | Cost | Shared transportation | Carrier | - | - | [72] |
| 29 | Santos et al. (2021) | CVRPPD | Holistic-scenario based | Cost-fuel consumption-emission | Collaborative pick-up and delivery-collection- cross-docking | retailer-3 PL- producer | - | E | [73] |
| 30 | Gansterer et al. (2021) | CMDVRPPD | Heuristic | Cost | Shared transportation | Carrier | - | E-TC-N | [3] |
| 31 | Wang et al. (2021) | CMCVRP | Metaheuristic-scenario based | Profit | Shared transportation | Suppliers | - | - | [74] |
| 32 | Mancini et al. (2021) | VRPMP | Metaheuristic | Profit | Shared transportation | Carrier | - | - | [75] |
| 33 | The current study | CVRPSBA | RDP-Simulation | Cost | Shared transportation- Cooperative purchasing | Customers | DR-MDV-SDCR | E |
ABS: Agent-based simulation, Bi-MIP: Bi-objective mixed-integer programming, ILP; Integer linear programming, LNS: Large neighborhood search, MIP: Mixed-integer programming, MILP: Mixed-integer linear programming, MO-MILP: Multi-objective mixed-integer programming, QIP: Quadratic Integer Programming, RDR: Restricted dynamic programming, SP: Stochastic programming,
D: Demand, DR: Discount rate, MDV: Monetary demand variables, SDCR: Sector demand change rate, 3 PL: Third-party logistics provider E: Emissions, N: Noise pollution, TC: Traffic congestion, P: Perishability.
According to the review results, various vehicle routing problem variants have been addressed in the related literature. The considered papers generally focus on strategic (e.g., facility location problem) or tactical (e.g., vehicle routing, inventory routing, and customer allocation problems) planning decisions. The variants of the integer programming approach are widely used by researchers while formulating and solving problems. In these studies, horizontal collaboration involves shared transportation or shared location transportation to determine the optimal distribution network that minimizes total logistics costs. When the shared transportation strategy is employed, companies are encouraged to share vehicles and routes to satisfy customer demands. In the shared location-transportation case, companies consider the allocation of customers to the depot of each member in the network in addition to vehicles and route sharing.
The demand uncertainty has been addressed in several studies [5, 52, 54, 57, 63]. These studies employ simplistic or various statistical (e.g., normal, log-normal, parabolic, and uniform distributions) methods to estimate uncertain demand and analyse the effect of stochastic demand on distribution plans.
Sustainability is one of the key issues for researchers addressing logistics problems due to growing awareness. Transportation emission is the prominent driver considered in the reviewed studies. The study of Soysal et al. (2018) considered the perishability of goods to reduce food waste which can be regarded as an attempt to improve the sustainability of the logistics system [76]. Horizontal collaboration has been considered an effective approach to designing a sustainable distribution network. Most of the green studies examined the effect of horizontal collaboration on the emission amounts or emission costs. These studies reported that horizontal collaboration among companies (especially shippers or suppliers) enables a significant decrease in both emission amounts and emission costs of vehicles in the distribution network.
The reviewed studies focus particularly on horizontal collaboration among shippers or suppliers. Our brief literature review, however, reveals that no attempt exists for a sustainable Capacitated Vehicle Routing Problem (CVRP), where a supply and distribution cooperative makes bulk purchases and enables horizontal collaboration among customers. Therefore, this study contributes to the literature by (i) proposing a quantitative decision support model for the considered problem with various stochastic parameters and a general profit-sharing approach among the customers, (ii) demonstrating its applicability over three supply chains, and (iii) providing analysis on supply and distribution cooperative operations of small and medium enterprises.
3. PROBLEM DEFINITION
The studied problem is defined on a complete graph
Customer demands are denoted by
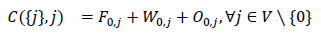
The supply and distribution cooperative costs comprise operating and distribution costs. The operating and distribution costs of the cooperative can be estimated. This study involves detailed calculations to estimate distribution costs.
Let
Apart from distribution plan and cost, a total cooperative profit and customer profit share have to be determined as well, according to the customers’ monetary demand, sector demand change rate (
4. A RESTRICTED DYNAMIC PROGRAMMING AND SIMULATION-BASED DECISION SUPPORT MODEL
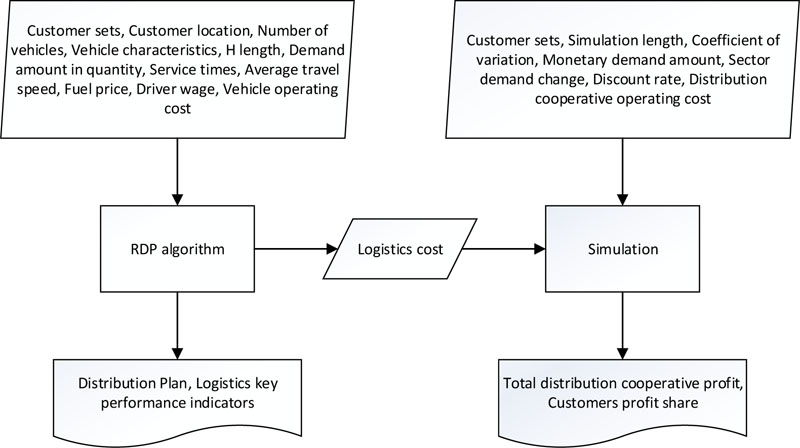
This section presents the proposed decision support model that can be used to assess the benefits of establishing a supply and distribution cooperative. The model is composed of two algorithms: (i) A Restricted Dynamic Programming (RDP) approach used to determine the distribution plan and (ii) A Monte Carlo Simulation used to calculate total cooperative profit and customer profit shares (Fig. 1). These algorithms will be introduced respectively in this section.
4.1. Restricted Dynamic Programming Algorithm
Bellman (1962) introduced the dynamic programming (DP) algorithm for the Travelling Salesman Problem (TSP) that aims to find the least cost tour of a single-vehicle visiting each customer once [77]. The DP algorithm for the addressed CVRP here has been derived from the algorithm proposed by Bellman.
Let C(S,j) refer to the total cost of the partial route that starts from the depot (0) and visits all nodes existing in set S exactly once and ends in node j, given SCV\{0} and jϵS. The calculations of function C in each stage of the DP algorithm are as follows:
 |
(1) |
 |
(2) |
 |
(3) |
where
To implement the introduced DP algorithm to the CVRP, a transformation operation needs to be carried out, as suggested by Christofides and Eilon (1969) [78]. The transformation requires replacing the real depot with the
The DP algorithm constructs a route for a single active vehicle at any point in time, which means that vehicle routes are determined one by one [82]. The additional load-related state dimension value is updated after each node visit according to the customer demand. For the dummy depots visit, the load state dimension is set to its initial value (0) since vehicles depart from dummy depots as empty. Two conditions have to be met before a node addition to a partial tour. First, the active vehicle should have sufficient capacity to satisfy the node demand. Second, active and unused vehicles should have sufficient capacity to satisfy the total demand of unvisited customers. The value of the other time-related state dimension is updated after each node visit according to the corresponding service and travelling times. For the dummy depots visit, the time state dimension is set to the starting time of the delivery operations.
Exponential storage and computational time requirements render the DP algorithm infeasible for large-sized instances [83]. We followed the RDP logic suggested by Gromicho et al. (2008) to implement the proposed DP algorithm on larger routing problems [79]. The RDP approach proposes to visit only the limited amount of promising (H most promising in terms of cost) and available customers at each stage rather than visiting all available customers. The operations performed at each stage of the RDP algorithm are briefly summarized below:
(1) Identify new nodes (customers) that can be added to the tour at this stage by considering the nodes visited already in the previous stages, note that each customer needs to be visited once,
(2) Calculate the total costs for partial tours (
(3) Put states in ascending order according to their costs,
(4) Choose H states with the lowest costs,
(5) At the following stage, proceed only by considering the selected H states,
(6) If all nodes are visited, calculate the total cost of the complete tour and end the algorithm. If not, return to the initial step.
The RDP algorithm does not guarantee to find the optimal solution since all states are not evaluated at every stage; however, the RDP logic eliminates the exponentially increased storage and time requirements of the DP algorithm.
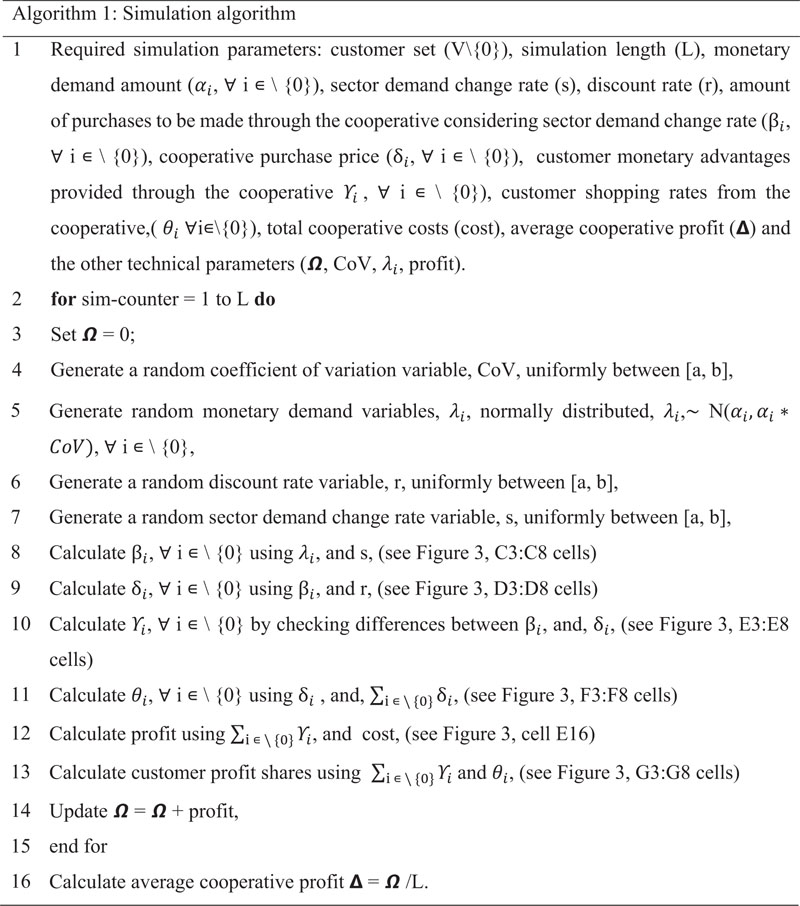
4.2. Simulation Algorithm
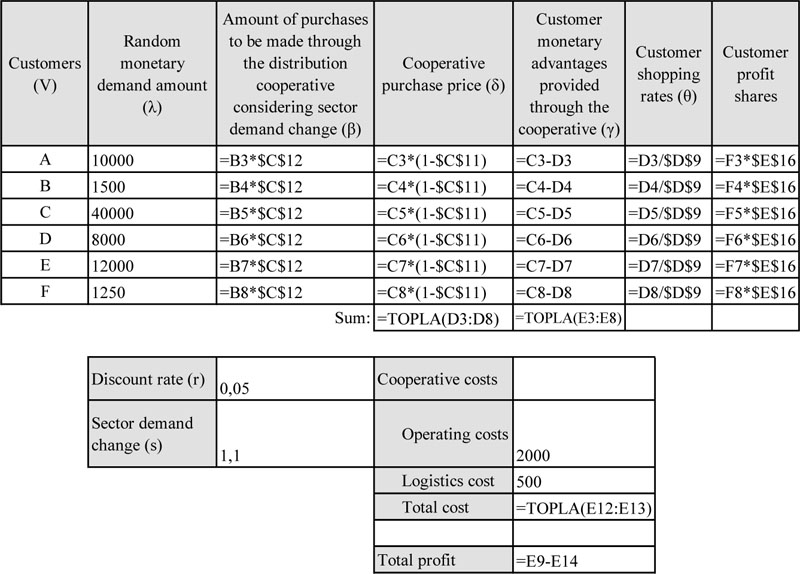
The logistics cost required for the monte carlo simulation algorithm is calculated by means of the introduced RDP algorithm (Fig. 1). Figs. (2 and 3) present the description and calculations involved in the simulation algorithm. Fig. (3) demonstrates simulation calculations over a small-sized problem.
The equation given in cell E16 of Fig. (3) calculates cooperative profit for a single iteration of the simulation algorithm. The simulation algorithm considers the uncertainty that can be confronted in the discount rate, sector demand change rate, and monetary demand variables. The next section provides the numerical analyses of different applications.
5. COMPUTATIONAL ANALYSES
This section presents the application of the proposed decision support model on the distribution operations of grocery, manufacture and trade of cosmetics, and ironmongery supply chains operating in Turkey.
C++ programming language has been used to develop and solve the DP and simulation algorithms for the experiments. We have used a computer of Intel(R) Core(TM) i7-7700K CPU @ 4.20GHz, 4200Mhz with 8 GB memory.
Eight logistics Key Performance Indicators (KPIs) have been defined to evaluate the performance of different distribution plans, such as (i) total travelled distance, (ii) total emissions, (iii) total fuel consumption, (iv) total travel time, (v) total fuel cost, (vi) total driver wage, (vii) total vehicle operating cost, and (viii) total distribution cost. In addition to these logistics KPIs, cooperative operating cost, total cooperative cost, and customer profit shares are the indicators used to assess the performance of a supply and distribution cooperative.
5.1. Data Description
Three problems from different sectors are addressed. Table 2 presents summary information about the problems.
| Application | Sector | No. of Customers | No. of Vehicles |
|---|---|---|---|
| P1 | Grocery | 79 | 2 |
| P2 | Manufacture and trade of cosmetics | 248 | 7 |
| P3 | Ironmongery | 677 | 17 |
In the applications, it is assumed that two types of cargo vehicles are used for distribution operations, heavy (Euro V diesel 3.5 - 7.5 tons) and light (Euro V diesel
The method suggested by Boulter et al. (2009) has been used in fuel consumption calculation. According to that approach, the total amount of emissions, E (g/km), after travelling one km at constant speed v (km/h) is calculated as follows:
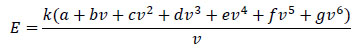 |
where,
To be used in distribution cost calculations (equations 1 to 3), fuel consumption, driver wage and vehicle operating costs are 7 TL/lt, 36 TL/hour and 5 TL/km, respectively. Customer locations and randomly generated demands and service times are presented in the supplementary Excel file.
5.2. Performance Comparison of Direct and Milk-run Distribution Alternatives
Under the assumption of direct distribution, the demands of customers are met through light vehicles. Vehicles leave the warehouse to visit a single customer on each route and return directly to the warehouse without visiting another customer after the relevant freight has been delivered. Table 3 presents the values of the KPIs under the direct distribution for each application.
| Key Performance Indicators | Problems | ||
|---|---|---|---|
| P1 | P2 | P3 | |
| Total travelled distance (m) | 98138.14 | 8469811.83 | 26857786.90 |
| Total emissions (kg) | 18.77 | 1619.92 | 5136.77 |
| Total fuel consumption (liter) | 7.14 | 615.94 | 1953.14 |
| Total travel time (sec) | 41224.66 | 490202.65 | 1513723.28 |
| Total fuel cost (TL) | 49.96 | 4311.57 | 13672.00 |
| Total driver wage (TL) | 412.25 | 4902.03 | 15137.23 |
| Total vehicle operating cost (TL) | 490.69 | 42349.06 | 134288.94 |
| Total distribution cost (TL) | 952.89 | 51562.66 | 163098.17 |
Under the milk-run distribution assumption, the demands of customers are met through heavy vehicles. Vehicles can visit more than one customer on each route and return to the warehouse after the related loads are delivered according to customer demands. Table 4 presents the values of the KPIs under the milk-run distribution for each application.
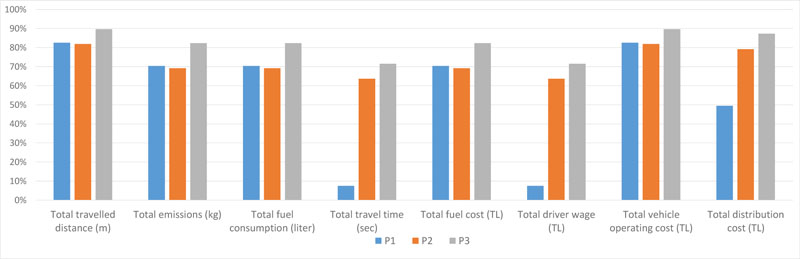
The results show that visiting more than one customer in a single route provides a significant advantage in terms of KPIs. Fig. (4) presents a comparison between the aforementioned distribution options. In terms of total distribution cost, the milk-run distribution enables to save approximately 50% to 90% in P1, P2 and P3 compared to direct distribution. Emissions and fuel savings are also significant, which contributes to pursuing logistics operations in a sustainable manner.
5.3. Customer Profit Shares under the Supply and Distribution Cooperative
This section presents evaluations related to the customer profit shares that could be attained under the supply and distribution cooperative. In the numerical analysis, the discount rate observed due to the bulk purchase of the cooperative is taken as 10%, and the sector demand change rate as 100%. The annual average monetary demand amounts of the customers are shown in the supplementary Excel file. For the problems, the customer annual demand amounts were created by choosing a random real number from the lower (12000 TL) and upper (30000 TL) boundaries from the uniform distribution.
The annual cooperative operating cost is taken as 120000 TL. It is assumed that all customers are visited once a week, and milk-run distribution is followed. Therefore, the distribution costs presented in Table 4 are accepted as weekly, and the total annual distribution costs are obtained by multiplying the relevant figures by 52 (weeks) (Table 5).
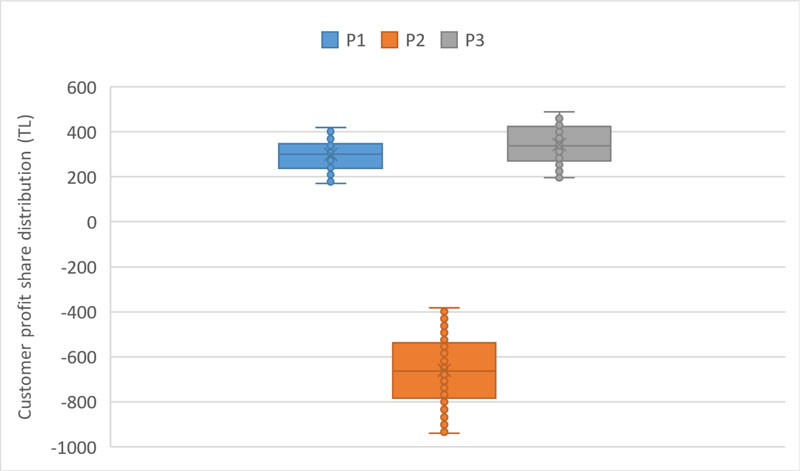
Fig. (5) shows the customer profit share distributions calculated for each problem. According to the results, the total profit obtained through cooperatives in P1 and P3 is 23614.7 TL and 232676.7 TL, respectively, while in P2, the total loss is -163547.9 TL. In P1 and P3, the average annual earnings for each customer are approximately 300 TL.
| Key Performance Indicators | Problems | ||
|---|---|---|---|
| P1 | P2 | P3 | |
| Total travelled distance (m) | 17098.65 | 1531186.94 | 2793075.25 |
| Total emissions (kg) | 5.57 | 498.81 | 909.90 |
| Total fuel consumption (liter) | 2.12 | 189.66 | 345.97 |
| Total travel time (sec) | 38137.98 | 178373.59 | 431021.02 |
| Total fuel cost (TL) | 14.83 | 1327.64 | 2421.78 |
| Total driver wage (TL) | 381.38 | 1783.74 | 4310.21 |
| Total vehicle operating cost (TL) | 85.49 | 7655.93 | 13965.38 |
| Total distribution cost (TL) | 481.70 | 10767.31 | 20697.37 |
| - | Applications | ||
|---|---|---|---|
| Key Performance Indicators | P1 | P2 | P3 |
| Total annual distribution cost (TL) | 25048.34 | 559900.28 | 1076263.31 |
| Total annual cooperative operating cost (TL) | 120000.00 | 120000.00 | 120000.00 |
| Total annual cost (TL) | 145048.34 | 679900.28 | 1196263.31 |
| Average annual cost per customer (TL) | 1836.0549 | 2741.533399 | 1767.006366 |
When the evaluation is made over the purchase amounts from the cooperative, the total benefit rate obtained for each customer is 1.4% for the P1 and 1.6% for the P3. This means that every actor who cooperates horizontally in the P1 provides a 1.4% benefit over individual direct-purchase amounts. For the P2, the average annual loss for each customer is approximately 650 TL, and this figure corresponds to a 3.2% loss for each customer, considering the purchase amounts.
The results reveal that although cooperative ensures a 10% discount rate by means of bulk purchase, customers in P1 and P3 applications gain relatively less due to the arising cooperative costs, while cooperation in P2 results in a loss. In the P2 application, the average annual cost per customer is relatively high for the establishment of a cooperative (Table 5), which results in a loss for the customers.
According to the results, collaboration among customers does not guarantee profit; the financial advantage is dependent on many factors, such as logistics network, monetary demands, or discount rate. The decision support model proposed within the scope of this study provides users with a detailed evaluation of the related costs and revenues.
5.4. Trade-off Analyses
This section presents analyses of the effects of the discount and the sector demand rate changes on the total profit obtained through the cooperative. First, the sector demand change rate is accepted as 100% for each problem, and the average discount rate from the bulk purchase varies between 1% and 40%. Then, the average discount rate is fixed at 10%, and the sector demand change rate varies between 80% and 120%.
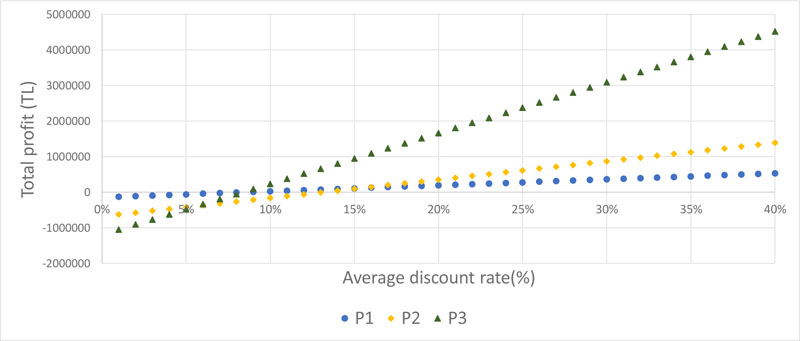
Fig. (6) shows the relationship between the average discount rate and the total profit for all three applications. The results show that in order to obtain profit from the cooperative at the 100% sector demand change rate, the average discount rate should be at least 9% in P1, at least 14% in P2, and at least 9% in P3. At the discount rates below these figures, the cooperation among customers will result in loss.
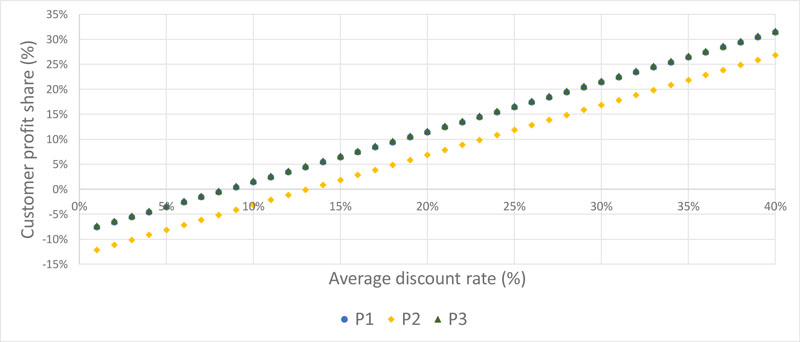
When the evaluation is made over the purchase amounts from the cooperative, the total customer profit shares for each customer at a 100% sector demand change rate with different discount rates are presented in Fig. (7). For instance, at the discount rate of 40% observed by the cooperative, customer profit shares are 31%, 27% and 32% in P1, P2 and P3 applications, respectively.
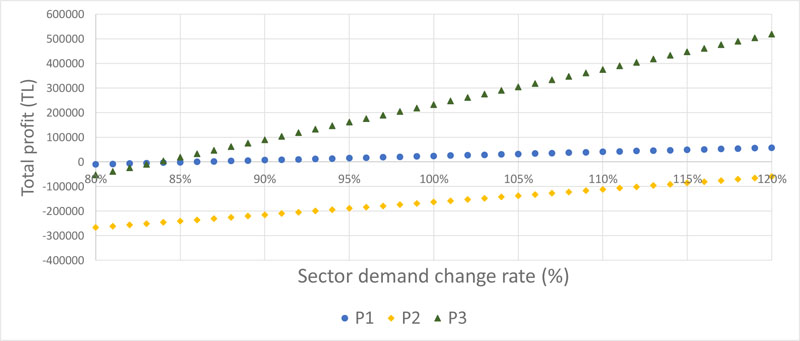
Fig. (8) shows the relationship between sector demand change rate and total profit for three applications. The results show that at the average discount rate of 10%, the sector demand change rate should be at least 86% in P1 and at least 84% in P3 in order to earn profit through the cooperative. These figures mean that even in case of demand shrinking of 14% (P1) and 16% (P3), small profit margins can be obtained in P1 and P3 applications. For the P2, even if the rate of demand change is 120%, it cannot prevent cooperative loss. This suggests that the average discount rate should be more than 10%, or the sector demand change rate should be higher than 132%, found as a result of linear regression analysis.
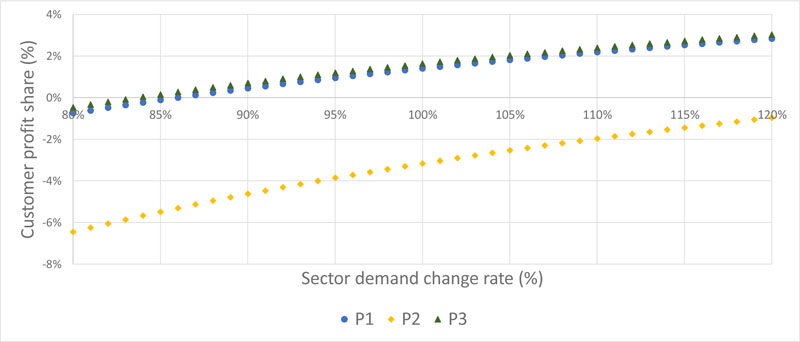
When the evaluation is made over the purchase amounts from the cooperative, the total customer profit shares for each customer at a 10% discount rate with different sector demand change rates are presented in Fig. (9).
5.5. Addressing Uncertainty with Simulation
In real-life applications, it is often difficult to know precisely the values of the parameters, such as the average discount rate provided by the cooperative from the collective purchase, the sector demand change rate, and the average customer demands. This section presents the results of the simulation analysis to reveal the benefits of collaboration among customers.
Simulation length (number of iterations) is taken as 10000. For each iteration, analyzes are made by selecting a random real number among the lower (0.01) and upper (0.2) boundaries from the continuous uniform distribution for the coefficient of variation (CoV) needed to create an uncertain demand (CoV = U (0.01,0.2)). The average discount rate lower and upper ratios required for the continuous uniform distribution are as follows: i) U (0.01,0.4), ii) U (0.2,0.4) and iii) U (0.01,0.4). The sector demand change rate lower and upper ratios required for the continuous uniform distribution are as follows: i) U (0.8, 1), ii) U (1, 1.2), and iii) U (0.8, 1.2).
| S1* | S2 | S3 | Average Customer Profit Share (TL) | ||||||||
|---|---|---|---|---|---|---|---|---|---|---|---|
| Discount rate | Sector demand change | Average profit (TL) | Average customer profit share (TL) | Average profit (TL) | Average customer profit share (TL) | Average profit (TL) | Average customer profit share (TL) | S1-S2 gap | S2-S3 gap | ||
| P1 | 1 | (0.01-0.2) | (0,8 - 1) | 14444.63 | 182.84 | 39302.05 | 497.49 | 159381.27 | 2017.48 | 172.1% | 305.5% |
| 2 | (0.01–0.2) | (1 - 1,2) | 51015.98 | 645.77 | 75052.68 | 950.03 | 193578.64 | 2450.36 | 47.1% | 157.0% | |
| 3 | (0.2 –0.4) | (0,8 - 1) | 309622.90 | 3919.28 | 336938.21 | 4265.04 | 455049.13 | 5760.12 | 8.8% | 35.1% | |
| 4 | (0.2 – 0.4) | (1 - 1,2) | 412335.15 | 5219.43 | 435946.61 | 5518.31 | 556359.36 | 7042.52 | 5.7% | 27.6% | |
| 5 | 0.01 –0.4) | (0.8- 1,2) | 198002.95 | 2506.37 | 227377.06 | 2878.19 | 343900.38 | 4353.17 | 14.8% | 51.2% | |
| P2 | 1 | (0.01–0.2) | (0,8 - 1) | -196361.30 | -791.78 | 368930.38 | 1487.62 | 489098.44 | 1972.17 | 287.9% | 32.6% |
| 2 | (0.01–0.2) | (1 - 1,2) | -84967.42 | -342.61 | 475187.04 | 1916.08 | 593613.46 | 2393.60 | 659.3% | 24.9% | |
| 3 | (0.2 – 0.4) | (0,8 - 1) | 717299.89 | 2892.34 | 1275707.12 | 5143.98 | 1395991.85 | 5629.00 | 77.8% | 9.4% | |
| 4 | (0.2 – 0.4) | (1 - 1,2) | 1023890.02 | 4128.59 | 1583143.20 | 6383.64 | 1702572.37 | 6865.21 | 54.6% | 7.5% | |
| 5 | 0.01 – 0.4) | (0.8- 1,2) | 367581.58 | 1482.18 | 933120.87 | 3762.58 | 1058791.23 | 4269.32 | 153.9% | 13.5% | |
| P3 | 1 | (0.01–0.2) | (0,8 - 1) | 151438.79 | 223.69 | 1230101.52 | 1816.99 | 1350734.95 | 1995.18 | 712.3% | 9.8% |
| 2 | (0.01–0.2) | (1 - 1,2) | 467630.06 | 690.74 | 1525492.55 | 2253.31 | 1645398.04 | 2430.43 | 226.2% | 7.9% | |
| 3 | (0.2 – 0.4) | (0,8 - 1) | 2654237.45 | 3920.59 | 3747641.91 | 5535.66 | 3864232.70 | 5707.88 | 41.2% | 3.1% | |
| 4 | (0.2 – 0.4) | (1 - 1,2) | 3524453.30 | 5205.99 | 4582267.45 | 6768.49 | 4720994.64 | 6973.40 | 30.0% | 3.0% | |
| 5 | 0.01 – 0.4) | (0.8- 1,2) | 1745327.16 | 2578.08 | 2826576.76 | 4175.15 | 2936567.41 | 4337.62 | 62.0% | 3.9% | |
The following three scenarios are addressed through simulation: (i) S1: The base case where logistics and cooperative operating costs are respected, (ii) S2: The case where only the cooperative operating cost is respected, and (iii) S3: The case where both costs are ignored. Table 6 presents the numerical analysis results for three applications.
The results provide insights into the average total cooperative profits and average profits per customer to be obtained by collaboration under uncertainty for different scenarios. The elimination of logistics costs ensures the most advantage in P2 and the least advantage in P1. The advantage of ignoring the cooperative annual operating cost in the P1, where the least number of customers exists among the three applications, is relatively high compared to the other applications. The elimination of the annual operating cost of the cooperative provides the least benefit in P3. The reason for this is that the cost in question is covered by more customers in the P3 application.
CONCLUSION
This study proposes a decision support model that can be used to assess the benefits of establishing a supply and distribution cooperative where SMEs are involved in horizontal cooperation. The model comprises a DP-based heuristic to determine a distribution plan and simulation to calculate total cooperative profit and customer profit shares. The numerical analyses of different-sized problems demonstrate the potential benefits of the proposed model.
Horizontal collaboration leads companies to share transportation requests and vehicle capacities. Therefore, companies decrease transportation costs, use resources efficiently by increasing capacity utilization, improve their profitability, alleviate the intensity of the traffic flow by reducing the number of vehicles, and help to limit gas emissions by vehicles. According to the results of the proposed model, horizontal collaboration among customers under the milk-run distribution assumption enables significant fuel and emission savings.
The results show that horizontal collaboration among customers does not always guarantee profit. The amount of financial gain is dependent on many factors, such as logistics network, monetary demands, or discount rate. The proposed model provides a detailed evaluation of the related costs and revenues. The model is also capable of providing analyses of the effects of the discount rate and the sector demand rate changes on the total cooperative profit. Moreover, the effects of uncertainties in several parameters on the total cooperative profit and customer profit shares can be analysed using the decision support model.
Those kinds of decision support models could contribute to the success of collaboration attempts, which is crucial for small companies' survival in the competition against the larger ones. Here, an operational problem has been addressed. However, such models can be derived for other supply chain decision problems as well as confronted at different levels. This study analyzes a one-to-many distribution system; a future attempt could be to address a many-to-many (more than a single depot and customers) network where additional warehouse capacity allocation decisions have to be managed.
LIST OF ABBREVIATIONS
| (SMEs) | = Small and Medium Enterprises |
| (DP) | = Dynamic Programming |
| (KPIs) | = Key Performance Indicators |
CONSENT FOR PUBLICATION
Not applicable.
AVAILABILITY OF DATA AND MATERIALS
The data sets used and/or analysed during this study are available from the corresponding author upon request.
FUNDING
None.
CONFLICT OF INTEREST
Mehmet Soysal is the associate editorial board member of The Open Transportation Journal.
ACKNOWLEDGMENTS
The authors acknowledge the support from the Republic of Turkey-Ministry of Trade Directorate General of Tradesmen, Craftsmen and Cooperatives for providing knowledge and expertise on the topic along with data for the studied problems.

