All published articles of this journal are available on ScienceDirect.

Examining the Severity of Traffic Barriers Crashes, Mixed Model with Observed Heterogeneity
Abstract
Introduction:
Due to the high involvement of traffic barriers in the severity of crashes, extensive efforts have been made to find factors to those crashes. In this study, the mixed logit model has been recognized and employed for modeling traffic barriers crash severity.
Methods:
The method has shown an improvement over the standard logit model, which assumed the impacts of predictors are fixed across crash observations. However, most past studies assume constant distributional means across various crash observations despite the efforts. In this study, the random parameter model was extended to incorporate the heterogeneity in the taste of random parameters based on other observed factors. The consideration addresses the limitation of the standard mixed model, constraining the random effect means to be constant across all observations. In this study, the heterogeneity in taste highlights a significant difference across subpopulations of barrier crash severity based on various factors. The results of the goodness of fit also highlight significant improvements in model fits, moving from standard logit to the mixed and the mixed models with heterogeneity in tastes.
Results and Discussion:
The results highlight that, for instance, the means of the random parameters of gender varies across crash population based on shoulder width, and average annual daily traffic (AADT), while the impact of the mean of the random parameter of AADT varies based on truck traffic.
Conclusion:
Driver's restrain condition, rollover type of crashes, posted speed limit, and citation record were some of the factors that their effects on the severity of crashes were found to be fixed.
1. INTRODUCTION
Traffic barriers have been identified as a measure to mitigate the severity of run of the road (ROR) crashes. However, while roadside crashes account for only 16% of all crashes in the U.S., a substantial proportion of those crashes are high-severity crashes [1]. In order to mitigate the severity of those crashes, extensive efforts have been made to identify contributory factors to those crashes in accurate ways.
One of the main shortcomings of the standard mixed model is that the method allocates a single random effect estimate for all barriers crash populations. While modeling crash datasets, accounting for that shortcoming is especially important due to a high amount of heterogeneity in the crashes due to much seen and unseen variations across observations.
Statistical methods have been undertaken to model factors to crashes while accounting for the data heterogeneity. For instance, mixed models have often been used to describe the behavior of individual observations [2].
While a driver characteristic such as gender might be random, that impact might be varied across observation based on some other observed covariates. For instance, female drivers might be more likely to drive under special road conditions, and thus the impact on the response might vary based on those factors. The impacts have been often called heterogeneity in means or coefficients [3] or heterogeneity in taste [4]. Not accounting for that impact might result in biased estimations of error terms and possibly biased parameters estimations.
Taste heterogeneity (TH) can be defined as variations in models’ random coefficients based on other explanatory variables across the population. It is compared to the standard random effects model, where there is a single random coefficient across all observations. Those models are especially popular in choice modeling or travel behavior.
For instance, a traveler's choice of choosing a specific type of travel mode, e.g., train or bus, might be influenced by random parameters of time of travel. On the other hand, the random parameter of time of travel itself might be impacted by other characteristics such as travelers’ income [5]. In this study, the heterogeneity in taste is used to possibly account for endogeneity bias resulting from various driver or environmental characteristics. For instance, taste heterogeneity as an alternative form of endogeneity bias was used for the evaluation of various factors on car ownership [6]. The importance of accounting for TH has been highlighted by a large body of studies in the literature [7]. It should be noted that the TH could be implemented in scenarios where the coefficients are fixed e.g [8] or random e.g [9].
The rest of this manuscript is organized as follows: the literature review presents some studies that applied methods to account for the heterogeneity in dataset observations. The methodology section discusses the mathematical formulation of the mixed model and mixed model with heterogeneity in taste. The data section outlines the dataset. Then, the results section and discussion will outline and discuss the results.
1.1. Literature Review
There is a vast body of literature review investigating factors to barriers crashes. This section first outlines few studies implemented to modeling barriers crashes using the standard mixed model, and then it outlines few studies in other areas implementing the mixed model with heterogeneity in taste.
The mixed model was used to model median barriers crash severity [10]. Collision with various barrier types and various types of slopes were some of factors that were found to impact the severity of barrier crashes. The severity of two-lane highway traffic barriers crashes was evaluated in another study using the mixed logit model [11]. Rollover crashes, side slope height, alcohol involvement, and road surface conditions were some of factors found to impact the severity of barriers crashes. Also, extensive studies in the literature review were implemented in other transportation problems while accounting for changes in the population distributions based on different factors.
The prevalence of observed and unobserved taste heterogeneity impacting the shipper’ mode choice behaviors was evaluated [4]. The results highlighted a significant amount of taste heterogeneity across shippers in relation to service attributes. In another study, modeling of exit choice behavior during crowd evacuation was evaluated. The nested logit (NL) model with heterogeneity in taste was compared with a standard MNL. The results highlighted a slightly better fit of mixed MNL [12].
Despite many studies, not many efforts have been made in the application of the mixed model while accounting for heterogeneity in taste for modeling traffic barriers crash severity. Especially, the literature review in the field of traffic safety lacks a comprehensive discussion of the endogeneity effect that could result from dependence across various drivers and roadway characteristics.
Thus, this study is conducted to employ the mixed model with heterogeneity in taste for modeling traffic barrier crash severity. The goodness of fit of the standard logit and mixed model will be compared to a modified mixed model to see if accounting for heterogeneity in taste is justifiable in terms of model’s goodness of fit improvement.
2. METHODS
The mixed model can be viewed as an extension of the standard logit model, where one of the main shortcomings of the standard logit model is that the model does not account for unobserved heterogeneity that might exist across observations. To address this issue, the mixed logit model is employed to account for heterogeneity across crashes by letting the impacts of predictors vary across observations. The standard mixed logit model could be achieved by assuming continuous heterogeneity (e.g., normal distribution), allowing parameters to vary across crashes [13]. However, the limitation of the standard mixed model is that the model only accounts for unobserved heterogeneity in the coefficients without clarifying how the heterogeneity in means might vary based on various coefficients or accounting for observed heterogeneity.
However, often assuming the independent means of random parameters might result in biased estimates as they ignore the underlying relationships between those factors (endogeneity). Modifications of the mixed model could be made to address possible interrelations across variables. One of the approaches is by allowing the random coefficient means to be dependent on observed characteristics of individuals [14].
The random parameter model could be written as:
 |
(1) |
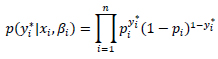
Where yi* is a realization of crash severity of observed individual crash i being independent, xi is the observed vector of covariates, and here εi is the error terms following logit distribution. The probability density function of yi* based on binary logit, could be written as:
 |
(2) |
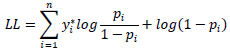
Where p is the cumulative distribution function (CDF), which could be written as Pi = exp(Y)/1+ exp(Y), γ is the sum of various coefficients to be estimated and related covariates. The log-likelihood, on the other hand, could be written as:
 |
(3) |
Where i is related to observation crash and n is the number of coefficients to be estimated. The above discussion is similar to the standard logit and the mixed logit model. The difference is that we have R number of attributes/columns to the number of draws and they will be summed up to the fixed parameters process, and the probability in 2 will be estimated for R number of columns.
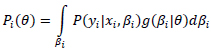
So, the probability is 3 over the value of βi, for instance, could be written as:
 |
(4) |
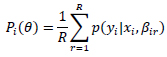
And with approximation through a random draw, the above could be written as:
 |
(5) |
Where the above is used in Equation 3 for creating the log likelihood.
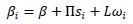
For random parameters of βi, the parameter varies based on each individual crash or individual-specific predictor, where the changes are based on the distribution function of g(βi|0). The random parameter in this study follows a normal distribution and we have:
 |
(6) |
Where ωi ~ N (0,1), and L is a diagonal matrix containing the standard deviation (δ) of the random parameters, and in case of incorporating the correlated random parameters, L includes the correlation on its off-diagonal elements. It is also intuitive that in case of having no random parameter, the (δ) of the model, or L, will be zero and the model turn into the standard logit model.
Also, it should be noted that here we accounted for observed heterogeneity to change βi based on some observed attributes so we have:
 |
(7) |
Where  is a matrix accommodating the parameters to be estimated, and si is the vector of related covariates.
2.1. Data
The descriptive summary of important variables, along with their categories, is provided in Table 1. The response has three categories: no injury, minor injury, and severe/fatal injury. Minor injury category includes possible injury and minor injury, while the severe injury includes fatality and incapacitating injury. This categorization was done due to a lack of observations for each individual category.
The dataset includes only traffic barriers in the Wyoming highway system, including crashes that hit a traffic barrier as the first harmful event. The data was collected from the Wyoming Department of transportation (WYDOT) through the critical analysis reporting environment (CARE) from 2007 to 2016. The variables are presented in 3 sections: response, binary and continuous predictor.
Both average annual daily traffic (AADT) and average daily truck traffic (AATT) were included after ensuring no multicollinearity concern across those two predictors. The results in Table 1 include the average, variance, and minimum and maximum of each variable. For instance, the mean of citation records is 0.46, indicating that almost half of all drivers had some traffic citations in their traffic records while involved in crashes.
| Variables | Average | Variance | Min | Max |
|---|---|---|---|---|
| Response | 0.29 | 0.21 | 0 | 1 |
| Binary Predictor | ||||
| Motorcyclist, non-motorcycle *(vs. motorcycle crashes) | 0.04 | 0.039 | 0 | 1 |
| Restrain condition, restrained drivers* (vs. unrestrained) | 0.12 | 0.106 | 0 | 1 |
| Rollover, non-rollover crashes* (versus rollover crashes) | 0.04 | 0.038 | 0 | 1 |
| Road surface condition, dry* (vs. non-dry) | 0.58 | 0.243 | 0 | 1 |
| Drivers were normal *(vs. drivers were under some emotional conditions) | 0.37 | 0.232 | 0 | 1 |
| Time of a day, non-pick hours* (vs. others) | 0.23 | 0.174 | 0 | 1 |
| Concert barrier, concrete barrier (vs. others*) | 0.06 | 0.052 | 0 | 1 |
| Citation record, drivers did not have any citation in their record* (vs. driver with at least a single citation record) | 0.46 | 0.249 | 0 | 1 |
| Continuous Predictors | ||||
| Shoulder width, ft | 4.65 | 10.402 | 0 | 58 |
| Posted speed | 51.89 | 297.36 | 20 | 70 |
| AADT | 4,320 | 24,081,454 | 95 | 31,402 |
| AATT | 295 | 51,057 | 7 | 1,260 |
| Standard Logit Model | Standard Mixed Model | Mixed Model with Heterogeneity in Taste | |||||||
|---|---|---|---|---|---|---|---|---|---|
| Est. | Std. Error | p-value | Est. | Std. Error | p-value | Est. | Std. Error | p-value | |
| Fixed Effects | |||||||||
| constant | -2 | 0.34 | <0.05 | -3.1 | 0.5 | 9.96E-10 | -3.6 | 0.28 | <0.05 |
| Roadway characteristics | |||||||||
| Shoulder width | 0.04 | 0.02 | 0.03 | 0.05 | 0.02 | 0.02 | 0.08 | 0.03 | <0.05 |
| ADTT | -6E-04 | 0.00037 | 0.08 | -0.00073 | 0.00044 | 0.1 | -0.00024 | 0.001 | 0.65 |
| Posted speed limit | 0.01 | 0.0046 | <0.05 | 0.02 | 0.01 | <0.05 | 0.02 | 0.00432 | <0.05 |
| Crash characteristics | |||||||||
| Rollover crashes | 2 | 0.3 | <0.05 | 2.29 | 0.36 | 0 | 2.2 | 0.34 | <0.05 |
| Motorcycle rider | 5 | 1.02 | <0.05 | 6 | 1.14 | 0 | 6 | 1.11 | <0.05 |
| Type of barrier as concrete | 0.4 | 0.28 | 0.15 | 0.73 | 0.37 | 0.05 | 0.61 | 0.32 | 0.05 |
| Road surface condition, non-dry as 1 | -0.6 | 0.14 | <0.05 | -0.83 | 0.18 | <0.05 | -0.78 | 0.16 | <0.05 |
| Driver characteristics | |||||||||
| Driver emotional condition | 0.9 | 0.14 | <0.05 | 1.15 | 0.19 | <0.05 | 1.1 | 0.17 | <0.05 |
| Citation record | 0.3 | 0.13 | <0.05 | 0.3 | 0.16 | 0.07 | 0.27 | 0.16 | 0.08 |
| Restrain condition | 1 | 0.18 | <0.05 | 1.4 | 0.23 | <0.05 | 1.3 | 0.21 | <0.05 |
| Random Effects | |||||||||
| Mean effects of random parameters | |||||||||
| Gender, female as 1 | 0.08 | 0.28 | 0.78 | 1.1 | 0.36 | <0.05 | |||
| Time of a day, off pick as 1 | ---- | ---- | ---- | -0.24 | 0.27 | 0.39 | -0.3 | 0.27 | 0.31 |
| AADT | ---- | ---- | ---- | 0.0000534 | 0.0000261 | <0.05 | 0.00017 | 4.19E-05 | <0.05 |
| Variable for heterogeneity in taste | |||||||||
| Gender~ AADT | ---- | ---- | ---- | ---- | ---- | ---- | -5.70E-05 | 3.2E-05 | 0.07 |
| Gender ~Shoulder width | ---- | ---- | ---- | ---- | ---- | ---- | -0.14 | 0.0533 | 0.01 |
| AADT~ Truck | ---- | ---- | ---- | ---- | ---- | ---- | -1.40E-07 | 8.41E-08 | 0.09 |
| SD of random parameters | |||||||||
| Gender | 1.52 | 0.618 | <0.05 | 1.1 | 0.421 | <0.05 | |||
| Time of a day | 1.78 | 0.597 | <0.05 | 1.9 | 0.581 | <0.05 | |||
| AADT | 0.0000824 | 0.0000379 | <0.05 | 0.00002 | 2.87E-05 | 0.5 | |||
| Goodness of fit parameters | LL=-770, AIC=1569 | LL=-765, AIC=1,564 | LL=-757, AIC=1,555 | ||||||
Here non-peak hours in Wyoming are defined as 10PM-6AM, compared with other times of the day. Drivers were considered restrained if they had any type of restraining such as lap belts. In addition, due to the significance of concrete barriers compared with other barriers, a binary version of that predictor was considered.
3. RESULTS AND DISCUSSION
The findings are presented in Table 2 in three subsections. The first section elaborates on the results of the fixed effects, followed by random effects in the second subsection. To compare the performances of different considered models, various goodness of fit measures were considered and included in Table 2.
3.1. Fixed Effects
Few predictors were found to have fixed effects on the severity of barrier crashes. The parameters have expected signs and are intuitive. The highest contributory impact to the barrier crash severity is related to motorcyclist involvement. That impact is mainly due to the lack of protection needed for a motorist to protect themselves while hitting barriers compared with other passenger cars. Extensive studies conducted highlighting motorcycle crashes are among the highest crash severity compared with other road users (Moomen et al., 2019).
The second highest contributory factor to severe barrier crashes is related to rollover type of crashes, followed by restraining condition. The drivers involved in traffic barrier crashes without the use of safety restrains are more likely to be injured or killed in crashes than constrained drivers. The results are expected and well established [15].
Another significant variable found to impact the severity of barrier crashes is shoulder width. An increase in shoulder width was found to be associated with higher severity of barrier crashes in the highway systems. This impact was linked to vehicles needing to be stopped as soon as possible before going further on the shoulder width and then hitting barriers [16]. It is also intuitive that a higher posted speed limit is associated with higher severity of crashes in general. The higher speed would increase the impact of subjects on vehicles and passengers and consequently increase the severity of crashes. Rollover crashes increase the severity of crashes. The impact is expected as rollover crashes increased the point of vehicle impacts with drivers during the process of rollover (Rezapour et al., 2022).
Having a citation record was found to increase the severity of crashes. The impact is expected as those drivers are riskier and more likely to be involved in more severe crashes (Rezapour et al.,2018). In other words, the violation is an indication of future crashes. The importance of seatbelt use in the reduction of the severity of crashes is intuitive and studies have been conducted studying the importance of seatbelt use (Rezapour et al., 2022). Lower severity of crashes on non-dry road conditions is expected as drivers drive more cautiously on less-than-optimal road conditions, consequently reducing the severity of crashes.
3.2. Random Parameters
The results highlight that the impacts of gender, time of day and AADT on the severity of barriers crashes are not constant and thus should be defined based on some distribution. It should be noted that although the standard deviation (SD) of the parameter AADT was significant in the other two models, there is uncertainty associated with this variable for the third model. However, to be consistent, this predictor was left as random in the third model as well.
The only difference between the standard mixed model and mixed model with heterogeneity in taste was due to letting the means of gender to vary based on variables including AADT and shoulder width, and also AADT based on ADTT.
The endogeneity for the means of gender variable might be expected as the means of random parameter gender might be dependent on those variables due to the propensity of drivers with different genders to drive on roadways with various characteristics. On the other hand, it was found that the means of random parameter AADT varied across observations based on the parameter of ADTT. However, it should be noted that there is a slight uncertainty due to the impact of ADTT on the means of AADT. That impact was kept in the model due to an improvement in the model fit and the importance of the provision of insight regarding the endogeneity.
Gender is another important factor that was found to impact the severity of barrier crashes. The results indicated that female drivers are more likely to be involved in severe crashes than male drivers. The result is expected and shown in the literature review that female is overrepresented in crashes compared to male drivers [17]. The impact might be related to female physical structure, making them more prone to severe crashes (Rezapour et al., 2018).
It is also worthy mentioning that the normal distribution was set for the distributions of all random parameters as it resulted in better fits. The heterogeneity in taste for two random parameters highlights that there are unknown and unseen uncertainties involved in those predictors, which vary across various barriers’ crashes based on some observed predictors.
3.3. Comparison Across the Two Models
The standard logit model was expanded to the mixed logit model and then to the mixed model with heterogeneity in taste. The model with heterogeneity in taste assumes that unseen heterogeneity being due to gender and AADT vary across individual barrier crashes according to some observable variables. The results are intuitive, indicating that the mean of the random parameter of gender, for instance, decreases based on higher traffic count and shoulder width as follows:
 |
(8) |
Here π corresponds to the matrix that accommodates the vectors of shoulder width and AADT. ωir accommodates random draws being normally distributed, N(0,I)and L is the lower-triangular Cholesky factor [18].
The goodness of the two models was compared in terms of Alkaike information criterion (AIC). The goodness of fit is a valid measure for comparison as the method penalizes for the number of included predictors. As can be seen, there is a significant improvement from the standard logit model (BIC=1,644) to the standard mixed (1,564) and mixed model with heterogeneity in taste (1,555). In addition to the improvement in the model fits, significant changes could be observed in the magnitudes of the points estimated and their standard errors.
Especially significant changes could be observed across the two mixed models across those parameters in which heterogeneity in tastes was considered. In terms of fixed parameters, differences could be observed across the two mixed models and standard logit models. For instance, consider rollover crashes where the point estimates of mixed models are very close, they are more varied when compared with the standard logit model. Similar explanations could be made regarding posted speed limit across the mixed model and the standard logit model. The variations are expected and reflected in the goodness of fit of models.
CONCLUSION
Run of roadway crashes account for a significant proportion of severe traffic crashes. Traffic barriers have been installed to mitigate the severity of those crashes. Despite efforts in traffic barriers designs improvement, the severity of those crashes still persists. The standard logit model is a common method that has been implemented in the literature review for modeling crash severity.
In this study, the application of the standard logit model has been extended to the mixed model for analyzing crashes to account for the randomness of individual crashes. However, a standard mixed model with random parameters might not capture the real impact of random parameters and the dependence of those factors on other variables. Researchers have given more flexibility to the random parameters by setting constrain off those parameters for giving them more flexibility to vary across observations. It has been achieved by changing the random parameters’ means based on other predictors.
In general, improvements were observed moving from the standard logit model to the standard mixed and mixed model with heterogeneity in taste. In the analysis, it was found that the means of the random parameter of gender is dependent on the shoulder width and AADT, indicating that an increase in ADTT and shoulder width decrease the likelihood of female drivers being involved in higher severity of barriers crashes. Also, the means of AADT was found to be dependent on the means of ADTT. The impacts were considered after no multicollinearity was observed between those two predictors.
Besides comparison based on goodness of fits, the models could also be compared in terms of error terms and model coefficients’ estimate. In terms of models’ estimates of coefficients, the models’ coefficients and standard errors vary especially across standard logit models and the other two mixed models. Still, significant differences could be observed across the two mixed models, especially across parameter estimations for those variables in which heterogeneity in taste was considered. In general, higher error terms could be observed for the mixed model with heterogeneity in taste. The result is consistent with the literature review that not accounting for taste heterogeneity should not be seen as a deficiency of the model but as a sign that the error term is decreased [19].
The improvement in a random model with heterogeneity in taste might be due to the fact that a complemented model could better account for crash randomness by taking into consideration the endogeneity of gender, shoulder width, traffic, and also AADT. In general, the results of the analysis were in line with the literature review showing higher posted speed limit, shoulder width, presence of concrete barriers, motorcycle riders, dry road conditions and having past citation records will increase the likelihood of higher severity crashes for barriers.
The main goal of this study was to test the presence of taste heterogeneity in the population of traffic barrier crashes. The results lead to an important insight into the importance of accounting for taste heterogeneity. That was especially important as it allows us to account for heterogeneity in taste resulting from possible endogeneity across various predictors. Future studies should take into consideration the residual taste heterogeneity to see if a further improvement could be achieved. Also, they should take into consideration the unobserved inter-alternative correlation.
On the other hand, it has been argued that although the mixed model could model various data well, the results would depend on setting a correct mixing distribution [20], often set arbitrary as normal by practitioners. The shortcoming could be accounted for in future study using a discrete distribution in the latent class model.
LIST OF ABBREVIATIONS
| AADT | = Average Annual Daily Traffic |
| ROR | = Run Of The Road |
| TH | = Taste Heterogeneity |
| NL | = Nested Logit |
CONSENT FOR PUBLICATION
Not applicable.
AVAILABILITY OF DATA AND MATERIALS
Not applicable.
FUNDING
None.
CONFLICT OF INTEREST
Mahdi Rezapour is the Associate Editorial Board Member of The Open Transportation Journal.
ACKNOWLEDGEMENTS
Declared none.

