All published articles of this journal are available on ScienceDirect.

Data Fusion of Non-destructive Testing Methods for Bridge Deck Condition Assessment
Authors Info & Affiliations
Abstract
Background:
Highway agencies explore the use of non-destructive testing (NDT) for assessing the condition of their infrastructure in the most cost-effective manner. NDTs can provide as-built construction quality, as well as in service condition assessment especially for older structures where some critical information and/or maintenance records are often not available. In many cases, the use of NDTs requires “ground true” data for either calibration or validation. Surveys for obtaining such information is often challenging for in service structures, time consuming and costly.
Aim:
Objective of this paper is to present a data fusion approach for forensic investigation of bridge decks, in which Ground Penetrating Radar (GPR) is used to assess the current condition combined with a Laser Scanner system to verify the bridge design features.
Methods:
The data fusion approach proposed in this study considers using GPR based condition data combined with geometric measurements of the bridge deck obtained from the Laser Scanner system. Such novel fusion approach permits to more accurately measure the current bridge deck conditions in terms of thickness of the bridge deck and rebar depth to assess deterioration. Furthermore, detection of variations in the rebar depth suggested the implementation of a correction procedure for the reflection amplitude of the GPR signal based on true rebar depths instead of the two-way travel time, which is commonly applied.
Results:
This innovative analysis approach provided a more refined assessment of delaminated areas in the bridge deck. The data fusion and suggested analysis methodology was tested on a pre-stressed concrete bridge in Italy.
Discussion:
The approach proposed in this study can be used elsewhere for assessing the condition of bridge decks.
Conclusion:
The merging of such methods is particularly valuable for bridges were construction drawing and records may not be available, and/or there is potential concern of a deviation between design and as-built characteristics (i.e., where quality assurance and quality control records may be questionable).
1. INTRODUCTION
Highway engineers explore using fast, cost-effective, and accurate methods for assessing critical infrastructure components. In such efforts, agencies explore alternative condition assessment methods for use in their Bridge Management Systems, BMS. Data collected with high-efficiency equipment, such as GPR, allows for capturing high-quality and detailed information on the road and bridge assets and creating a georeferenced database that can be used for road maintenance and quality assurance/quality control (QA/QC) applications [1]. At the network level, GPR can provide useful information on the condition of bridge decks for maintenance management and optimization of the allocation of resources [2]. At the project level, GPR provides detailed information on layer condition and thickness, reinforcement location, flaws during construction (i.e., honeycombing, voids, cracking, segregation) and/or degradation, among others [3]. GPR can also be used in QA/QC to complement inventory data when design and construction records are questionable. Thus, such technology can provide quantitative information for improved decision-making and reduced operating costs in Bridge Management Systems [4, 5]. For these reasons, several studies have explored the use of GPR in assessing the condition of bridge decks and identifying potential improvements in GPR data analysis [6, 7]. In terms of bridge deck condition, inspections aim to detect defects, such as cracking, corrosion of rebars, and delamination, and assess the cover depth and thickness of the overlay [8]. Traditionally, visual inspections are combined with coring, chain drag, half-cell potential and electrical resistivity, and sounding. These are time-consuming methods and require traffic control with concerns about the safety of inspectors and the driving public. Thus, agencies are now considering adopting non-destructive testing methods for condition assessment [9]. The detection accuracy of GPR for bridge decks has been extensively studied and reported in numerous studies [10-14].
The premise is that the presence of moisture and chloride ions in the concrete matrix and cracks and reinforcement corrosion attenuates the GPR signal. Steel rebars in concrete slabs are commonly used as a reflection interface for assessing GPR signals' attenuation. However, since the reflection amplitude also depends on the concrete cover depth, the depth-amplitude effects should be considered in the analysis of GPR data [15]. In the process, the two-way travel time is commonly used in GPR to identify each rebar's depth.
Thus, the objective of this study was to first consider the combined use of GPR with a Laser Scanner system to enhance the analysis of current bridge deck characteristics in terms of thickness of the asphalt overlay, concrete cover and rebar depth, and deck thickness. Furthermore, to improve delamination detection, an analysis approach considering variations in rebar depth was suggested for implementing a correction procedure for the reflection amplitude of the GPR signal based on true rebar depths instead of the two-way travel time as proposed in previous studies. It is worth mentioning that, in the present case study, the variability in the cover depth of rebars due to the curvature of the pre-stressed beams enhanced the relevance of the procedure.
In this study, the GPR antenna emitted electromagnetic waves at 600 MHz and 2000 MHz. The higher frequency is for acquiring higher resolution at a shallower depth, while the lower frequency is for acquiring data at higher depths of the bridge deck. The GPR data were combined with terrestrial laser scanning measurements for detecting the bridge deck geometry.
2. MATERIALS AND METHODS
2.1. GPR Principles
Ground Penetrating Radar (GPR) is an electromagnetic-based non-destructive geophysical tool that can be used for pavement and bridge deck investigations, including layer thicknesses, location of reinforcement, and deterioration detection. The working principle of the GPR technique is based on sending a short-duration electromagnetic wave and recording the arrival time, amplitude and phase of the back-reflected signal. Specifically, the GPR antenna transmits short bursts of electromagnetic waves as the instrument is moved across the pavement surface. When the downward-propagating GPR signal encounters an interface with a change in electric permittivity, some energy is reflected from the interface to the receiver as an echo. The remaining energy is transmitted across the interface. Maxwell’s equations describe the wave propagation of the GPR signal, and constitutive relationships quantify material properties.
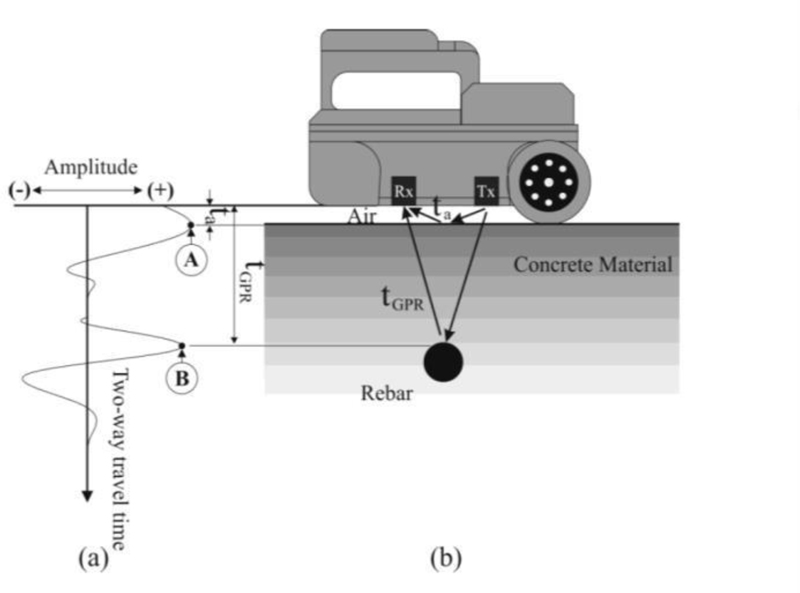
Fig. (1) represents a schematic representation of a GPR survey on a reinforced concrete structure. An electromagnetic wave is emitted towards the surface by a radar with a fixed central frequency using one or more antennas. A signal is then received as a function of the material properties and the characteristics of the receiving antenna. Several pieces of information are then monitored, such as the two-way travel time between reflection peaks at layer interfaces/target positions (e.g., rebars) and the amplitude and phase of the signal.
When the GPR antenna approaches the location of a rebar, the two-way travel time versus travel distance has a parabolic shape, and so the concrete cover depth (playing a significant role in protecting the rebars from corrosion) can be calculated as the distance of apex from the surface [16]. The thickness of the asphalt layer (overlay) can be calculated following the ASTM D4748 [17] by the two-way travel time method or the common midpoint method when multiple GPR transmitter-receiver antenna pairs are available. For detecting deterioration at the top of the reinforcing rebars, ASTM D6087 [18] recommends two approaches “the bottom deck reflection attenuation technique” and the “top reinforcing reflection attenuation technique.”
Concrete bridge deck deterioration may be associated with various mechanisms. The primary concern is often related to water ingress causing rebars and other metal structural members to corrode. The water in the pores of concrete will manifest changes in the material’s electrical properties, causing a substantial increase in signal attenuation, affecting thus GPR response. The time lag for the signals from the transmitting antenna into the subsurface and back to the receiving antenna and the received signal amplitude are indicators of electrical property changes in the surroundings. More specifically, the relative permittivity (εr) and wave velocity (v) of materials vary with water content and electrical conductivity (σ) and are affected by the salinity of pore water [19]. By analyzing GPR responses, estimates of electromagnetic wave velocity and signal attenuation can be extracted and used as surrogate indicators of water saturation and salinity [20].
2.2. Deck Characteristics and Geometry
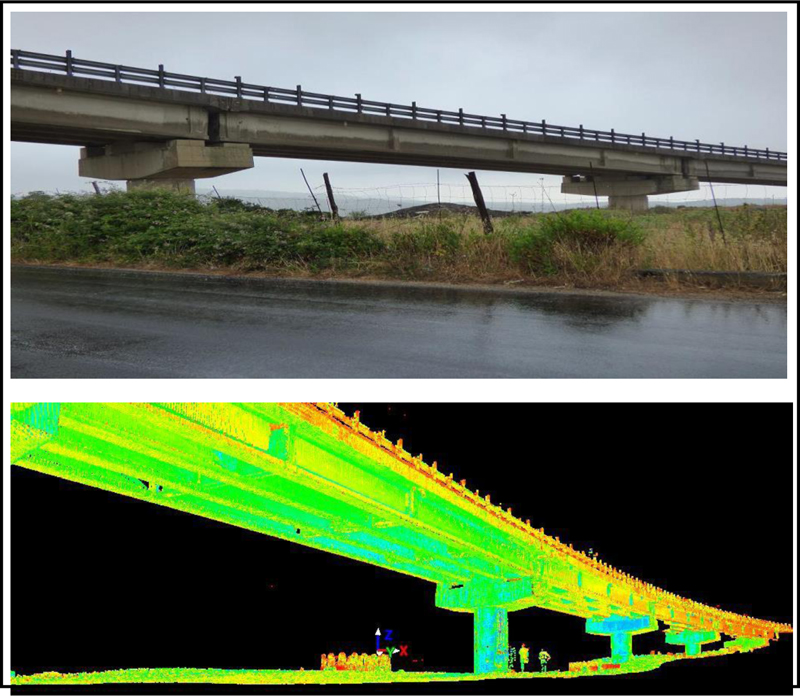
GPR data were collected from a bridge on the national road SS 124. The national road SS 124 is an Italian two-lane rural road. The bridge was constructed and opened to traffic in the early 90s (Fig. 2). The geometry of the bridge structure was measured with a terrestrial laser scanning system. Seven laser scans from different positions were carried out, two on the opposite sides of the bridge, to detect all the bridge geometry. The “points cloud” so obtained represents a valid 3-D model to carry out measurements and extract useful information about the bridge geometrics through dedicated software [21]. Since construction records from this specific bridge were limited, bridge designs drawings for this type of bridge built at the same time and with the same materials and construction techniques were obtained from the road national agency (ANAS) and used for further validation of the terrestrial laser scanning measurements along with surveys conducted on-site. Further details are provided elsewhere [14].
The bridge is supported by a series of pillars about 32 meters apart. The deck consists of 5 cross and 4 longitudinal beams in each section bound by two pillars. Along the bridge deck are two open joints at 88 and 185 m from the starting point. The bridge consists of two lanes with each 3.75 meters wide. The width of the entire roadway is 9.45 meters, where 7.50 meters is the width of the travel lanes, while the shoulders have a width of about 1 meter.
2.3. Data Collection
A section of the bridge with a length of approximately 320 meters was examined with a GPR system (i.e., georadar) available at the Transport Infrastructure Laboratory of the University of Catania. The system uses two antennas/receivers with 600 MHz and 2000 MHz frequencies. The K2_FW acquisition software is used to manage and review the site data.
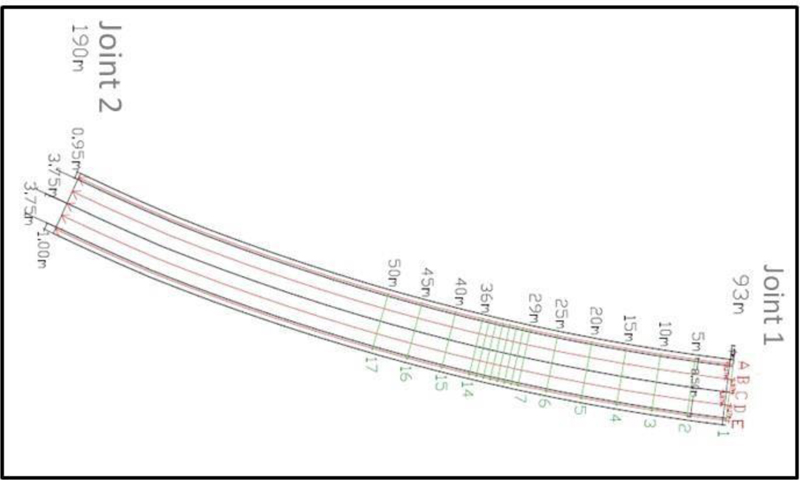
A grid comprised 5 longitudinal GPR surveys (identified as A, B, C, D, E, F), which covered the entire roadway, and 17 transversal surveys (Fig. 3) to map the surface of the bridge deck.
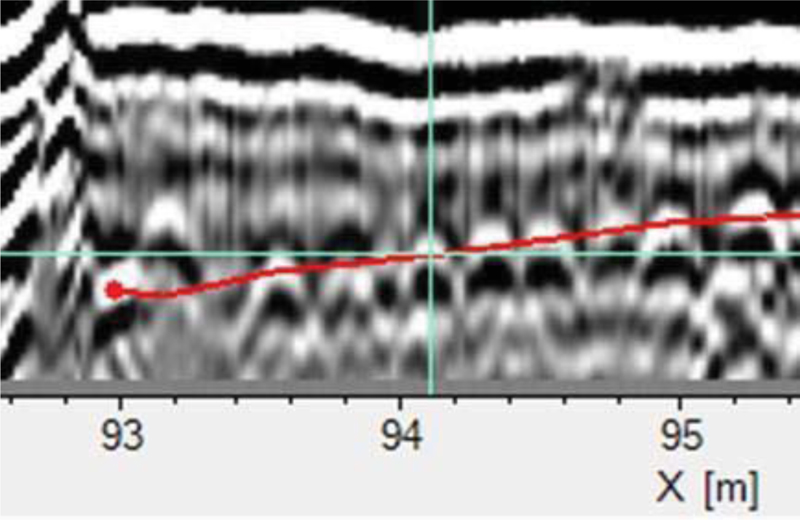
The longitudinal paths A, B, C, D, and E of the GPR surveys were collected from the starting point (chainage 0 m) to the final point (chainage 320 m). The transverse surveys were collected on the central portion of the bridge (from chainage 93 to 143 m), covering the entire cross-section between the longitudinal alignments A and E. The first transversal alignment is placed at the first visible joint (chainage 93 m), while the subsequent alignments have been tracked 5 meters away from the previous one. The following analysis refers specifically to the GPR data along the bridge span between chainages at 93 and 125 m, which are reported as 0 and 32 m in the following contour maps.
The asphalt layer overlay thickness and concrete cover were further verified through site inspections on the two open expansion joints 1 and 2 by drilling bored inspection holes at various locations [14]. Such a 3D model of the bridge provided the “ground true” conditions for the GPR analysis.
3. DATA FUSION
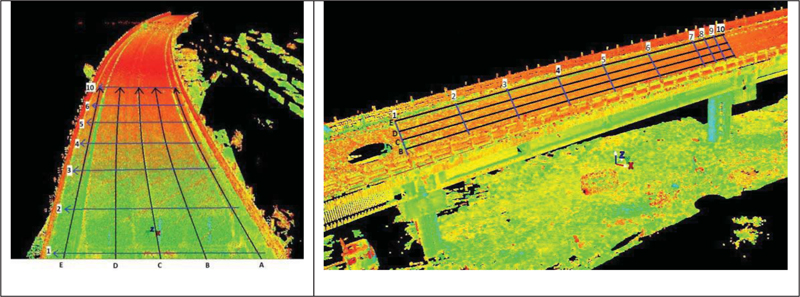
Laser scanning enables obtaining a 3D output model (Figs. 2 and 4) of bridge deck geometry with the accuracy of the best topographic instruments [21]. The bridge deck geometry and alignment were then used with the GPR output for properly overlaying spatial thematic features (i.e., changes in dielectric properties, delamination, overlay and bridge deck thicknesses). The fusion of these surveys from the two NDT equipment permits overlaying GPR data to the deck location. Fig. (4) shows the overlaying of georadar bridge surveys with the 3D output model.
The laser scanner survey was carried out from different stations to detect the bridge's bottom and upper shape. Therefore, the large cloud points were reduced to limit the files' size while keeping the point density at 1 mm [21]. GPR data post-processing was used to filter possible noise. The approach is reported in detail elsewhere and includes signal processing with time-zero correction, band-pass filtering and background removal [21, 22]. The signal's two-way travel time (T) was recorded for each longitudinal and transversal GPR run.
The bridge deck thickness, from the bottom of the concrete slab to the top of the pavement surface, derived from the laser scanning 3D model, was used to correctly estimate the values of the electromagnetic wave propagation velocity of the GPR signal, increasing thus accuracy of the analysis. The different EM velocities on asphalt overlay and concrete were considered in this analysis. The value of the two-way-travel time (T) collected with GPR was used to determine the variability of the electromagnetic wave velocity (v) that, together with the signal amplitude, are indicators of the dielectric property changes reflecting deck deterioration. Therefore, a correct estimation of v is a fundamental factor in the assessment process. The deck thickness variability in the present case study emphasizes such an approach's usefulness.
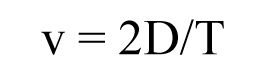
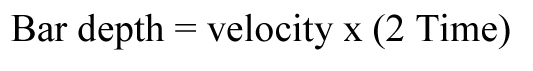
Velocity (v) is determined based on the two-way travel time (T) and the round-trip distance (2 D) of the electromagnetic wave:
 |
(1) |
where D is the actual thickness of the deck; values of D are not known ahead of time accurately because of construction tolerance and errors. Moreover, construction data often may not be available, especially for older bridges. Therefore, for the accurate estimation of v, the thickness of the bridge deck was verified for each longitudinal section of the GPR survey from the laser 3D bridge CAD reconstruction. The laser model showed that bridge deck thickness was not constant as expected but varied from 520 to 372 mm. The reason can be traced back to the curvature induced by the pre-tensioning of the cables.
Fig. (5) shows a map of v calculated with eq (1) from the GPR surveys over the bridge deck in the span between chainages 93 and 125, using the laser bridge deck thicknesses. The contour map is drawn by interpolating by cubic splines the values detected in the grid of the survey alignments.
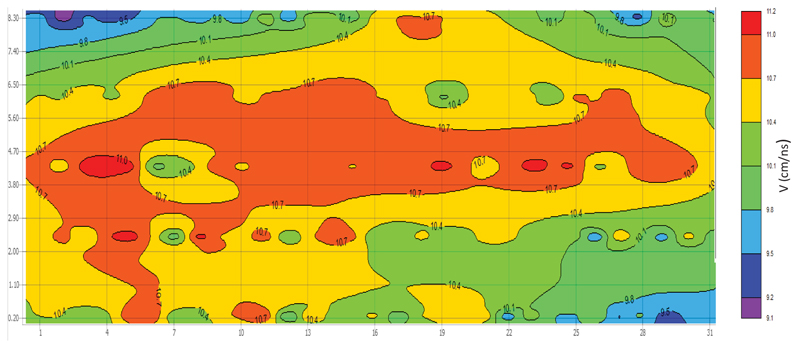
Because of both thickness and travel time variability, wave velocity ranges between 9.06 and 11.41 cm/ns with a mean value of 10.41 and a Root Mean Square Error (RMSE) of 10% between the actual signal speed and its average value.
4. RESULTS AND DISCUSSION
In order to compare the results with and without data fusion, GPR data were analyzed first by using a constant value of wave velocity, as the standard practice, and an assumed average value of 10.4 cm/ns. The average travel speed of 10.4 cm/ns represents the best estimation from accurate and time-consuming on-site GPR calibration. Since a high-frequency antenna provides a better resolution than the lower one, the signal from the 2000 MHz antenna was used to analyze the overlay thickness, cover and rebar depths identified from the reflection's apex parabola (Fig. 6). Rebar depths were variable, with a curvilinear shape (red line) associated with the pre-stressed curvature of the beams. At the pillar, the reinforcement depth has the highest value equal to 22 ÷ 23 cm from the surface, while such depth decreases away from the pillar (until to about 14 cm) following the curvature of the precast beams.
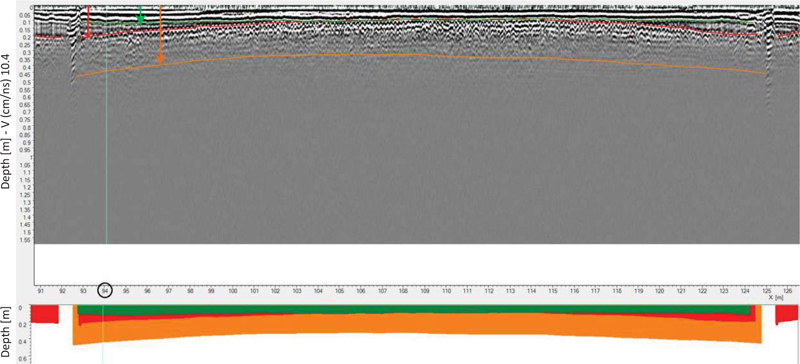
The beam curvature was confirmed by the laser scanning survey from the bottom of the deck. Fig. (7) shows the graphical representation of the layers’ thickness, whose values have been accurately calculated in the 3D CAD model. Fig. (7) also shows the GPR survey, indicating the asphalt overlay thickness (green line), the location of the rebar reinforcement (red line) and the bottom of the deck (orange line) along the A survey alignment of the bridge deck. The back wall surface of the bridge deck was detected with the lower frequency antenna, 600 MHz. The asphalt overlay throughout the bridge deck ranges between 10-11 cm. The asphalt layer and cover thicknesses from the GPR and laser scanner surveys in Fig. (7) have been validated by physically measuring such thicknesses at the open joints. The measurements from the inspection and those estimated from the laser scanner and GPR analysis matched 100% of the time.
4.1. Signal Depth Correction
The existence of a relationship between signal amplitude and cover depth is expected since the amplitude of the electromagnetic (EM) wave decreases in the vacuum by the inverse of the square of the distance (geometric loss) and in a pure dielectric material, decreases exponentially with the travelling distance, z, dielectric loss [23]. Moreover, in the GPR surveys of bridge decks, the reflection intensity decreases with the density of free charges in concrete (presence of chlorides and corrosion) and in the function of how easily the charges can move (moisture, conductive loss). Therefore, in simplified terms, the overall attenuation (A Total) can be represented as composed of three factors, all dependent on the distance, [24] (Eq. 2).
 |
(2) |
where:
d is the concrete cover depth (i.e., rebar depth); A Total is the total attenuation of amplitude;
A geometric loss is attenuated due to geometric loss (reduced amplitude in the vacuum).
A dielectric loss is an attenuation in a pure dielectric material (reduction for the cover material dielectric properties).
A conductive loss is an attenuation due to conductive loss (reduction for concrete deterioration).
However, only dielectric and conductive losses were found to be dominant, and up to 90% variation of rebar reflection amplitude can be attributed specifically to the variation of concrete cover thickness, d [24].
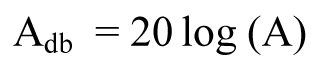
This factor, well documented in the literature [15, 24-28], is not considered in the standard assessment of bridge deck conditions. For example, the deterioration index A db (in dB) used in ASTM D6087-08 with the “top reinforcing reflection attenuation” technique assumes that the depth, d, of the reinforcing rebars is constant by using the following formula:
 |
(3) |
where:
Adb: deterioration index in dB
A: reinforcing deflection amplitude in the data unit
When the bar depth (d) is not constant, the correlation between cover depth and signal amplitude can be assumed linear, as theoretically demonstrated in past studies [15, 25], even if there are small variations in concrete properties. Diamanti et al. [25] showed that if the depth variation (t) is small over the average value (d’) such that d = d’± t with t<<d’, eq (3) becomes:
 |
(4) |
where:
d: bar depth;
alfa: attenuation coefficient;
n: the geometrical spreading of the energy, which will range between 1 and 2 depending on the target depth and shape.
Eq (4) provides a linear relationship between the deterioration index Adb and the bar depth (d) for correcting the GPR data. Barnes et al. [15] empirically demonstrated such linear correlation and proposed a normalization procedure for removing GPR signal losses resulting from depth-dependent two-way travel time variations in the data. The proposed procedure uses the travel time instead of true depth because of the assumption of proportionality between the two parameters at constant velocity. Such an analysis approach was proposed because it provides significant savings in GPR signal processing time since accurately detecting the true depth for each rebar was assumed to be challenging and/or time-consuming [24].
To address such an issue, given the availability of accurate values of the actual velocity (Fig. 5) from the data fusion between the Laser Scanner and GPR, we calculated the actual cover depth based on the relationship:
 |
(5) |
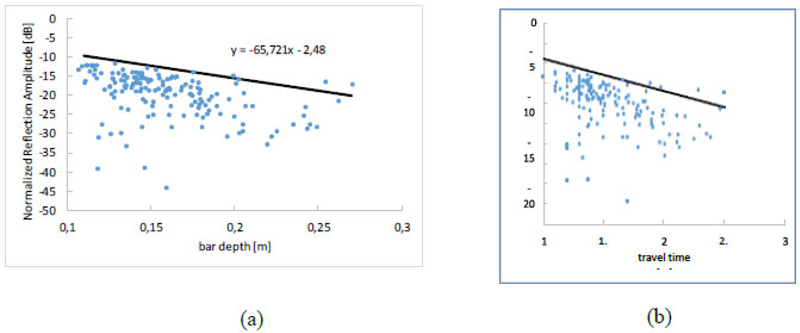
The maximum reflection amplitude and corresponding two-way travel time were matched for each reinforcing bar detected and the longitudinal position on the deck. The results are shown in Fig. (8), along with the 90th percentile linear regression (the top line represents the trend line fitted to the top 90th percentile values). As expected, a decreasing linear trend of signal amplitude (dB) versus rebar depth is observed in Fig. (8). The linear trend of normalized amplitude versus rebar depth can then be fit using regression analysis to the 90th percentile amplitudes (Fig. 8) and used to subtract the depth-dependent amplitude effects from the data (Fig. 9). The basis for amplitude correction using the regression line value is that the decreasing linear trend for the strongest reflections is assumed to be solely due to variations in cover thickness and not due to variations in chloride content. The 90th percentile is very conservative and is selected to provide comparable results to the ASTM D6087-08 procedure.
The regression procedure is similar to what was reported by Romero et al. [27] but more refined because the effective depth is considered (Fig. 8a) instead of its surrogate value of travel time (Fig. 8b). The comparison of the slope of the regression lines (Fig. 8) showed a higher dependency of Amplitude to bar actual depth (Fig. 8a) than travel time (Fig. 8b).
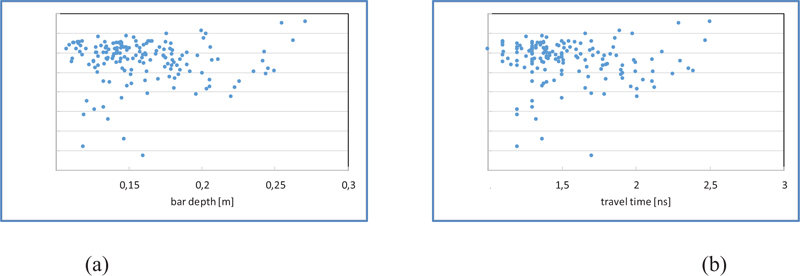
Therefore, the normalized reflection Amplitude was calculated using the actual bar depth. Comparing regression trends between Figs. (8 and 9), it is evident how after depth correction, amplitudes are no longer correlated with depth. Therefore, the resulting variations in depth-normalized reflection amplitude, Fig. (9), can be interpreted as being principally influenced by the effects of variable moisture and chloride content in concrete cover depth (i.e., conductive loss).
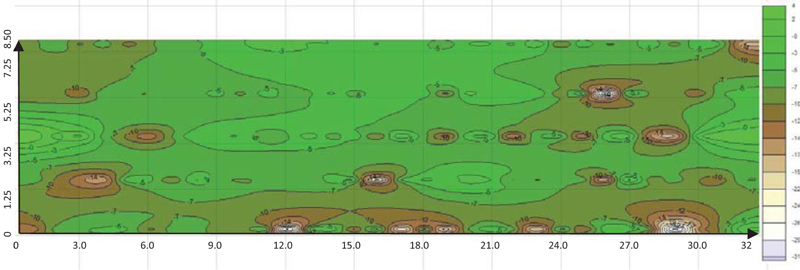
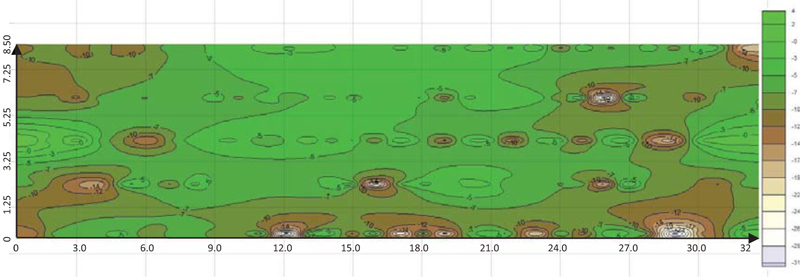
The assessment of bridge deck delamination obtained using depth correction carried by actual bar depth from the data fusion or the two-way travel time derived depth from only the GPR data, (Fig. 10), are compared using contour maps of reflection amplitude in decibels. The Depth-corrected amplitudes without speed adjustment are used to plot the location of delamination on the plan view map of the deck surface (Fig. 10). The color scale below -10 (brown) refers to values exceeding the normalized reflection amplitude threshold of 10 dB relative to the top 10% maximum reflection amplitudes [25]. Similarly, Fig. (11) shows the results obtained after the speed adjustment and depth correction procedure.
The differences between the non- speed adjusted and speed-adjusted results increase in the proximity of joints (at the left and right sides of the deck surface in Figs. (10 and 11) where the rebar depth is higher. Such a difference decreases in the center section of the deck where the bar depth is at the minimum values. For similar locations (i.e., two locations close to joints or somewhere in the middle of the deck), higher deviations in velocity from the average one for that location/region represents higher deck degradation. As an overall effect, results from the case study pointed out that values not corrected for the actual velocity variations tend to underestimate deck degradation providing a less accurate assessment. Data fusion made it possible to calculate the adjusted speed with considerable precision, allowing us to obtain the result of Fig. (11) with the highlighted differences with respect to Fig. (10). More specifically, in the present case study, the procedure based on data fusion provided an increase of about 25% in the area identified as affected by delamination. As mentioned earlier, the bridge deck thickness was determined from the 3D model, and rebar depth obtained from the GPR analysis of the concrete asphalt overlay was verified through open joint surveys and drilled bored inspection holes at various locations.
CONCLUSION
Assessment of bridge deck conditions with GPR can provide valuable information for BMS decisions and the allocation of maintenance and rehabilitation resources. The data fusion approach proposed in this study permits us to more accurately measure the current bridge deck conditions in terms of the thickness of the asphalt overlay, concrete cover and rebar depth and assess deterioration. Furthermore, detecting variations in the deck thickness and rebar depth suggested implementing a correction procedure for the reflection amplitude of the GPR signal based on true rebar depths instead of a constant two-way travel time which is commonly applied. Combining GPR and laser scanning surveys also aids in bridge deck condition surveys when limited as-built construction data are available. The analysis and results indicated that GPR surveys could notably improve accuracy when combined with accurate geometric measurements of the bridge deck thickness and curvature available through laser imaging. In the case study where the proposed methodology was implemented, a 25% increase in deck surface area affected by delamination was observed versus when standard GPR analyses were used. The difference in extension and severity were specifically related to the case study and cannot be generalized. Anyway, the results showed the usefulness of the proposed approach to improve the assessment accuracy compared to the standard ASTM procedure
Combining GPR data with laser measurements can help minimize the need for time-consuming and costly bridge deck inspections and coring for GPR calibration and verification. Apart from costs, laser survey of bridges can be challenging for high-elevation structures, but new opportunities are rising in the application of Unmanned Aerial Systems in building inspections. In terms of economic benefit, a more detailed detection of deck degradation can help reduce the costs pertinent to maintenance and rehabilitation (i.e., identifying proper type and timing of treatments, and, first, the structures that need immediate attention in bridge management). When appropriately calibrated and validated, GPR surveys can provide accurate information on the location of reinforcing rebars, rebar corrosion detection, rebar size estimation, and concrete cover evaluation. Depth correction of the ASTM “top reinforcing reflection attenuation” procedure for detecting delamination was confirmed to be relevant when variation in rebar depth is present. The simple threshold approach proposed by the ASTM was used to compare results. Future efforts may provide similar results when applying more refined methods, such as the K-means clustering technique or half-cell potential. The methodology proposed in this study can be implemented for other bridge deck structures and is transferable elsewhere.
LIST OF ABBREVIATIONS
| NDT | = Non-Destructive Testing |
| GPR | = Ground Penetrating Radar |
| QA/QC | = Quality Assurance/Quality Control |
| RMSE | = Root Mean Square Error |
| EM | = Electromagnetic |
CONSENT FOR PUBLICATION
Not applicable.
AVAILABILITY OF DATA AND MATERIALS
Not applicable.
FUNDING
The University of Catania has partially financed this work within the project “Piano della Ricerca Dipartimentale 2016-2018” of the Department of Civil Engineering and Architecture.
CONFLICT OF INTEREST
The authors confirm no conflict of interest related to the manuscript.
ACKNOWLEDGEMENTS
The authors wish to thank the Italian Road National Authority (ANAS) for providing access to the bridge under investigation and Mr. V. Currao and Dr. B. Capace for their involvement in the GPR data collection and reporting.

