All published articles of this journal are available on ScienceDirect.

Energy Efficiency Improvement with Reversible Substations for Electrified Transportation Systems
Abstract
More and more often overall energy efficiency of an electrified transportation system appears as a target of new constructions, sometimes with incomplete definitions of performance indexes to assess that target has been reached. A worked out example is based on the introduction of reversible substations. Reversible substations are a method to improve energy efficiency, whose application in an existing system can be progressive and does not require large traffic intensity to be effective. Their effectiveness depends on some system parameters (nominal catenary voltage in particular). A simulation model fed with experimental data from a line section of Metro de Madrid is used to demonstrate the operation and optimization of reversible substations.
Background:
The ambitious reduction of CO2 greenhouse gas emission within 2050 declared by the European Commission also involves transportation systems. In this context an optimum recovery of the electric braking energy produced by railway vehicles is more and more relevant. Several strategies to completely recover the braking energy are being developed and applied. A methodology that allows the accurate determination of the amount of recovered energy in real operating conditions becomes then a valuable tool.
Objective:
Reversible substations are one of the braking energy recovery methods that are widely applicable. Their effect is analyzed in a system perspective, considering them integrated into the transportation system with its dynamics and various operating points. The effectiveness and consequences of the operation of one or more reversible substations are evaluated by identifying relevant system conditions and scenarios.
Methods:
An electric network model is provided, fed by measured timetable and traction current. Simulation results are analyzed and compared with some experimental results: simulation configurations will be selected to match those of the available experimental data.
Results:
The selected substation's no-load output voltage level has a significant effect on the efficiency and performance of reversible substations. A reduction of 50 V, from 1700 V to 1650 V produces a decrease of the energy dissipated by the braking rheostat on-board trains of about 13%. The voltage increase caused during braking phases is kept under control better for track positions close to reversible substations: tests show that line voltage increase is 2.5% of nominal value with a reversible substation and only 0.5% when it is operated. Trimming the thresholds that trigger the operation of the on-board braking chopper (intermingling regenerative and dissipative braking) has a dramatic effect on regenerability: a reduction of 50 V causes an improvement of 19%.
Conclusion:
The paper presents a methodology that merges measurements and circuital model to investigate the energy saving provided by reversible substations supplying railway system. The methodology has been applied to a real case. Preliminary results regarding the impact of supply voltage level, reversible module position and threshold levels of the braking chopper control system on the dissipated braking energy and power quality has been carried out.
1. INTRODUCTION
The transport sector, in particular road vehicles, is responsible for almost one quarter of Europe’s greenhouse gas (GHG) emissions [1]. Even though a modal shift to public transport with electric rail as a backbone (urban rail in urban areas) is a self-evident priority, the share of passenger rail in EU land transport (in passenger km) only increased from 7.0% to 7.6% between 2007 and 2016. Attention has been focused instead on electric vehicles and alternative transportation modes, aiming at a sustainable power network [2] with a high level of integration of energy storage and renewables [3]. This scenario will further change owing to the EU policy in supporting the development of sustainable and smart mobility [4], with a consequent increase of the energy consumption for the electric rail.
A present weakness in the efficiency of DC railway systems, the most used supply system in urban areas, is the limited recovery of the electric energy generated during the electrical braking of the trains. Estimates show that a train for commuter service, running on a flat route 120 km long, dissipates about 200 kWh on the braking rheostats. Considering about 15 trains running on this line per day, an amount of 1 GWh per year, about the annual consumption of 365 families, is wasted for this single commuter line.
Energy efficiency is increased by improving in the first place, the exchange of power between generators (braking trains with available surplus of kinetic energy) and loads (trains other than braking, mostly pulling traction effort), quantified by the parameters regenerability and receptivity. The topic of energy efficiency in railway systems is of increasing relevance. Technical specifications from railway companies relating to procurement of new trains or by the infrastructure managers for new traction supply systems and complete lines were in the past mainly related to the reliability and resilience of the systems, completely neglecting energy efficiency. Nowadays, requirements on energy efficiency are routinely added. Receptivity of new supply systems is one of the new energy-efficiency-oriented requirements that is important in new tenders. Nevertheless, there is no standard definition of this parameter, nor a standardized method of quantification [5, 6].
Improvement of energy efficiency, by reducing the amount of wasted energy during braking and thus in turn energy absorbed through the Traction Power Station (TPS), may be seen as a system-level efficiency factor [7-11]. It needs, as a matter of fact, careful and accurate time scheduling and control to synchronize the trains for this favorable energy exchange to take place. This is not always possible for a wide range of issues: synchronization is achieved if a real-time centralized control is implemented [12]; even small traffic disruptions and delays may influence negatively the results; the driving style also has an impact for older transportation systems that do not have Automatic Train Operation (ATO). In addition, changes in fleet or timetable would require an overall simulation and recalculation of the new optimized schedule.
To overcome all these negative factors and allow more flexibility in energy recovery actions, bidirectional power converters and storage systems are being introduced, that allow for the injection of the braking energy in the upstream AC grid or in the local storage system [9]. This constitutes the so called “reversible”, or “non-conventional”, TPS (or substation) [13-15].
The design and development of reversible TPSs for DC railway applications are quite recent: architectures have been based on individual solutions elaborated by manufacturers [16]. Presently, system architectures are classified in the EN 50646 [17] standard without a detailed indication of advantages and disadvantages, and most of all without field experiences of adopted solutions and their benefits. Although some reviews and technical papers regarding energy efficient solutions for advanced electrified railways have appeared in the scientific literature, there is no overview of literature and realizations with a quantitative assessment of benefits and performances: architectures may be generally described without discussing implementation issues and technical challenges; sometimes details of the operation of some energy saving algorithms are given and simulation results are shown, but experimental confirmation, when provided, cannot be extended in time and operating scenarios for practical reasons.
Railway infrastructure operators, supply designers and developers require standardized methodologies and procedures that allow accurate and reliable evaluation of energy saving, in order to verify the compliance of the designed efficiency or to quantify the cost/benefit ratio in a more realistic way.
CLC/TR50646 has declared standardization needs for the traceable determination of efficiency at different levels of the converter group and for different operation modes (traction, regeneration) and the determination of the performance of harmonic compensation on AC and DC side. The standard focuses on the fundamental quantities for each network (upstream AC feeding line, downstream DC traction line). For each, the point may be raised if harmonic distortion has a relevant contribution to energy efficiency and should be included in the experimental determination: for DC railway lines distortion terms are negligible [18]; for the AC grid upstream the TPS [19, 20] could be extended and adapted. A different problem, instead, is the effect of pantograph arc typical of DC systems, that may trigger unwanted response of on-board braking chopper besides its own (yet smaller) dissipation [21].
2. METHODS
In terms of the method, the work considers first the overall objective of system-level efficiency, focusing on specific quantities for its demonstration and assessment; then, the reversible traction power station is introduced considering the determination of its effectiveness from a system-level perspective.
As introduced above, the overall efficiency of the electrified transit system is becoming a relevant objective for infrastructure owners and municipalities, so to include it as a contractual requirement. It follows that the requirement must be in principle tracked during design, showing the validity of the proposed solutions, and during the test and commissioning phase, validating experimentally the performance of the built system. To this aim, it is necessary to establish a set of energy and efficiency oriented performance indexes that well represent system behavior and that can be verified experimentally, if necessary. For the time being, in fact, verification by simulation only is required, without a thorough definition of the relevant scenarios [22-28]. Methods and procedures for experimental assessment at system level have not been yet considered in the relevant literature; items of equipment of the non-conventional TPS are disciplined by a few standards that, however, do not provide guidelines for realistic on-site testing (as discussed in Section 3.4).
2.1. Regenerability and Receptivity
With the complexity and nonlinearity of the regenerative braking phenomenon, energy utilization calculation requires drawn energy, energy available for return and energy actually flowing between trains. Two performance indexes are usually taken to offer a comprehensive, yet synthetic, assessment of performance:
Regenerability, G: The measure of the total recoverable kinetic energy that may be recovered as regenerative braking energy;
Receptivity, R: The measure of the fraction of energy available for recovery that is actually recovered.
Regenerability assesses the theoretically recoverable regenerative braking energy and indicates the potential saving of the system, with respect to the total system energy consumption. Regenerability mainly depends on the vehicle speed profile and physical characteristics.
The energy efficiency of the transportation system can be evaluated instead referring to receptivity. Receptivity may be somewhat elusive, since it has received several definitions [7, 29, 30]: receptivity for instance may be defined in terms of power or energy, and may be calculated either at each TPS or train, or for the whole traction system, expressed on a per-train basis or referred globally to the entire fleet.
Focusing on global system efficiency, the best definition of receptivity is for a given set of transit system operating conditions (in terms of power) or over some period of time (in terms of energy). To get relevant figures out of simulation or measurements, a time interval should be chosen that covers all relevant parts of the timetable (e.g. off hours and peak hours), excluding or diluting transient situations, such as when initially filling up the line with trains.
A more synthetic performance index is then the product of regenerability and receptivity, RR=R×G, calculated over some wisely selected time interval, representative of the various operating conditions and fleet composition.
2.2. Demonstration of System Efficiency
System efficiency is presently demonstrated by manufacturers using simulations, where the validation of the simulation tool in terms of reliability, sensitivity to parameters and accuracy of results has no standardized approach nor is consistently carried out. The exception is the standard CLC/TR 50641 [31] released in 2020, which nevertheless still lacks coverage of all quantities necessary for a complete determination of system energy efficiency.
As simulation output is presently accepted by administrations to show contractual compliance, understanding the validation and accuracy of simulators is a necessity [31]. Validation of a simulator in a complex scenario is characterized by a multitude of parameters and is not a trivial task:
First of all it is necessary to clarify if validation is carried out using experimental data or other reference data coming e.g. from another validated simulator or, for instance, from the solution of evident simplified cases;
Then we must distinguish between numerical accuracy (a simple metric of the error between compared curves) or similarity (more robust comparison between curves that have some slight parametric change, but are consistent and similar) [32-34].
Another characteristic that ensures sensible and reliable results is what is called “reliability”, that indicates a homogeneous behavior of the simulator to the entire range of its input data; in other words sensitivity to changes of input data has no extreme cases [34, 35].
The discussion of validation against reference data introduces the problem of the correct and reliable quantification of energy- and identification of validation-oriented quantities in a real system.
From a measurement perspective, the efficiency of a system – like of any equipment – should be measurable; by combining accurate measurements of all relevant observable quantities, the overall efficiency can be determined. In this sense defining the boundaries of the system and the level of detail (or abstraction) of the efficiency assessment is an important step, as it defines which quantities must be measured.
Electrical quantities at TPSs are of course the most intuitive choice, not only because they are all available at one site but also because the final effect of energy sell and reduction of energy bill is seen right at the TPS interface with the utility.
Considering the effect of operating conditions on efficiency [36], operating conditions should be monitored also by means of ATO or local train quantities (e.g. speed and pantograph voltage and current).
A close evaluation of train quantities also allows verifying the effectiveness of the power exchange between trains, compared to the flow towards the TPS.
If the effectiveness of specific solutions (such as the reversible TPS) is of interest, then a comparison should take place with a scenario where TPS reversibility is excluded, such as during a maintenance period. The short duration of such a period of time may be, however, challenging in terms of consistency of data (for both energy consumption metering and TPS or train electrical quantities).
The estimated efficiency is, however, the result of a punctual measurement at only one operating point (or operating scenario) of the system, including a mix of running trains, with some headway, line voltage value, etc. The actual relevant energy efficiency of the system we are interested in for billing purposes, energy saving, and impact reduction is an integral quantity, spanning all operating scenarios, each weighted by its probability of occurrence during system life (or system operation).
It is true, however, that repeating measurements of system efficiency for all such scenarios is demanding and challenging, for a matter of time, effort and controllability of all system parameters. We must admit that some scenarios might not be implementable for example at some stage of development of the project, or referring to a future expansion of the system.
A model-driven approach supporting system efficiency measurement would focus on the main scenarios and would interpolate for “intermediate operating scenarios”: the advantage is the provision of estimates of sensitivity and relative weight for efficiency figures, evaluating by extrapolation extreme cases that may rarely occur in practice or are difficult to reproduce at will. A determination purely based on simulation in this case is still useful to verify the plausibility of the measured efficiency values.
It is nevertheless relevant that relationships are non-linear and there may be quite different receptivity values at some particular configurations of trains along the line, at which the exchange of power is particularly advantageous or almost ineffective, making receptivity fluctuate widely and hindering the quality of the interpolated results.
System response in an energy efficiency perspective can be leveled with respect to such issues of operating scenarios and timetable by introducing reversible TPSs: instantaneous receptivity and the consequential system efficiency receive a sort of equalization by simply providing an energy receptor, also ensuring a lesser excursion of line voltage.
2.3. Reversible Traction Power Station Architecture
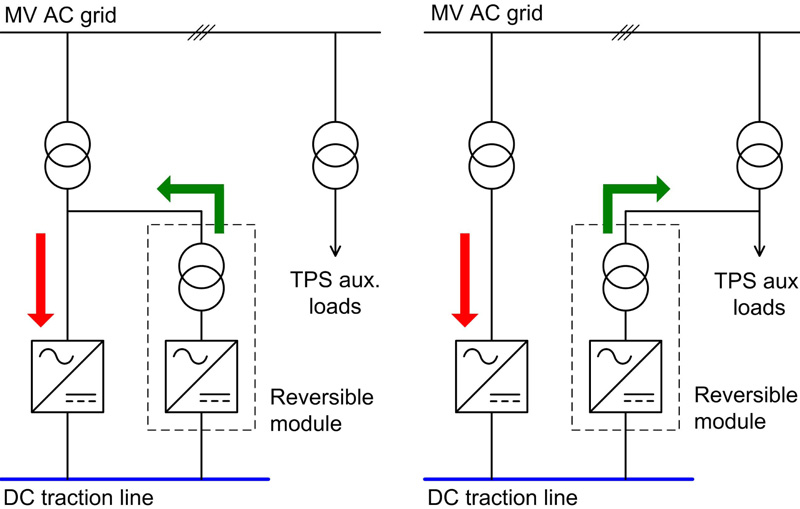
A non-conventional TPS implements bidirectional power flow, allowing feeding back the utility with the excess energy generated along the line during regenerative braking, in case line loads cannot directly absorb all this energy. As the energy flow should be allowed in both directions between contact line and grid, such TPS architecture may be based on separate rectifiers and inverters (oriented to the upgrade of existing rectifier-only TPSs) or a bi-directional four-quadrant converter in most modern implementations. This configuration avoids the issue of the current circulating between the rectifier and inverter module. Different circuital configurations can be selected in order to foster the injection of the extra energy in the AC medium voltage upstream grid (Fig. 1a) or the on-site consumption by supplying the substation auxiliary loads (Fig. 1b).
In some configurations the bidirectional architecture is sided by local energy storage to store the fastest power peaks from the line, relieving the converter from the demanding task of following such dynamics and simplifying the design of its control system.
The only normative reference describing the state of the art of reversible DC substations is the CLC TR50646 technical report [17]. The document briefly reports some configurations, performances, requirements and possible functionalities of reversible substations.
2.4. Determination of Efficiency
As general requirement efficiency improvement is expected from all individual components, mainly the feeding transformer and the TPS converters.
For the electronic power converter, the current state of the art allows the efficiency of substation converter to be better than 97% in rectifier mode and better than 96% in inverter mode at the maximum power. Concerning energy consumption, the CLC/TR 50646 report indicates only some aspects to consider in the computation, such as that a comparison between the consumption computed with standard and reversible TPSs. However, a detailed procedure for the computation is not provided, nor any information on measurements for validation or as an alternate method for the determination of the real energy consumption.
The standards set comprising EN 50327 [37], EN 50328 [38] and EN 50329 [39], in force since about 20 years ago, specify the conditions for rating and testing traction transformer and converter, as well as testing the whole converter group. They are oriented specifically to the diode rectifier group, so the old, consolidated architecture of DC transportation systems. The EN 50328 states that power efficiency of a converter may be determined by calculation of internal losses or by measurement of AC and DC power at basic load conditions. Moreover, the standard indicates that if the client requires measurement of losses this shall be listed in the procurement specification, and the admissible tolerance +10% of the guaranteed value.
Two aspects make the accurate losses determination of high power conversion chains very challenging: the high efficiency, namely low losses, and the distorted conditions. The input-output power measurement approach for the losses determination requires a very low uncertainty associated to the measuring instruments. Such aspect is much more challenging in presence of harmonics on the AC side and ripple on DC side. High accuracy level has to be guaranteed even for the measurement of the power provided by the distortions which can affect the losses determination. The weak points of the power measurement chain are the voltage and current transducers, in particular their frequency behavior under real operating conditions.
For these reasons, a complete characterization of the power measurement chains must be performed in laboratory by reproducing the actual waveforms observed on site [5].
These standards will be replaced by a new family of standards under development within CENELEC, which will address the determination of energy efficiency for TPS components. However, the working group is still considering marginally or at all testing at system level; on-site tests of losses estimation and the overall efficiency estimation are in fact not included nor currently under discussion. The newer standard EN 62924 [40] focuses on energy storage at fixed installations and defines measurements for the evaluation of the impact of the new installation in terms of energy saving and efficiency of the charge-discharge cycle.
3. RESULTS AND DISCUSSION
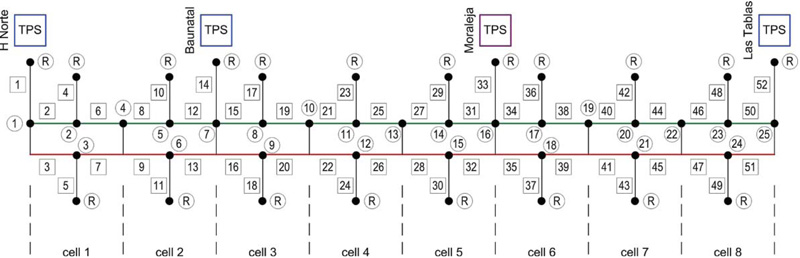
Simulations have been carried out to illustrate and confirm the considerations exposed so far. The model is based on experimental data, removing the necessity of validating the mechanical module, with the remaining electric module based on self-evident equations, implementing a simple ladder network as shown in Fig. (2).
The model implements a section of Line 10 of Metro de Madrid where extensive measurements were carried out during the MyRailS Project [5]: the moving train is characterized by measured speed and position to implement movement and pantograph voltage and current, covering all operating conditions during a journey in commercial service. Also internal quantities were measured, allowing the distinction between total braking current (available braking power) and rheostat chopper current (locally dissipated braking energy). The network shown in Fig. (2) allows the simulation of the train movement without modifying the graph structure. The train is modeled by a current generator that fixes the time behavior provided by the measurements. Moreover, the model implements approximately the braking chopper control strategy; in the electric braking stage, the current injected in the catenary, Ipant, depends on the pantograph voltage Vpant by the relationship:
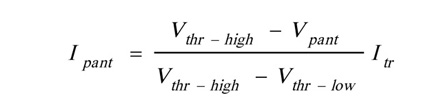 |
(1) |
where Vthr-low and Vthr-high are the thresholds that trigger the mixed and completely dissipative braking respectively, Itr is the current generated by the motors during braking.
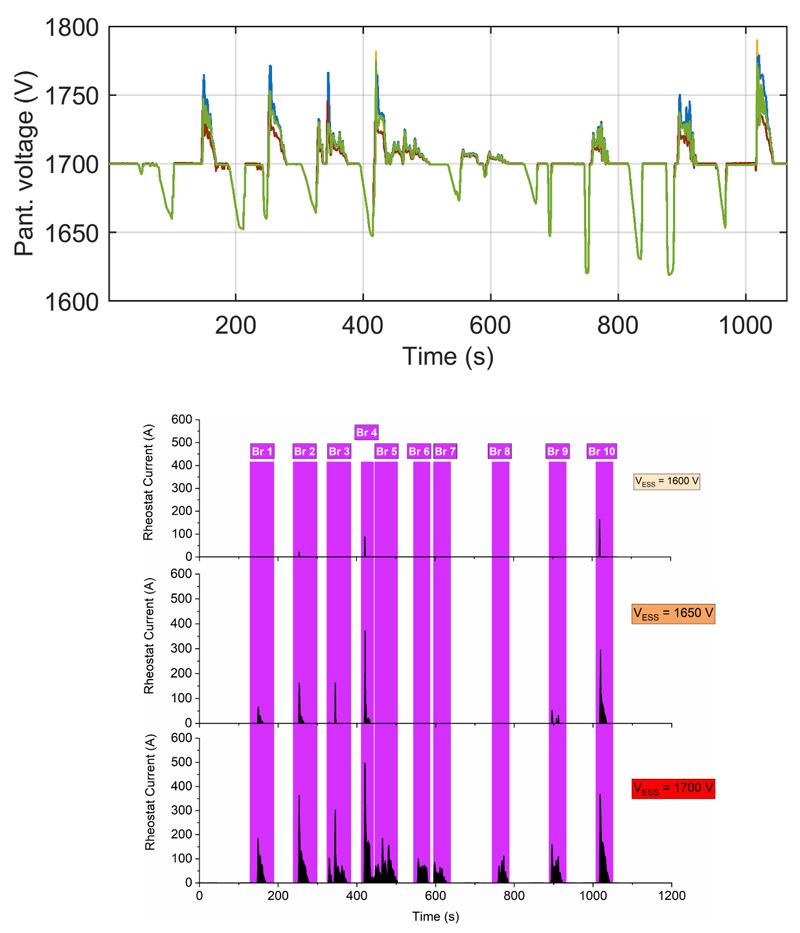
First of all, the pantograph voltage is provided under three different nominal values of the catenary (or line) voltage: 1600, 1650 and 1700 V. The test is done with one reversible TPS active (Moraleja), showing the different line voltage swells when the train undergoes regenerative braking. So the three conditions are identified as “Mor1”, “Mor2” and “Mor3”.
The regenerated energy is limited by the local dissipative rheostatic system in order to control the excursion of the line voltage to safe levels (such as those dictated by EN 50163, or other similar ones selected by the infrastructure owner). Changing the thresholds of operation of the chopper feeding the dissipative rheostat has influence on the amount of regenerative braking power made available: the tighter the threshold, the lesser the line voltage increases the lesser the available braking energy to be absorbed by other trains or by the reversible TPS. In this case the 1680-1800 V threshold adopted for the first three cases is narrowed and shifted up by selecting 1730-1800 V (case “Mor4”).
| Braking |
Mor1 VESS = 1600 V |
Mor2 VESS = 1650 V |
Mor3 VESS = 1700 V |
|---|---|---|---|
| Br 1 | 0 | 20 | 49 |
| Br 2 | 3.8 | 27 | 57 |
| Br 3 | 0 | 28 | 53 |
| Br 4 | 9.6 | 41 | 56 |
| Br 5 | 0 | 0 | 32 |
| Br 6 | 0 | 0 | 23 |
| Br 7 | 0 | 0 | 23 |
| Br 8 | 0 | 0 | 34 |
| Br 9 | 0 | 15 | 46 |
| Br 10 | 26 | 48 | 58 |
The results are shown in Fig. (3). It may be observed that the line voltage profile drops below the assumed steady value during time intervals of traction current absorption (as shown in Fig. (3a): all pantograph voltage curves are overlapped as the measured traction current is the same for all cases and the line voltage profiles were shifted artificially by applying an offset for exigency of visual comparison. The considered service provides 10 electric brakings, highlighted in Fig. (3b). As expected, the current flowing in the braking rheostat increases in magnitude and duration with the increase of the rated voltage imposed by the substations (Fig. 3b). With a rated supply voltage of 1600 V, only 3 braking events out of 10 showed a very small dissipation. At 1700 V, all the 10 brakings have a dissipative component. The impact of the supply voltage level on the dissipated power for each regenerative braking event is provided in Table 1 thanks to which it is possible to observe that brakings Br 5 to Br 8, which occur close to the reversible substation, become completely regenerative with a supply voltage reduction of 50 V.
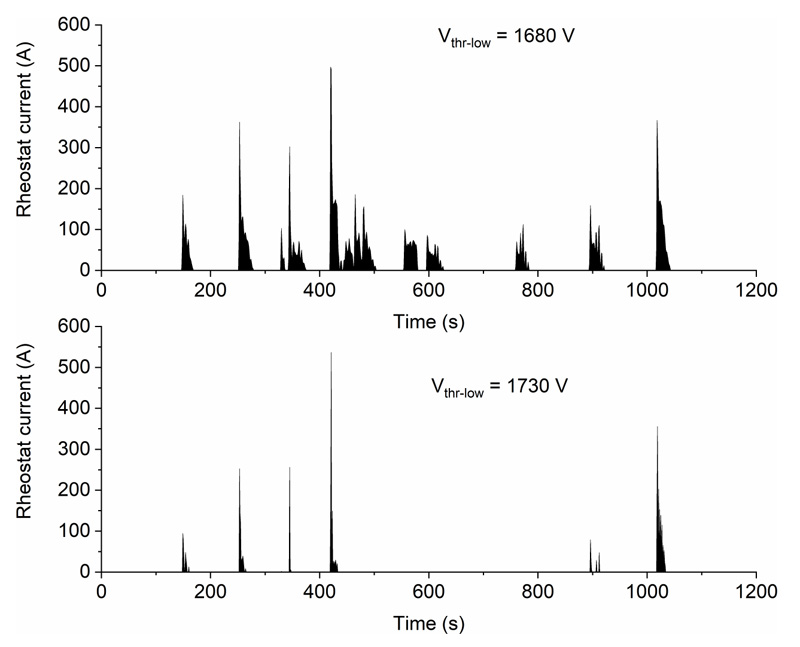
The effect of the threshold levels of the braking chopper on the dissipated power is shown in Fig. (4). The current flowing in the braking rheostat for the threshold of 1730 V becomes null for the brakings close to the La Moraleja (reversible) station even the peak current (about 500 A) remains almost constant in the two considered cases.
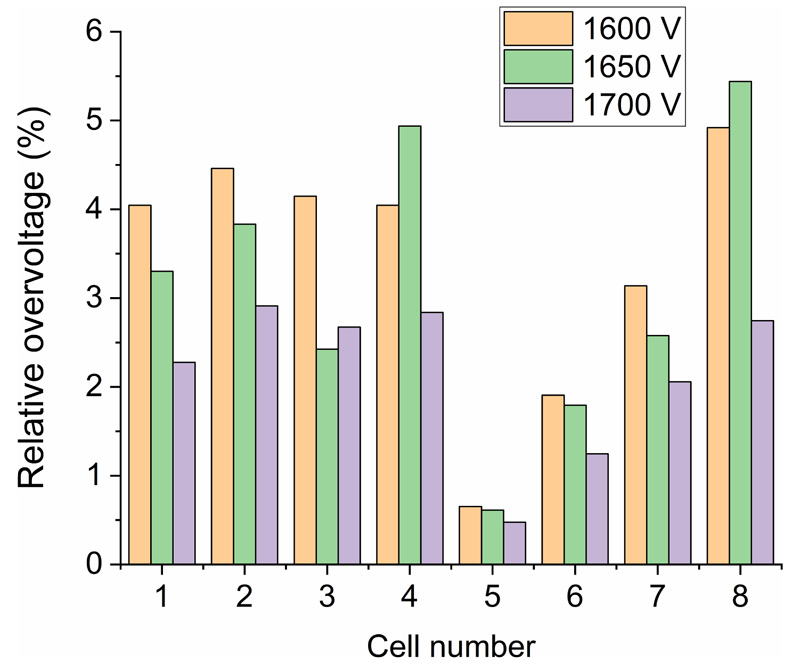
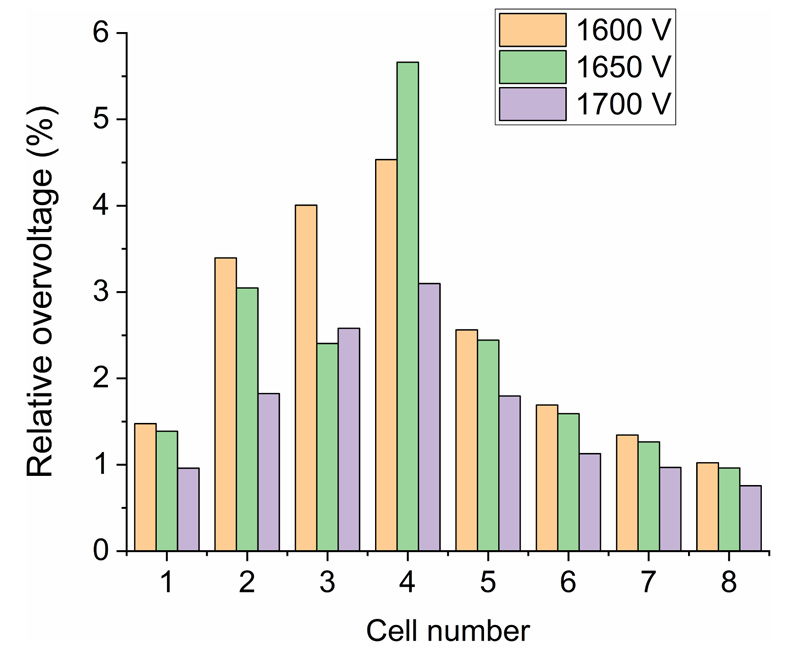
To investigate on the pantograph voltage fluctuation for different configuration of the supply system, the relative peak overvoltage reached in each cell (the cells are shown in Fig. (2) has been computed by the formula V/VESS×100, where VESS is the substation voltage. The behavior of the relative overvoltage along the line for different supply voltages and one reversible substation at La Moraleja is shown in Fig. (4). (Fig. 5) provides the overvoltage behavior when two reversible substations are activated in H-Norte and Las Tablas stations.
Figs. (5 and 6) clearly show the impact of the reversible substation on the voltage fluctuation; limiting the voltage fluctuation in correspondence of the reversible substation to less than 1% (case La Moraleja reversible) and less than 1.5% for the case of two reversible substations at the edge of the line.
Table 2 clarifies the performance of the four considered cases by calculating the ratio of the dissipated energy (Erh) to the total braking energy getting out of traction inverters (Ebr). Since input data are measured for the reference train run, that Ebr value is the same for all four cases. Very interesting is the effect of a small increase of the threshold that triggers the mixed braking (regenerative and dissipative). A small increase of Vthr-low of 50 V, keeping fixed Vthr-high, reduces dissipated braking energy from 13% to 4.8%. This is the proof that a good coordination between actual supply voltage level and threshold level of braking chopper control system can deliver relevant energy savings.
| Case | Total braking energy Ebr [MJ] | Energy dissipated in the rheostat Erh [MJ] |
Ratio % |
|---|---|---|---|
| Mor1 | 40.90 | 1.473 | 3.6% |
| Mor2 | 40.90 | 0.127 | 0.3% |
| Mor3 | 40.90 | 5.413 | 24% |
| Mor4 | 40.90 | 1.949 | 4.8% |
CONCLUSION
The paper has presented a methodology that combines measurement and circuital model for the determination of the impact of reversible substations supplying railway system in terms of energy saving and power quality. The electrical quantities measured at pantograph are the input of the circuital model which solution provides all the electrical quantities of the network. The methodology has been applied to a real metro line. The results have highlighted the impact of the supply voltage level on the energy dissipated by the braking rheostat and the overvoltage amplitude for different position of the reversible substations. Moreover, the paper has highlighted the importance of a good coordination between supply voltage level, imposed by the substations and the threshold levels that manage the operation of the braking chopper. An optimum trade-off can be studied in order to maximize the braking energy recovery.
LIST OF ABBREVIATIONS
| GHG | = greenhouse gas |
| TPS | = Traction Power Station |
| ATO | = Automatic Train Operation |
CONSENT FOR PUBLICATION
Not applicable.
AVAILABILITY OF DATA AND MATERIALS
Not applicable.
FUNDING
None.
CONFLICT OF INTEREST
Dr. Andrea Mariscotti is the Editorial Advisory Board member of the journal The Open Transportation Journal.
ACKNOWLEDGEMENTS
Declared none.

