All published articles of this journal are available on ScienceDirect.

Parametric Study on the Influence of Pedestrians' Road Crossing Pattern on Safety
Abstract
Objective:
The present research concentrates on studying the road crossing time of pedestrians based on their pattern of the road crossing. The factors that influence the road occupancy time due to the irregular road crossing patterns of pedestrians have been studied.
Methods:
The research used a videographic survey of three midblock locations with different land-use types. The pedestrian variables from the video data are extracted to excel using a custom-made video player. The data set consists of 8718 pedestrian data, including all three sites, and the data is analysed using statistical methods. A binary logit analysis is performed to predict the variable influencing the crossing time High/Low.
Results:
According to the analysis, females making path changes and an increase in stage number show a higher road crossing time for pedestrians. Also, the absence of motor vehicles results in a higher road crossing time for pedestrians. The prediction accuracy of the model is 58.2%, and a variance of 6% shows a lesser degree of spread in the dataset.
Conclusion:
The inference from the study is that the crossing time of path-changing pedestrians is more than straight-moving pedestrians. Thus, an increase in road crossing time decreases the safety of pedestrians by increasing the exposure rate while crossing the road. So, the probability of safety risk is high when they practice irregular road crossing patterns.
1. INTRODUCTION
Pedestrians are one of the important elements in the traffic system and are permitted to cross the road at zebra markings. Earlier studies based on unprotected crosswalks show that pedestrian crossing behaviour has a significant effect on pedestrian-vehicle interaction [1]. Pedestrian interaction with motor vehicles creates serious conflict on roads during road crossing activity at crosswalks. Records by National Crime Record Bureau [2] show that 7.7% of pedestrian accidents in India occur due to road accidents. Further, 6% of road accidents in urban areas occurred at pedestrian crossings [2]. According to statistics, in 2020, a pedestrian was killed every 81 minutes in road traffic crashes [3]. Understanding the reason for the pedestrian accident will be the key to solving traffic safety-related issues. The increase in road crashes is due to the unusual behaviour of pedestrians; in most cases, pedestrian-vehicle crashes are not reported. It is reported that pedestrians of all types are always fragile to risk [4]. It is observed that most pedestrian fatalities and injuries at zebra marking are due to the risk-taking behaviour of pedestrians during crossing [5]. Statistics show many pedestrian-vehicle crashes at the midblock crosswalk, due to the vehicles' low-yielding rate at the crosswalk [6]. An earlier observation [7] shows that the midblock crossing is more deadly than the intersection. Also, the illegal crossing behaviour of pedestrians at midblock is studied in china, and developed a conflict model to evaluate pedestrian accident risk [8]. The crossing speed of pedestrians is an essential parameter for designing a facility. Most of the pedestrian models are developed by considering the crossing speed as a variable. It is identified that pedestrian usually changes their speed during road crossing in order to adjust to the varying roadway and traffic environments [9]. When comparing location with the presence and absence of zebra marking, pedestrian making path change is higher at the location without zebra marking [10]. However, due to irregular crossing patterns, the irregular path followed by pedestrians during road crossing will result in calculating the incorrect crossing speed, not the actual speed. This phenomenon has been widely observed among pedestrians at a crosswalk. An alternate approach is needed to calculate the crossing time instead of the crossing speed, with different starting and end points of crossing along the road to address the issue of irregular crossing behaviour.
This study aims to assess the crossing time of pedestrians at the midblock crosswalk by understanding their crossing patterns and other factors. The key elements used in this study are driver-yielding and non-yielding behaviour, stage of crossing, gender, age and pattern of the road crossing. These elements are used to predict the crossing time of pedestrians at uncontrolled mid-block. Further, this study pays attention to Kozhikode district, a city in India located in the southern part of Kerala state.
2. LITERATURE REVIEW
In an earlier study to understand whether pedestrians can accurately estimate the crossing time, a questionary survey was conducted to estimate the time needed to cross the road. The results show that 80% of people underestimate their crossing time [11, 12]. Earlier research shows the total crossing time is calculated considering the waiting time of pedestrians, and this crossing time is predicted using traffic density as input [13 ]. Pedestrian speed is the main factor in designing or evaluating a pedestrian facility. Road crossing can have a chance of collision because the behaviour of pedestrians on the vehicle can cause hazardous circumstances [14]. All pedestrians moving on public transport trips begin and end with walking [15]. Recently, research was carried out to study the pedestrian behaviour pattern with crash risk using simulation-based Virtual Reality technology to improve safety by reducing the risk of the pedestrian crash [16]. Researchers developed a new method, Psychophysics based Gap Acceptance (PGA), to characterise pedestrian crossing beahviour using visual looming and binary logit model [17]. Also, studies have come up with a new Pedestrian Crossing Level of Service (PLOS) to promote the safe and sustainable operation of the pedestrian facility [18].
The road crossing speed of pedestrians differs from the speed of pedestrians walking on the sidewalk. Research on the pedestrian road crossing behaviour with pedestrian gap acceptance at midblock found that the speed of pedestrians has a significant effect on pedestrian gap acceptance [19, 20]. Further, the factors that affect the crossing speed of pedestrians are traffic volume, pedestrian platoon, street type and parking [21]. Also, the researcher has proved that the normal crossing speed of pedestrians differs from pedestrians moving in different weather conditions [22]. Since pedestrian crossing speed is the primary element, several studies have suggested pedestrian speeds for designing the pedestrian facility. HCM [23] suggests 1.1m/s as the crossing speed of pedestrians at the crosswalk for designing any facility, and IRC [24] suggests 1.2m/s for designing any pedestrian facility. Traffic Engineering Handbook [25] suggests 0.98m/s, the Manual of Uniform Traffic Control Devices for Streets and Highways [26] suggests 1.21m/s, and another Australian study suggests 1.2m/s [27]. Research shows that pedestrians alter the crossing speed to avoid conflict with approaching vehicles [28]. Also, study shows pedestrians alter the crossing speed during their activity [29].
Further literature shows that the crossing speed of pedestrians is varied based on age, and there is no greater difference for gender [30]. However, some studies on the effect of gender and age on walking speed conclude that men walk faster than women. Also, young pedestrians move faster than elders [31-35]. Research also shows children behave running during road crossings compared to adults [36]. From the earlier study, the crossing speed of pedestrians is an important element that influences safety. It is understood that the crossing speed of pedestrians was analysed, but they did not consider the variation in crossing speed [37]; instead, pedestrian crossing speed is considered uniform. Also, an earlier study based on simulation shows a variation in the speed of pedestrians during crossing [38]. The study shows that pedestrian crossing speed is compared based on age group and gender. The previous study identifies crossing speed decreases with an increase in the vehicular gap [9]. However, the earlier research does not show the speed variation of pedestrians for a different pattern of the road crossing. The gap identified from the earlier study is crossing speed variation and its significant effect on the path-changing road crossing behavior.
The distance of the pedestrian path while crossing is not the same for every pedestrian, as each of the pedestrians makes a different pattern of the road crossing. Due to the change in a crossing pattern, there is the chance of increased safety risk for the pedestrian because of their increased road exposure. Therefore, a new approach is needed to calculate the road occupancy of pedestrians and evaluate safety by using crossing time.
3. MATERIALS AND METHODS
3.1. Methodology
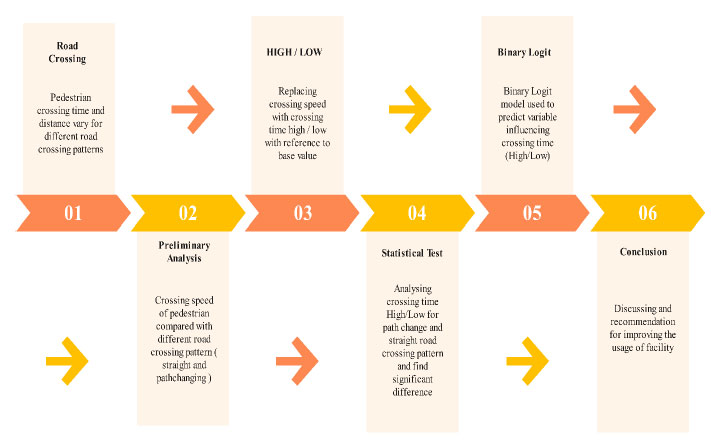
The methodological step followed in the present research is shown in Fig. (1), and the variables considered for analysis are shown in Table 1 . The primary step followed in this study is conducting a videographic survey at locations of different land use types. The second step involves data extraction from the recorded video and removing outliers from the extracted data. The third step involved in this study is conducting statistical analysis to identify the classification of data. In the fourth step, the crossing speed of the pedestrian is converted into crossing time High/Low. This is achieved at each location by assuming a crossing speed of 1.2 m/s for each site, and with reference to this base value, crossing time High/Low is determined. The final step involved predicting the categorical choices crossing time High or Low using the binary logit model. Further, this study helps in identifying the variables which are having a significant influence on the crossing time of pedestrians.
| Variables | Choices | Type |
|---|---|---|
| Driver Yielding | 0- Vehicle existence - nil 1- Driver Yielding- Yes 2- Driver Yielding- No |
Categorical |
| Stage | No units | Ordinal |
| Age | Senior -O Adult - A Young - Y Child -C |
Categorical |
| Gender | Male – M Female - F |
Categorical |
| Crossing Time1 | High/Low | Categorical |
| Crossing Behaviour | Path Change/ Straight | Categorical |
3.2. Road Crossing Time and Safety
The speed of crossing pedestrians is generally calculated by the width of the road and the crossing time. On most occasions, at locations without zebra markings, pedestrians cross the road with an irregular pattern path connecting the starting point and end point on either side of the road. This results in an increased distance of the crossing path than the actual width of the road while crossing perpendicular to the road alignment. In the road safety analysis, the crossing speed of pedestrians is calculated by considering the crossing distance as the width of the road. But the crossing distance of all the pedestrians is not the same due to the irregular path followed by different pedestrians with different start and end points. Further, the irregular pattern crossing, along with lesser yielding of motorised vehicles at locations other than marked crossings, becomes very unsafe for pedestrians. Therefore, it may be more appropriate to have pedestrians' road crossing time as a variable for analysing and evaluating road safety instead of crossing speed.
3.3. Binary Logit Model
Logistic regression can be used in a confirmatory type of approach to test the association between an explanatory variable and a binary outcome in an attempt to better understand factors that affect the outcome. A logit is a natural log of the odds of an event occurring [44].
 |
(1) |
From equation (1), if the odd ratio =1, it shows that as the predictor increases, the probability of occurrence of an event equals the probability of non-occurrence of an event. Also, when the odd ratio >1, it shows that as the predictor increases, the probability of occurrence of an event increases. Finally, when the odd ratio <1, it shows that as the predictor increases, the probability of occurrence of an event decreases. The odd ratio can also be used to measure each variable's contribution in predicting the choices. This statistical analysis is more suitable for predicting binary choices with one outcome.
4. STUDY LOCATION AND VARIABLES
For the present study, the data collection was done at Kozhikode city, located in Kerala state of India.
4.1. Case study of Kozhikode city
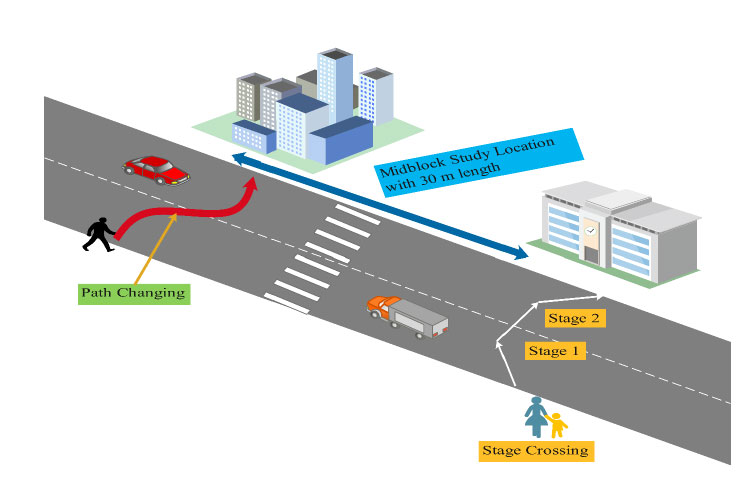
The district of Kozhikode is a fast-developing city with a population of 30,86,293 in 2011, with females 52.34% and males 47.66% [11 ]. Further, the city has a total area of 2,206 sq.km [ 40 ] and constitutes 38.25% of urban areas [ 39 ], and the total number of registered transport motor vehicles as on March 2018 is 69,518, and registered non-transport vehicles is 3,42,515 [41]. Three midblock sites selected from the city with different land use types are considered for the study. The selected midblock location is of mixed land use type located at the center of Kozhikode city. A schematic diagram of a typical midblock location with basic pedestrian behaviour is shown in Fig. (2).
4.2. Description of Selected Variables
The variables considered for the present research are listed in Table 1, description of each variable is shown below:
- Driver Yielding – It represents the driver's charac-teristics in giving way to pedestrians at the zebra crossing location. When a pedestrian tries to cross the road, if the driver on the road reduces the speed and allows the pedestrian to cross indicates driver-yielding behaviour-yes. If the driver does not yield to the pedestrian, it shows the non-yielding behaviour of the driver.
- Stage – This behaviour represents how many inter-mediate points the pedestrians stop during the road crossing activity. The number of intermediate stops represents the number of stages [10], which is shown with an example in Fig. (2).
- Age – In the present study, the data is collected from video data, so the age group of the pedestrian was identified by visual observation, i.e., children (0 – 15 years), young (16 – 25 years), adults (26 – 60 years) and senior (more than 60). The classification of age group is represented as children, young, adults and seniors based on the observation from the video.
- Gender – This represents the classification of a male and female group of pedestrians involved in road crossing activity.
- Crossing Time – The time taken by the pedestrian to cross the road is called crossing time, and it is interpreted with the base crossing speed of 1.2m/s. If the crossing time is higher than the base reference time, it is crossing time High.
- Crossing Behaviour – The behaviour of pedestrians that represents the pattern of road crossing is said by path changing and straight crossing behaviour. Path-changing [10, 42] behaviour occurs if the pedestrian crosses the road in an irregular pattern and reaches the other end of the road. Fig. (2) shows an example path-changing behaviour of a pedestrian. Straight crossing [10] occurs if the pedestrian crosses the road perpendicular without making any deviation at the crosswalk.
4.3. Data Collection
The survey was conducted in the year 2019 on all three selected locations simultaneously for a period of three days on a normal working day. The data was collected using a video camera placed at a suitable vantage point in all locations. The video is recorded during morning and evening peak hours for a duration of 6 hours from the selected midblock locations with a stretch of 15m on either side of the road from the zebra marking. The peak hour in the morning represents 8:30 am to 11:30 am, and the afternoon peak hour represents 3:30 pm to 6:30 pm. The characteristics of selected sites from Kozhikode are shown in Table 2. The selected locations are characteristics of different land-use types; location 1 is near the bus terminal, which is used mostly by commuters travelling inside and outside the city. Also, location 1 provides access to shopping needs. Since location 1 is near the bus terminal, most bus users walk either to the bus stop on the other side or move inside the bus terminal from the bus stop. Location 2 is of mixed land-use type which is used for shopping and health-related activity by the locals. Location 3 is near the hospital zone, which has regular pedestrian and vehicle movement on all working and non-working days. The locations of all the sites have footpaths and zebra marking for pedestrians.
| - | - | Midblock | - |
|---|---|---|---|
| Characteristics | Location 1 | Location 2 | Location 3 |
| Width of the road (m) | 14 | 11 | 14 |
| Availability of Sidewalk | Yes | Yes | Yes |
| Type of land use | Near Bus Terminal | Mixed | Hospital Zone |
| Length of Road stretch | 30 m | 30 m | 30 m |
The recorded video data were analysed through a custom-made tool developed using vb.net, which extract the time of crossing pedestrian and other variables in excel format. The tool can be played forward and backward with reduced player speed to get accurate pedestrian crossing time.
5. PRELIMINARY ANALYSIS
The preliminary analysis identifies the variation in pedestrian crossing speed due to path-changing and straight-crossing behaviour. Further, this identifies the impact of path-changing behaviour on the road crossing time of pedestrians. A total of 8718 pedestrian crossing data were extracted from the recorded data, and it was found that the percentage distribution of males and females is 80.6% and 19.4%, respectively. Further, the proportion of young and adults is higher compared to other age groups. Also, the analysis shows that 69.1% of pedestrians make path change during their road crossing, and 30.9% make a straight crossing.
5.1. Identifying Variation in Crossing Speed of Pedestrians
The road crossing speed of pedestrians is compared with crossing patterns like straight and path-changing behaviour. The result identifies that the mean crossing speed of path-changing pedestrians is 1.26m/s and straight-moving pedestrians' mean crossing speed is 1.56m/s, where the mean speed of path-changing pedestrians is lesser when compared to straight-moving pedestrians. This shows that the crossing speed of path-changing pedestrians is reducing due to increased crossing distance. This indicates that their road contact time is higher due to their increased crossing distance when compared to the straight crossing distance, which reduces the safety of path-changing pedestrians.
The t-test is used to compare the crossing speed of the pedestrian with respect to the crossing behaviour. The Independent sample t-test result shows the p-value is <0.05, which rejects the null hypothesis and concludes that there is a significant difference between the crossing speed of Path change and Straight pedestrian at 5% of significance, t (8718) = -30.479, P=0.000.
5.2. Comparing Crossing Behaviour and Gender with a Crossing Speed
The two-way ANOVA test is conducted to compare the mean crossing speed of pedestrians with respect to gender and crossing behaviour (path change and straight). The descriptive statistics show the mean crossing speed of female pedestrians (straight = 1.47m/s, path changing = 1.27m/s) and male pedestrians (straight = 1.59m/s, path changing = 1.26m/s). The interpretation shows crossing speed of males is higher than females, but the crossing speed of straight-moving pedestrians is higher than path-changing pedestrians. This indicates the road safety of pedestrians irrespective of age group path changing shows a higher exposure to the road than straight moving pedestrians. The ANOVA test shows a 'p-value <0.05, rejects the null hypothesis, and concludes there is a significant difference among the gender and behaviour (path change and straight).
6. STUDY ON CROSSING TIME OF PEDESTRIAN
The previous section's result shows variation in crossing speed due to the path-changing behaviour of pedestrians. So there is a need to find an alternative solution to understand the crossing pattern of the pedestrians. In order to overcome the issue, the crossing time of the pedestrian is compared with the pattern of the road crossing. Since the road width is different for all 3 locations, the crossing time of individual locations is analysed separately.
| - | Sum of Squares | df | Mean Square | F | Sig. |
|---|---|---|---|---|---|
| Location 1 | - | ||||
| Between Groups | 827.813 | 1 | 827.813 | 23.370 | .000 |
| Within Groups | 99784.619 | 2817 | 35.422 | - | - |
| Total | 100612.432 | 2818 | - | - | - |
| Location 2 | |||||
| Between Groups | 140.062 | 1 | 140.062 | 9.859 | .002 |
| Within Groups | 34194.846 | 2407 | 14.206 | - | - |
| Total | 34334.907 | 2408 | - | - | - |
| Location 3 | |||||
| Between Groups | 528.450 | 1 | 528.450 | 17.728 | .000 |
| Within Groups | 103975.155 | 3488 | 29.809 | - | - |
| Total | 104503.605 | 3489 | - | - | - |
| - | N | Mean | Std. Deviation | Std. Error | 95% Confidence Interval for Mean | Min | Max | |
|---|---|---|---|---|---|---|---|---|
| Lower Bound |
Upper Bound |
|||||||
| Location 1 | ||||||||
| Straight | 1212 | 13.48 | 5.777 | .166 | 13.16 | 13.81 | 8 | 40 |
| Path change | 1607 | 14.58 | 6.080 | .152 | 14.28 | 14.88 | 8 | 40 |
| Total | 2819 | 14.11 | 5.975 | .113 | 13.89 | 14.33 | 8 | 40 |
| Location 2 | ||||||||
| Straight | 155 | 11.14 | 3.880 | .312 | 10.53 | 11.76 | 8 | 35 |
| Path change | 2254 | 12.12 | 3.761 | .079 | 11.97 | 12.28 | 8 | 40 |
| Total | 2409 | 12.06 | 3.776 | .077 | 11.91 | 12.21 | 8 | 40 |
| Location 3 | ||||||||
| Straight | 1325 | 14.07 | 5.297 | .146 | 13.78 | 14.35 | 8 | 40 |
| Path change | 2165 | 14.87 | 5.557 | .119 | 14.64 | 15.10 | 8 | 40 |
| Total | 3490 | 14.57 | 5.473 | .093 | 14.38 | 14.75 | 8 | 40 |
6.1. Crossing Time and Crossing Pattern of Pedestrian
A one-way ANOVA test was performed to compare the effect of path-changing and straight-moving pedestrians on crossing time separately for Locations 1,2, and 3. The result of the one-way ANOVA test carried out for Location 1 revealed that there was a significant difference in mean crossing time between the straight crossing and pedestrian crossing with path change (F(1, 2817) = [23.37], p = 0.00). Further, similar results were obtained from the data collected from locations 2 and 3, showing that there was a significant difference in mean crossing time between the crossing behaviour of pedestrians (F(1, 2407) = [9.859], p = 0.002) and (F(1, 3488) = [17.728], p = 0.00) respectively. Tables 3 and 4 show the results of ANOVA result and descriptive statistics based on different locations. It is observed that the mean crossing time for path-changing pedestrians is higher than for straight-moving pedestrians. Apart from the increased crossing time, the non-yielding nature of motor vehicles for pedestrian crossing with path change at locations other than marked crossings becomes more vulnerable to safety issues.
6.2. Crossing time High/Low Based on a Pedestrian Crossing Pattern
The results of the previous section show that the road crossing time is different for path-changing and straight-moving pedestrians. So instead of using the crossing speed, crossing time (HIGH/LOW) with reference to the base condition (crossing time for 1.2m/s) is used in the further analysis. The crossing time base condition is calculated with respect to the width of the road and the speed. If the road width is 14 m, then the base crossing time will be 11.6 seconds with respect to 1.2m/s, and if the observed value is above 11.6 seconds, then the crossing time is High. A chi-square test is conducted to identify the variation in pedestrians' crossing time (High/Low) with respect to behaviour. Further, the dataset is changed by replacing crossing speed with crossing time High/Low. The pedestrian behaviour (path change and straight) with respect to crossing time High/Low is compared by Chi-square test; the result shows a p-value <0.05, so there is a significant difference between crossing time (high/low) and their behaviour. When comparing gender and behaviour, there is no significant difference, but there is a significant difference among the different age groups and behaviour. The results of the stage crossing show that there is a significant difference between the behaviour (path change and straight) and different stages of crossing. Also, the result of driver-yielding behaviour shows a significant difference with respect to the behaviour of pedestrians. Further, the parametric analysis and binary logit model are developed by including crossing time High/Low as a variable instead of crossing speed.
7. PARAMETRIC ANALYSIS
The variables from Table 1 are used in descriptive analysis to compare the crossing behaviour with respect to different land use types.
7.1. Effect of Land Use on Pedestrian behaviour
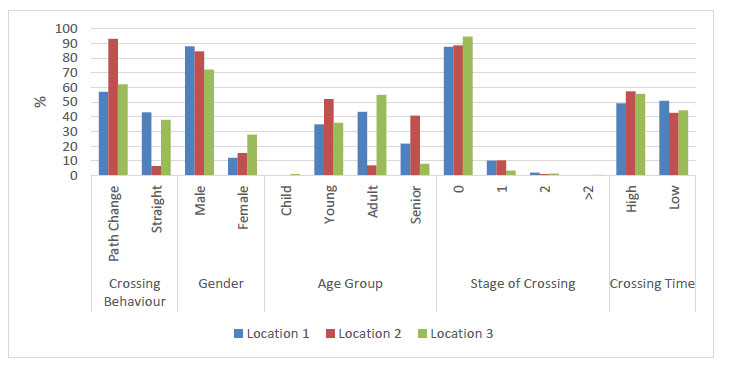
The parametric analysis for location 1 shows that the percentage of pedestrians making path change is 57 and straight crossing is 43. Since the location is near the bus terminal, the pedestrian population in that area is regular or practised road users. Further, the zero-stage crossing behaviour is observed in a higher percentage. When comparing to all locations, the crossing time HIGH is observed to be lesser; this also may be due to the reason that the stage crossing behaviour is less observed. The classification from location 2 of mixed land-use type observes 93.5% of pedestrians make path-changing behaviour. Since location 2 is of mixed land use type, the people using the location of daily users are habituated to make path-changing behaviour. Though the path-changing behaviour is an unsafe pattern of road crossing, it is observed high at location 2, but the percentage is a little lesser at locations 1 and 3. Among all the sites, the percentage of children is very less, and also, in our case, the children are observed in associated with higher age groups. In context with the stage of crossing, nearly 80% of the pedestrian is observed to cross with zero stage crossing, i.e., do not involve in making stage crossing. But a smaller extent of 10% is observed in locations 1 and 2. This zero-stage crossing is a healthier crossing decision due to having fewer encounters with the driver's behaviour. In view of genders, the percentage of males is higher at all the locations. The detailed classification of variables based on different locations is shown in Fig. (3). Further, previous research on the pedestrian crosswalk level of service shows the behaviour of pedestrians changes with respect to different land use types [43]. Also, the study highlights the importance of land use in planning and designing a pedestrian facility. The classification identifies an unequal distribution of pedestrian population for different cases. It is due to the reasons that pedestrians have probabilistic behaviour during all their activities. But the behaviour can be predicted to a reasonable extent using the binary logit model described in the next section.
| - | B [95% C.I. B] | S.E (B) | Wald | Odd Ratio |
|---|---|---|---|---|
| Gender (F) | -.315 [0.65,0.8]Ϯ | .057 | 30.87*** | 0.730 |
| Age Group | - | - | 99.40*** | - |
| Age Group (A) | .27 [1.1,1.4] | .050 | 28.9*** | 1.31 |
| Age Group (C) | .684 [1,3.6] | .308 | 4.92* | 1.981 |
| Age Group (O) | -.332 [0.63,0.8] | .060 | 30.16*** | .718 |
| Stage | -.914 [0.34,0.46] | .078 | 135.564*** | 0.401 |
| Driver Yielding | - | - | 5.773 | - |
| Driver Yielding (Null) | -.201 [0.58,1.13] | 0.167 | 1.44 | 0.818 |
| Driver Yielding (Yes) | 0.00 [0.69,1.44] | 0.187 | 0.00 | 1.00 |
| Crossing Behaviour (Path Change) | -.368 [0.63,0.76] | .048 | 58.115*** | .692 |
| Constant | .385 | .0173 | 4.939* | 1.47 |
*p<.05, **p< .01, ***p<.001, Ϯ - 95% C.I. for EXP(B)
Reference category:
Gender(M), Age Group(Y), Driver Yielding(No), Crossing Behaviour(Straight)
8. BINARY LOGIT MODEL FOR PREDICTING THE CROSSING TIME (HIGH/LOW)
The binary logistic regression model is used in our study to predict the crossing time (low) choices with respect to other variables. By considering the set of variables from Table 1, the choices are predicted using statistical analysis software, and the details of the model results are shown in Table 5. The logistic regression analysis result shows that there is a significant influence of age group and crossing behaviour on crossing time Low (χ2 (8) = 425.6, p < .001). The model explained with 6% variance in crossing time (Negelkerke R2) and was able to identify 58.2% of cases accurately.
The sensitivity of the model was 50.9%, and the specificity of the model was 64.4%. The reference categories for each categorical variable are male for gender, young for age group, driver yielding (No) for driver behaviour, and straight crossing pattern are reference variables for crossing behaviour. The results show that for every unit decrease in stage number, the odds for getting crossing time is low, i.e., 0.401 times respectively. As further compared to young pedestrians, the odds of having crossing time low for adult and child age groups is 1.31 times and 1.981 times, respectively. With reference to young pedestrians, the odds of having a (low) crossing time for the senior pedestrian is 0.718 times lesser. With reference to male pedestrian female pedestrians, the odds of making crossing time (low) is 0.73 times lesser. With reference to straight crossing behaviour for path change behaviour, the odds of making crossing time low is 0.692 times lesser.
9. DISCUSSION
Road crossing activity by pedestrians is one of the important and inevitable road activities involved with higher safety risks for pedestrians. The level of risk associated with road crossing depends upon the extent of using the marked crossing facility and the crossing pattern followed by the pedestrian. The pedestrian performing path change behaviour during road crossing is undisciplined activity. Also, when they try to cross in such an irregular pattern, the road exposure time increases with an increase in the vehicle-pedestrian conflict leading to safety reduction. The pedestrian crossing speed is replaced with crossing time High/Low for evaluating the effect of path-changing behaviour. The present study confirms that other variables positively influence the crossing time “High”. Whenever crossing time “High” is noticed, it indicates that the road exposure of pedestrians is high during crossing activity. So, pedestrian road crossing time High/Low can be used as a reference to study the road exposure risk of the pedestrian. This increase in road exposure increases the probability of pedestrian-vehicle conflict.
9.1. Effect of Gender on Crossing Time
The analysis of mean crossing time at study location 1 shows that female pedestrians require 5.2% higher crossing time than the male group. Similarly, the mean crossing time of female pedestrians was observed to be 1.89% and 2.14% higher than the same for male pedestrians at locations 2 and 3, respectively. With reference to male pedestrians, every unit increase in female pedestrians will result in road crossing time (High). The study identifies that with an increase in female pedestrians, the chance of having crossing time (Low) decreases. When comparing males and females, it is observed that the female gender is exposed for a longer time at a crosswalk. Also, an earlier study shows that the crossing speed of females is lesser than males [45].
9.2. Effect of Age on Crossing Time
The results of the analysis of the age of pedestrian crossing at location 1 show that the mean crossing time of senior pedestrians is 12.13% higher than young, 29.84% higher than children, and 19.38% higher than adult groups. The same has been observed as 13.76%, 23.21% and 19.81% higher while comparing with young, children and adult groups at location 2 and 5.54%, 21.68% and 2.97% higher at location 3 for young, children and adult pedestrians, respectively. From the result with reference to young pedestrians, the increase in senior pedestrians results in higher road crossing time. In case of an increase in adult and child pedestrians, the crossing time is lesser when compared with a young pedestrian. When there is an increase in senior pedestrians, the chance of having crossing time (Low) decreases, which leads to greater road exposure than other age groups. The earlier study by [31] confirms the senior pedestrian crossroad at a lesser speed. Further, there is an unequal distribution of the population of different age groups due to the location of land-use type. Moreover, the percentage of children is very low, and they perform crossing activities in association with elders.
9.3. Effect of Stage behaviour on Crossing Time
The stage crossing behaviour is observed when the road has more lanes. In our study, increasing stage number results decrease the chance of crossing time (Low). Our present study shows the increase in the stage is observed with an increase in road crossing time. This can be interpreted as road exposure increases with an increase in stage number. But in our case, the maximum road width is 14m; hence, stages number greater than two are observed in a very low proportion. Further, earlier studies on stage crossing show stage crossing is an important parameter in analysing the crossing behaviour [46].
9.4. Effect of Driver yielding on Crossing Time
The yielding behaviour of drivers has a greater impact on pedestrian-safe road crossing. Based on our analysis, the vehicle absence circumstance shows a road crossing time (High) for pedestrians. This high road crossing time is due to the reduced crossing speed adopted by the pedestrian in the absence of a motor vehicle. But the result of earlier works shows that an increase in pedestrian platoon size increases driver-yielding behaviour during road crossing [47].
9.5. Effect of Crossing pattern on Crossing Time
The crossing pattern is a variable represented as straight and path-changing behaviour, whereas path change represents an irregular pattern of road-crossing behaviour. An increase in path change behaviour results in road crossing time (High) for pedestrians. It shows that crossing time is higher when the pedestrian makes a path-changing pattern of the road crossing. The earlier study [46] shows the safety margin is very lower when they make an oblique pattern of road crossing than straight road crossing. The oblique pattern of road crossing is also a type of path-changing behaviour observed at the crosswalk.
9.6. Safety Recommendations
The path change is observed to be an unsafe method of road crossing, but it is mandatory to improve road user's safety by implementing suitable policies. As per the regulation given by the central motor vehicle act [ 48 ], motorists should give way to the person crossing the road when it is not regulated by a traffic light or traffic police at a zebra marking. The driver should show courtesy and consideration for the safety and convenience of users by anticipating their behaviour. The law describes that the driver should yield at the zebra marking area. But in our study, an increase in path change behaviour results in increased road crossing time for pedestrians. This is due to the irregular pattern followed by pedestrians during the road-crossing activity. Enforcing new policies could increase the safety of pedestrians crossing the road and other road users. Also, recent statistics show 6% of road accidents in urban areas occur at pedestrian crossings [2]. According to statistics, a pedestrian was killed every 81 minutes in traffic crashes in 2020 [3]. Further, the previous study observed the path change is greater at the location without zebra marking [10]. To overcome this undisciplined crossing behaviour and increase road user safety, providing guard rails at the median and footpath other than zebra marking locations can be an effective solution for the issue, even though it involves considerable expenditure. Also, the location where guard rails cannot be provided is recommended to provide easily identifiable footpath marking indicating the locations of zebra marking facilities. The footpath marking could guide the pedestrian to nearby zebra marking, which psychologically drives the pedestrian to use the zebra marking location.
CONCLUSION
The study identifies the variable influencing the crossing time High/Low for pedestrians at midblock crosswalks. Also, when comparing the average pedestrian crossing time, it is observed that female pedestrian crossing time is 3.53% higher than male at all study locations. When comparing all age groups, senior pedestrian crossing time is higher than 6.25%, 10.42% and 5.48% than adults, children and young age groups, respectively, at all study locations. Further, the logit model result shows an increase in stage number increases the road crossing time of pedestrians. The study identifies that the road crossing time of path-changing pedestrians is more than straight-moving pedestrians. This increase in road crossing time decreases the safety of pedestrians by increasing the exposure rate while crossing the road. Therefore, the probability of safety risk is high when they practice irregular crossing patterns of the road crossing. The model prediction accuracy is 58.2%, and Negelkerke R2 in the model explains a 6% variance in crossing time Low and High. Recent research results show the severity of conflict increases with a decrease in pedestrian crossing speed [49].
In summary, this study analysed the effect of path-changing crossing behaviour by pedestrians at a midblock crosswalk. It is recommended to consider crossing time High or LOW as a variable instead of crossing speed in locations observed with path-changing behaviour. Further, the research can be extended by studying the influence of vehicle characteristics and environmental conditions like crossing during night and rainy conditions. Also, there is a need to evaluate the performance of the facility after implementing the guard rails and footpath marking. The functional effectiveness of the recommendations of the present study can be assessed by conducting the performance evaluation of locations provided with those facilities. The limitation of the study is the age of the pedestrian identified by visual observation from the video data.
AUTHOR CONTRIBUTIONS
Conceptualisation, Prakash. S.; methodology, Prakash. S.; formal analysis, Prakash. S.; writing—review and editing, Prakash. S., K.Karuppanagounder.; visualisation, Prakash. S., K.Karuppanagounder.; supervision, K.Karuppanagounder.
AVAILABILITY OF DATA AND MATERIALS
Not applicable.
CONSENT FOR PUBLICATION
Not applicable.
FUNDING
None.
CONFLICT OF INTEREST
The authors declare no conflict of interest, financial or otherwise.
ACKNOWLEDGEMENTS
The authors sincerely thank the support from the Centre for Transportation Research, Department of Civil Engineering, National Institute of Technology Calicut, a Centre of Excellence setup under FAST Scheme of MHRD, Govt. of India.

