All published articles of this journal are available on ScienceDirect.

Comparing Eye-tracking System Effectiveness in Field and Driving Simulator Studies
Abstract
Background:
Several studies have been conducted by combining the benefits of eye-tracking systems with driving simulators to simultaneously investigate driving behavior and the potential source of distraction. However, little effort has been made in terms of eye-tracking validation in the driving simulator environment.
Objective:
The overall aim of this study is to validate an eye-tracking system within the context of a driving simulation environment by considering a specific urban context application.
Methods:
A field survey and a driving simulation experiment were conducted for a case study in Rome, Italy. The selected real road sections and events were reproduced on the driving simulator system. An eye-tracking system was used to record eye movements both on a real vehicle and the simulator. The eye movements of 14 participants in the field survey and 18 participants in the driving simulation tests, as well as their driving performances, were collected while approaching an urban intersection in relation to two specific road events: i) the presence of a speed limit sign and ii) the presence of a crossing pedestrian.
Results:
Eye tracker parameters and driving performances were compared between the real driving tests and driving simulator experiments in order to validate the eye-tracking system. It was validated for both events in terms of duration and distance of the eye fixation.
Conclusion:
The results demonstrated that an eye-tracking system is an effective tool for studies and applications in a virtual reality environment.
1. INTRODUCTION
Eye-tracking has been widely used for decades in vision research, language, and usability [1]. The first attempts to automatically track eye movements were conducted in the late 1900s. At that time, the apparatus seemed to be quite invasive and without adequate precision. In road engineering, the eye-tracking system has been used for both on-field and driving simulation studies. The eye-tracking tool allows researchers to investigate the drivers' attention allocation and their visual strategies, as well as to understand whether and to what extent the road and roadside features can attract or distract the drivers’ attention, with significant effects on their driving behavior and performance and, accordingly, on road safety. More specifically, some previous studies have been carried out to investigate the effects that cognitive tasks of different commitments have on driving activities [2] and to evaluate the timing and understanding of the message transmitted by a given signal [3-5]. Based on the findings of these studies, the current research set, for example, some features of its design, such as the minimum attention thresholds to consider valid fixation. The overall advantage of using an eye tracker is that different parameters regarding eye movement toward visible stimuli in the environment can be measured, such as eye fixations and saccades. Nowadays, using such an instrument can play a strategic role in evaluating driving behavior. Finally, several studies have been carried out by combining the benefits of the eye-tracking system with driving simulators or real tests on instrumented vehicles to simultaneously investigate driving behavior and the potential sources of distraction [6-10]. However, little effort has been made to validate the eye-tracking tool in the driving simulator environment.
2. AIM AND OBJECTIVES
The overall aim of this study is to validate an eye-tracking system within the context of a virtual reality driving simulation environment by considering a specific urban context application. The validation of the system has been carried out by a comparison between the eye movements measured in real driving along a road section with those recorded in the same road environment reproduced in a driving simulator. In addition, some key objectives are set out by comparing the driving simulation and the on-field study: validating the simulator for speed measures specifically in a typical urban environment while approaching and crossing an intersection. Considering the experiences conducted so far, this study aims to provide a significant contribution to using the eye-tracking system within the context of both real driving and virtual reality driving simulation.
3. METHODOLOGY
A reliable methodology, widely used in literature studies [11-13], was applied to compare driving simulation and on-field tests. Specifically, a field survey was conducted for a case study in Rome, Italy, due to the equipment based on an eye-tracking system implemented in an instrumented vehicle. The same selected road section and events were then replicated on the fixed-based driving simulator system at the virtual reality laboratory at the Department of Engineering of Roma Tre University, and the data collected was compared to the data collected during the field survey to validate the eye-tracking system for driving simulation applications.
3.1. Equipment
The equipment used for this research comprised an eye-tracking system, a driving simulator, and an instrumented vehicle specifically used for field surveys. The characteristics of the tools are described below.
3.1.1. Eye-Tracking
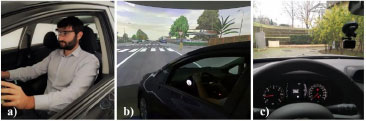
Eye movements were recorded by the Tobii eye-tracking system of the Laboratory of Road Safety at the Department of Engineering of Roma Tre University (LASSTRE) (Fig. 1a). The Tobii eye-tracking system consists of a pair of glasses with a full HD wide-angle scene camera on the front of the glasses and two eye cameras per eye. In addition to these cameras, the glasses are equipped with a gyro and an accelerometer. Tobii glasses provide a full-HD scene camera with a vast field of view comparable to the wide image of the driving simulator, allowing all aspects of the driving environment to be captured. The outcomes of the eye-tracking system are related to the blinking behaviour, first fixations in terms of distance and duration, and static or dynamic Areas Of Interest (AOI) in order to select part of the driver’s view.
3.1.2. Driving Simulator
The driving tests were performed using the fixed-based driving simulator of LASSTRE (Fig. 1b). The virtual reality laboratory is equipped with a STISIM driving simulator, placed in a full-cab Toyota Auris that has been converted into a driving simulator by removing all the unnecessary mechanical parts and replacing them with electronic systems connected to a workstation. The driver's feedback is controlled by a force-feedback steering wheel, brake, and accelerator pedals. Three projectors ensure a wide image with a 180° field of view on a curved screen located in front of the vehicle. The resolution of the visual scene is 1920 x 1200 pixels with a refresh rate of up to 60Hz. Road environmental sounds, such as the actual engine as well as those of the other vehicles, are reproduced in the vehicle to improve the realism of the test. The driving simulator is a very useful tool in the field of road and infrastructure engineering, capable of investigating how different factors, both external and internal to the driver, may affect the perception of driving risk [14].
Using a driving simulator has several benefits, as the costs are considerably lower than in field studies, and the tests are reproducible for all the samples of drivers with the same simulated events and in a controlled environment. The reliability of the tool has been completely validated in previous studies, typically in a rural environment, for speed and trajectory measures [15, 16]. However, further efforts should be directed toward the urban environment.
3.1.3. Instrumented Vehicle
An instrumented (equipped with different tools) vehicle was used for the field survey (Fig. 1c). Specifically, the vehicle was equipped with a GPS and a high-resolution camera. This equipment's integration allowed for the recording of the driver's front view as well as the evaluation of driving performance during actual driving tests.
3.2. Case Study
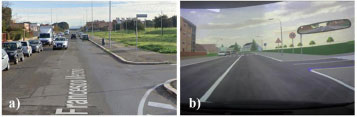
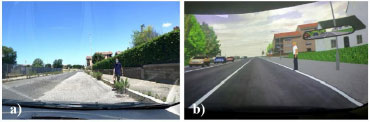
The case study for the field survey and then reproduced in the simulated environment was conducted at an urban intersection located in Rome. The road cross-section was 18.00m, comprising a carriageway with one lane in each driving direction (each lane was about 4.00m) and both-side sidewalks of about 5.00m. In some sections, some parking areas (2.50 x 6.00m) were designed by restricting the sidewalks to 2.50m. In order to improve the level of realism of the simulation and its similarity with the real case, the intersection was implemented in the driving simulation environment by reproducing the same typology, the number of branches, the directions, and the markings and vertical signs. Moreover, concerning the same interference with the driver, all the vehicles that interacted with the drivers at the intersection, both in the on-field and simulated environment, were controlled by the experimenters. In the case of the field survey, the interfered vehicle was driven by an assistant experimenter. In addition, a series of elements and features were included in the simulated scenario, such as boundary conditions, markings and vertical signs, vegetation, buildings, green areas, and other vehicles. The entire route was 4500m, designed as a circular pattern; two road events, one static and another dynamic, were designed in order to assure the same driving conditions both in the field survey and the simulation experiment: i) the presence of a speed limit sign (two signs along the route), and ii) the presence of a pedestrian who crossed the road. Specifically, the speed limit was 30km/h, and the crossing pedestrian event was designed both in the field survey and the simulated environment in order to have the pedestrian out of the markings in the driver's view at a longitudinal distance of 300m and a lateral distance of 7.5m. Furthermore, when the driver was 100 meters from the pedestrian, he/she started crossing down the road at a speed of about 3.6km/h. However, the driver was not aware of the time when the pedestrian started crossing. It was preferred to study the case of a pedestrian crossing the road out of the marking in order to investigate the driver’s response in a more demanding condition. (Figs. 2 and 3) show the realism of the virtual reality simulation by referring to the two designed events: the presence of a speed limit sign and a crossing pedestrian.
3.3. Participants
For both the on-field and simulator studies, a sample of volunteer drivers was recruited at the Department of Engineering of Roma Tre University, with three selection criteria: over 18 years of age, at least 3 years of licensed driving experience, and unfamiliar with the test site. Twenty-two drivers participated in the real driving and simulation experiments (15 men and 7 women, ages ranging from 22 to 59 years, with a mean age of 31.9 years). In the real tests, eight participants were excluded from the analysis due to technical issues related to the equipment. According to the Chauvenet criterion [17] applied to the speed data, no drivers were identified as outliers and excluded from the analysis. As a result, the final sample included 14 drivers (9 males and 5 females) with an average age of 27.7 years (SD = 9.3). Instead, in the driving simulation tests, four participants were excluded from the further analysis of the data because they experienced symptoms related to simulation sickness. The Chauvenet criterion [17] applied to the speed data reported no outliers. As a result, the final sample included 18 drivers (12 males and 6 females) with an average age of 30.3 years (SD = 10.1).
3.4. Procedure
For each driver, the same test procedure was applied. Both driving tests (field and simulation survey) lasted approximately 50 minutes, with the order being randomized between participants to avoid bias in the results due to the sequence of the drives. During both experimental tests, the drivers were free to choose the speed and generally the driving behaviour, based on their safety perceptions and knowledge of the speed limit along the route. In the simulation test, the participants first drove a training scenario to familiarize themselves with the driving simulator. The training scenario included several situations to allow the driver to test the manoeuvres and obtain feedback from the driving controllers before performing the tests. In addition, the participants had to fill out two questionnaires: the first, before the training, to provide basic information, such as socio-demographic background, age, and driving experience; and the second, after completing the tests, to sign an informed consent form and provide any additional information on simulation sickness to investigate the driver’s discomfort during the test and gain insight into the experience of simulated driving.
3.5. Data Collection
Eye movement data, such as distance and duration of the first fixation, and driving speed profiles at the approach to the events were collected, analyzed, and compared between the two drives, in the real environment and the simulation environment, in order to study the differences in driver behavior in terms of both driving performance and eye movements. Due to the eye-tracking system, some acknowledged indicators [4, 6-10] were collected and studied. More specifically, the first fixation was investigated in terms of duration and distance. According to the literature, the first fixation is the first pause of the eye movement in a specific area of the visual field [4, 6]. For this purpose, two dynamic AOI were designed to enclose drivers’ views around the speed limit sign and the pedestrian and to monitor the eye movement parameters in these areas. It should be mentioned that a filter was applied at the first eye data processing to consider only the eye movements over a value of 30ms. According to the literature [4, 6], eye fixations differ from saccades, which are rapid movements between fixations (typically 30ms). Furthermore, speed is considered an effective safety indicator because of its positive correlation with crash risk [18]. According to the World Health Organization [19], as the average speed decreases, the risk of road crashes and their severity also decreases. As a result, speed data analysis is an effective and important tool for understanding and interpreting driving and eye movement behavior [20]. Consequently, drivers’ speed profiles were collected and analysed from 50 meters before the intersection in both the simulation and real driving.
4. RESULTS AND DISCUSSION
4.1. Speed Limit Observation
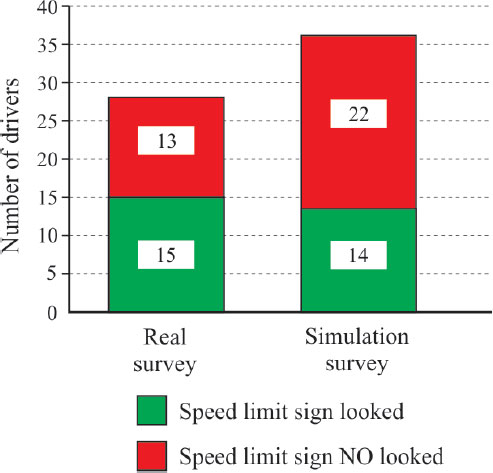
The comparison between the number of times a speed limit sign (there were two speed limit signs along the route) has been looked at by the drivers (Fig. 4) revealed that in the field survey, in around 50% of the total cases (28), the drivers looked at the sign; in the simulation, this percentage was lower than 40% considering a higher number of total cases (36), being the sample composed by 18 valid participants instead of 14 resulted in the field study after the data validation phase. Therefore, the analyses of both the distribution of the values and the statistical validation of the average values were carried out, where at least one fixation on the sign per driver was recorded (Fig. 5). By comparing the distribution of fixation durations (Fig. 5a) and distances (Fig. 5b), it is possible to notice the following: the fixation duration is not considerably different between the two samples. The average value is 295ms in the real survey and 366ms in the simulation survey; accordingly, also the fixation distance is quite similar in the two samples. The average value is around 60 meters in both cases, namely 10 meters after the first point where the sign was visible; the standard deviation of the two samples is different for both the fixation duration and distance. Specifically, the standard deviations of the real survey are higher than in the simulation. This difference could be due to better visibility of the sign in the simulation scenario that allowed the driver to see it earlier and correctly interpret the sign. In addition, a t-test was carried out in order to check the statistical differences among the samples (Table 1). From preliminary analyses of boxplots, no outlier was identified in relation to the fixation durations. Furthermore, this parameter followed a normal distribution in both samples, as verified by the Shapiro-Wilk test (p > 5%).
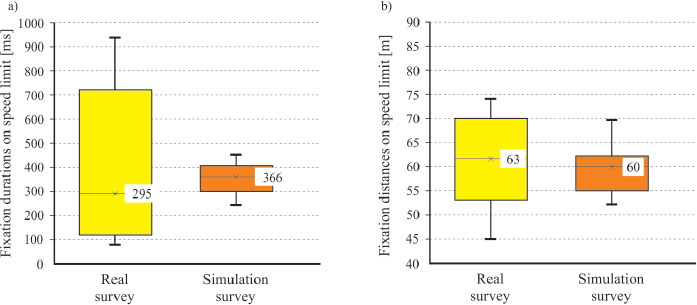
The difference between the average values of the fixation duration was not statistically significant (t (27) = 0.77; p = 0.44). Accordingly, concerning the speed limit observation, no significant differences in the fixation duration have been recorded between the real and simulated experiments. In terms of the duration of the eye fixation, this finding verifies the validity of the eye-tracking technologies used in the virtual reality driving simulation experiment. Accordingly, the same analysis was carried out for the fixation distance (Table 2). From preliminary analyses of boxplots, no outlier was identified in relation to the fixation distances. Also, for this parameter, the fixation distance followed a normal distribution in both samples, as verified by the Shapiro-Wilk test (p > 5%). The difference between the average values of the fixation distance was not statistically significant (t (27) = 0.51; p = 0.62). Accordingly, also in this case, no significant differences have been revealed in the fixation distance between the real and simulated experiments. This finding confirmed the validation of the eye-tracking systems for the experiment in virtual reality driving simulation in terms of the distance of the eyes' fixation.
4.2. Crossing Pedestrian Analysis
In terms of the crossing pedestrian's fixation, a comparison of real and simulation surveys in terms of fixation durations and distances was conducted 100 meters before the crossing pedestrian's location. In contrast to the analysis of the static object (speed limit sign), the pedestrian, which could be considered a dynamic object, was observed by all the drivers, both in the real environment and in the simulation survey. In both the real and simulation surveys, Fig. (6) shows the distribution of fixation durations and distances on the crossing pedestrian. It is possible to notice the following by comparing the distribution of fixation durations (Fig. 6a) and distances (Fig. 6b): the average values of the fixation durations were different between the real and the simulation surveys (1848ms in the real survey and 6053ms in the simulation tests). This difference could be due to the uncertain behavior of the pedestrian in simulation as it was more difficult than in the real case to determine the intentions of the pedestrian by his/her movements; in fact, in the real case, the pedestrians were typically determined and focused on crossing the road, and it could be easily detectable by looking at their movements (head, legs, arms) and eyes fixation. Instead, the fixation distance was quite similar in the two samples (89m in the real survey and 95m in the simulation tests); the standard deviation of the two samples was different between the real and the simulation surveys; regarding the fixation durations, the standard deviation of the simulation survey was greater than the real one. In contrast, the real survey's standard deviation was higher than the simulation's regarding fixation distances. In addition, a t-test was carried out in order to check the statistical differences among the samples (Tables 3 and 4). From preliminary analyses of boxplots, 7% of outliers in fixation duration data were found in the real experiment. The fixation duration followed a normal distribution in both samples, as verified by the Shapiro-Wilk test (p > 5%). In this case, the difference between the average values of the fixation duration was found to be statistically significant (t (29) = 7.52; p = 0.00).
| - | Average (ms) | Standard Deviation | Number of Observations | Outliers | Normality | t-test | |||
|---|---|---|---|---|---|---|---|---|---|
| W | P | DOF | t | p | |||||
| Real survey | 295 | 336 | 15 | 0% | 0.867 | 5% | 27 | 0.77 | 44% |
| Simulation survey | 366 | 71 | 14 | 0% | 0.962 | 80% | |||
| - |
Average (m) |
Standard Deviation | Number of Observations | Outliers | Normality | t-test | |||
|---|---|---|---|---|---|---|---|---|---|
| W | P | DOF | t | p | |||||
| Real survey | 63 | 10.3 | 15 | 0% | 0.939 | 40% | 27 | 0.51 | 62% |
| Simulation survey | 60 | 7.3 | 14 | 0% | 0.942 | 50% | |||
| - | Average [ms] | Standard Deviation | Number of Observations | Outliers | Normality | t-test | |||
|---|---|---|---|---|---|---|---|---|---|
| W | P | DOF | t | p | |||||
| Real survey | 1848 | 948.8 | 13 | 7% | 0.941 | 50% | 29 | 7.52 | 0% |
| Simulation survey | 6053 | 2261.3 | 18 | 0% | 0.976 | 90% | |||
| - |
Average [m] |
Standard Deviation | Number of Observations | Outliers | Normality | t-test | |||
|---|---|---|---|---|---|---|---|---|---|
| W | P | DOF | t | p | |||||
| Real survey | 89 | 14.1 | 12 | 14% | 0.868 | 8% | 27 | 1.89 | 10% |
| Simulation survey | 95 | 5.1 | 17 | 6% | 0.927 | 30% | |||
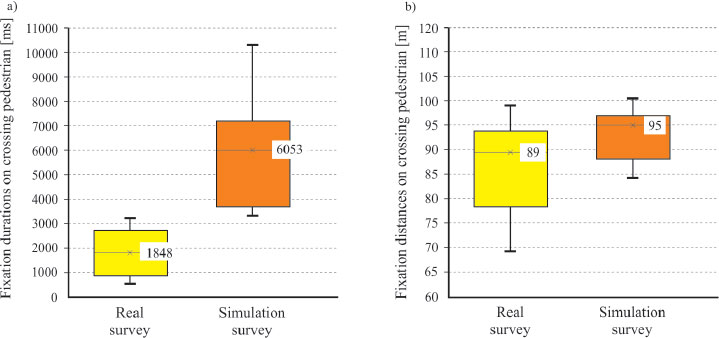
Accordingly, the same analysis was carried out for the fixation distances (Table 4). From preliminary analyses of boxplots, 14% of outliers in fixation distance data were found in the real experiments, while 6% of outliers were found in the simulation experiments. Furthermore, this parameter followed a normal distribution in both samples, as verified by the Shapiro-Wilk test (p > 5%). The difference between the average values of the fixation distance was not statistically significant (t (27) = 1.89; p = 0.10). Accordingly, concerning crossing pedestrian analysis, no significant differences in the fixation distance were recorded between the real and simulated experiments. This finding confirmed the validation of the eye-tracking systems for the experiment in virtual reality driving simulation in terms of the distance of the eyes' fixation and also for dynamic objects like pedestrians.
| - | Survey | Average [km/h] | Standard Deviation | Number of Observations | Outliers | Normality | t-test | |||
|---|---|---|---|---|---|---|---|---|---|---|
| W | P | DOF | t | p | ||||||
| -50m | Real | 39 | 3 | 26 | 4% | 0.965 | 50% | 60 | 1.04 | 31% |
| Simulation | 41 | 10 | 36 | 0% | 0.975 | 60% | ||||
| -10m | Real | 19 | 2 | 19 | 7% | 0.963 | 80% | 53 | 1.81 | 8% |
| Simulation | 16 | 7 | 36 | 0% | 0.936 | 6% | ||||
| - | Survey | Average [km/h] | Standard Deviation | Number of Observations | Outliers | Normality | t-test | |||
|---|---|---|---|---|---|---|---|---|---|---|
| W | P | DOF | t | p | ||||||
| -50m | Real | 40 | 3.6 | 13 | 7% | 0.934 | 40% | 29 | 1.66 | 11% |
| Simulation | 37 | 7.2 | 18 | 0% | 0.904 | 8% | ||||
| -10m | Real | 21 | 0.6 | 10 | 29% | 0.956 | 70% | 26 | 1.31 | 21% |
| Simulation | 18 | 6.7 | 18 | 0% | 0.962 | 60% | ||||
4.3. Speed Analysis
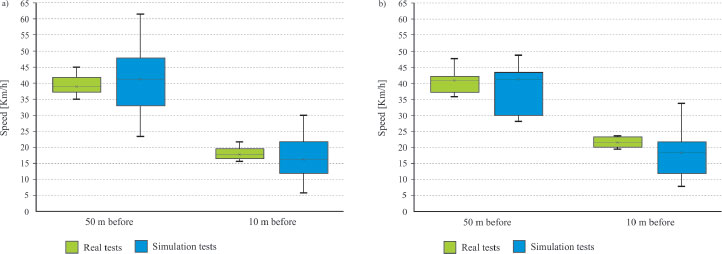
As mentioned before, some previous studies have addressed driving simulator validation in a rural context by comparing speed profiles in real and simulation surveys [15, 16]. However, few efforts have been made to validate the driving simulator in an urban context, specifically while approaching an intersection. in this regard, drivers' speed values have been plotted and studied in two different sections: 50 meters and 10 meters before the “intersection point”. it should be noted that the speed comparison was performed by choosing the two turning manoeuvres (manoeuvre 1 left-turn and manoeuvre 3 right-turn) that could be considered the most critical conditions in the context of an intersection. Fig. (7a and b) clearly show that the distributions of values between the two sections and the two manoeuvres were comparable. the following considerations can be applied: speed trends were approximately the same in the two manoeuvres; specifically, lower speeds were recorded close to the intersection. in both sections, the speed differences between the real and simulation surveys were small (5km/h). This finding demonstrated that risk perception is similar in the real environment and the simulation experiments. In the real survey, the standard deviation was very low (10km/h) in both the manoeuvres and the sections. On the contrary, in the simulation context, these values reached more than 35km/h. This could be due to drivers in the simulated driving environment having varying speed perceptions.
A t-test was carried out in order to check the statistical differences among the samples. From preliminary analyses of boxplots, outliers in speed data related to manoeuver 1 were found only in the real experiment, specifically 4% at 50 meters and 7% at 10 meters. Furthermore, this parameter followed a normal distribution in both samples, as verified by the Shapiro-Wilk test (p > 5%). The difference between the average values of speed data was not statistically significant in both sections (t (60) = 1.04; p = 0.31 at 50 meters; t (53) = 1.81; p = 0.08 at 10 meters), as reported in Table 5. Therefore, this finding confirmed that the simulator is a very efficient tool for investigating drivers’ behavior in terms of speed and also in approaching intersections that involve left-turn manoeuvres [14].
Accordingly, for manoeuvre 3, the same analyses were replicated, and the results were found to be comparable. Table 6 shows that data samples followed a normal distribution, as verified by the Shapiro-Wilk test (p > 5%). Also, in this case, the difference in the average values of speed data was not statistically significant in both the sections (t (29) = 1.66; p = 0.11 at 50 meters; t (26) = 1.31; p = 0.21 at 10 meters), confirming the previous validation obtained for manoeuvre 1.
CONCLUSION AND FUTURE RESEARCH
This study examined an application of an eye-tracking system in a real and simulated driving environment in order to validate the tool in driving simulation concerning the urban context. Eye movements were measured and compared in real driving along a road section with those recorded in the same road environment reproduced in a driving simulator. Drivers’ behaviors and reactions in both driving contexts were analyzed with respect to the presence of a speed limit sign and a crossing pedestrian. Furthermore, a speed analysis at the approach of an urban intersection was carried out to compare the drivers’ behaviors in real and simulation driving and achieve the set key objective, namely validating the simulator for speed measures specifically in typical urban environments. The eye-tracking system has been confirmed as a very effective tool for understanding and studying drivers’ visual behavior in a simulated driving environment. Statistical findings showed that, especially for static objects, the driver's response in real and simulated driving is the same in terms of fixation distance and duration. Finally, with respect to speed, the findings confirmed the validation of the simulator to investigate drivers’ behavior in terms of speed and also in approaching an intersection where critical manoeuvres, such as crossing and turning, are performed by the drivers. In future research, the investigated case study can be further conducted with different additional features. The sample of participants could be expanded to consider a greater sample size and include other age classes, both young and old drivers, whose visual strategies could be quite different. Moreover, the behavior of drivers who have already experienced the use of the eye-tracking system in the driving simulation environment will be studied for other case studies and events both in urban contexts and in other road environments (rural roads, highways) that involve different visual stimuli and further details and analysis on eye movement and driving data can be provided. Lastly, different eye-movement indicators will be explored to describe in detail the drivers’ visual behavior.
CONSENT FOR PUBLICATION
Asigned informed consent was obtained from the participants.
AVAILABILITY OF DATA AND MATERIALS
The data that support the findings of this study are available on request from the corresponding author [A.C].
FUNDING
The study is funded by the MIUR, in the frame of the “Departments of Excellence Initiative 2018–2022”, attributed to the Department of Engineering of Roma Tre University.
CONFLICT OF INTEREST
Dr. Alessandro Calvi is the editorial advisory board member for The Open Transportation Journal.
ACKNOWLEDGEMENTS
The authors would like to acknowledge MIUR for financially supporting this study.

