All published articles of this journal are available on ScienceDirect.

Factors Affecting Public Transportation Ridership in a High-income Developing Country
Abstract
Background:
In rich developing countries, the increased rate of car use has major implications in terms of pollution, noise, and congestion problems. One of the main solutions to these problems is to find ways to promote the use of other transportation modes. The first step in this process is identifying the factors affecting the use of these modes.
Aim:
In Qatar, a major bus service was introduced to address the fast-growing transportation demands in urban areas. This study was initiated to explore the factors influencing public bus ridership in Qatar. The goal is to understand the influence of various attributes at the stop-level of the existing public buses.
Methods:
Multiple linear regression models were developed to identify the parameters significantly influencing stop-level boarding and alighting.
Results:
The results indicate that land use and population parameters significantly affected the existing bus ridership in Qatar. The population parameters include the number of persons available in the catchment area for residing, working, visiting restaurants, and shopping. Land use parameters include the number of shopping places, the number of restaurants, and the number of mosques.
Conclusion:
This information can help policymakers and public authorities to develop policies and plans to increase bus usage in Qatar.
1. INTRODUCTION
Qatar is one of the fastest-growing countries in the world, resulting in substantially larger private vehicle usage and congestion [1, 2]. One of the suggested solutions to reduce private car usage is introducing a public transportation system that provides reasonable service and accessibility to the population. Qatar's population in 2005 was approximately 821,000, and due to many factors, including economic growth and the country's oil and gas boom, the population has grown to approximately three million people in 2022. In 2005, to accommodate this growth and reduce the rate of car usage in Qatar, Mowasalat, a company owned by the Qatari government, launched its first bus service, the Karwa public bus. In 2008, Mowasalat initiated the Karwa Smart Card to be used as a quick and easy way to pay for the Karwa public bus. The Kentkart system, a tracking system, was then initiated to monitor the operation of the bus service and to record the number of passengers and revenues per cardholder per line and stop. This study aims to understand the influence of various attributes at the stop-level of public buses in Qatar using data obtained from the Kentkart system. The results can help policymakers and public authorities to develop policies and plans to increase bus usage in the country.
Many research efforts in transportation worldwide have been focusing on promoting public transportation use. Toward this end, studies focused on understanding the primary determinants of public transit system usage from two perspectives: (1) user perspective – What makes individuals opt for transit mode, and (2) transit system perspective – What attribute at a system-level contributes to transit usage. The first group of studies examines how individual-level socio-demographics, transit accessibility measures, and the built environment affect transit ridership choice. In the second group, the emphasis is on a systems perspective, where transit ridership is studied from the perspective of the transit provider [3-8 ].
The use of different transport modes is affected by several factors, such as economic, sociological, and geographical factors [9-16]. Some studies focused on weather-related factors. For example, Arana et al. investigated the influence of weather conditions on the number of public bus trips made for leisure, shopping, and personal business. The results indicated that bus trips decreased in the case of rain and wind, especially leisure trips. In addition, the number of trips increased in direct proportion to the increase in temperature. Also, regular users with smart cards are less affected by weather conditions than other users [17]. Singhal et al. examined the weather impact on ridership based on the day of the week and time of day combinations. The results showed that the weather’s impact on transit ridership varies based on the time of day and location. The results show significant differences in how the daily, hourly, and individual weather variables can account for transit users' ridership variability and travel patterns [18].
Previous research has also examined other factors such as land use, built environment, transit attributes, and socioeconomic characteristics [19-21]. Some studies focused on understanding several factors that affect transit ridership at a nationwide level. For example, Taylor et al. have undertaken a countrywide study of 265 urbanized areas in the United States and concluded that transit ridership is influenced by regional geography, metropolitan economy, population characteristics, and roadway system characteristics. Their study has classified the factors that affect transit ridership as internal (fare, level of service) or external (income, parking policies, development, employment, fuel prices, car ownership, and density levels) variables. They observed that external factors generally affect ridership more than internal factors [22].
Other studies focused on the land use impact and other parameters on the station-level ridership [8, 23 , 24]. For example, Sung et al. [24] investigated the impacts of land use, rail service coverage, and rail station accessibility on rail transit ridership in Seoul and the surrounding metropolitan region. They employed different regression models to analyze the impact of land use by service coverage and station-level accessibility on rail transit ridership. The relationship was empirically analyzed between rail transit ridership and locational characteristics of rail transit stations in terms of land use density and diversity and station accessibility based on service distances of 250 m, 500 m, 750 m, 1 km, and 1.5 km. The findings showed that the 500 m boundary for rail station service coverage is the most important when considering transit-oriented development. The results also identified development density and station-level accessibility as the most important measures for rail transit promotion.
Chakour and Eluru [8] investigated the influence of transit system operational attributes, transportation system infrastructure attributes, and built environment attributes on the stop level boarding and descending by the time of day for the bus transit system in the Montreal region. The involved estimating the effect of the built environment and urban design on ridership at a stop level using ordered regression models. The study examined ridership for three categories of stops: high, medium, and low ridership. For each of these, boarding and alighting were modeled separately. In addition, the peak and off-peak periods (am peak, pm peak, off-peak day, and off-peak night) were analyzed individually.
This study investigated the effect of different factors on bus ridership in Qatar at the stop level. Some of these factors were related to existing infrastructure around the bus stops, including roads, footpaths, shoulders, parking, and bike lanes. Other factors were related to land use, including the availability of businesses, shopping, religious facilities, universities, restaurants, and other shopping facilities.
2. METHODS
2.1. Data Collection
Several agencies were approached to collect the relevant data for this study and approach. The Karwa bus data were collected from Mowasalat. The data included the bus routes and stops, boarding and alighting data for 2016, frequency, timetable, and the stops’ attributes. The Public Works Authority was approached to collect the most recent geodatabase for the built infrastructure data. For the land use and population data, the Ministry of Transport was approached, and the relevant land use and population data were extracted from the Qatar Strategic Transport Model (QSTM). The QSTM is used in Qatar to forecast traffic demand utilizing census data, population, land uses, and relevant growth factors. A Geographic Information System (GIS) map was created to overlay Qatar's relevant layers. This step was completed after collecting the relevant information, including the roads, footpaths, shoulders, bike lanes, and land-use layers. A buffer of 500 m was then developed around each bus stop to create the catchment area.
2.2. Boarding and Alighting Data
Before requesting the boarding and alighting data, a review of previously used data in previous studies was conducted, as shown in Table 1.
| System | Data Used | Operation* | Level | Refs |
|---|---|---|---|---|
| LRT | Average Weekday | Boarding | Stop Level | [19] |
| Transit | Average Daily | Boarding/Alighting | Station Level | [25] |
| Metro | Average Weekday | Ridership | Station Level | [26] |
| Transit | Average Daily | Ridership | Station Level | [27] |
| Metro Bus | Average per Hour | Boarding | Stop Level | [28] |
| Subway | Daily | Ridership | Stop Level | [18] |
| Transit | Monthly | Ridership | Stop Level | [29] |
| BRT | Daily | Boarding | Stop Level | [30] |
| Bus | Daily | Boarding/Alighting | Stop Level | [31] |
| Bus | Hourly | Boarding/Alighting | Stop Level | [8] |
| Metro | Average Weekday | Boarding | Station Level | [32] |
| Transit | Daily | Ridership | Statewide Level | [33] |
| Subway | Daily | Ridership | Stop Level | [23] |
| Rail | Average Daily | Ridership | Station Level | [24] |
| Metro | Annual Average Weekday | Ridership | Station Level | [34] |
| Bus | Average Weekday | Ridership | Route Level | [35] |
| Bus | Total Daily per Year | Boarding and Alighting | Stop Level | [36] |
| Rail | Total Daily per Year | Ridership | Station Level | [37] |
| Transit | Total Daily per Year | Ridership | System-wide Level | [38] |
| Type | Parameters | Units |
|---|---|---|
| Bus Data | Average Daily Boarding | Average number of daily boarding passengers |
| Average Daily Alighting | Average number of daily alighting passengers | |
| Average Weekday Boarding | Average number of boarding passengers during the
weekday (Saturday to Thursday) |
|
| Average Weekend Boarding | Average number of boarding passengers during the weekend (Friday) | |
| Average Weekday Alighting | Average number of alighting passengers during the
weekday (Saturday to Thursday) |
|
| Average Weekend Alighting | Average number of alighting passengers during the weekend (Friday) | |
| Average AM Boarding | Total number of boarding passengers during the AM peak period | |
| Average PM Boarding | Total number of boarding passengers during the PM peak period | |
| Average AM Alighting | Total number of alighting passengers during the AM peak period | |
| Average PM Alighting | Total number of alighting passengers during the PM peak period | |
| Infrastructure Data | Road Length | Length (m) |
| Footpath | Length (m) | |
| Shoulder Length/Parking | Length (m) | |
| Bike Lane | Length (m) | |
| Land Use and Population Data | Employer Business | Number of persons available within the catchment areas for work-related business. |
| Employees | Number of persons available within the catchment area for work purposes. | |
| Leisure Commuters | Number of persons available within the catchment areas for leisure purposes (hotels, hospitality, etc.) | |
| Mosques | Number of Mosques (buildings) within the catchment area. | |
| Personal Business | Number of persons available within the catchment areas for personal-related business. | |
| Adults | Number of persons available within the catchment areas. | |
| Restaurants | Number of persons within catchment areas for restaurants only | |
| Schools Students | Number of school students within the catchment areas that include schools in the land use category | |
| University | Number of university students within the catchment areas that include universities in the land use category. | |
| Shopping | Number of persons within catchment areas for shopping purposes | |
| Total Population | Number of persons, including adults and inhabitants. |
It was found that most of the previous studies used the average daily and average weekday ridership of boarding and alighting, while limited studies used the total daily per year ridership. Therefore, this study obtained and used the average daily boarding and alighting, average weekday and weekend boarding and alighting, and total morning (AM) and evening (PM) peak periods. Table 2 tabulates all parameters used in the study with their definition and units.
3. RESULTS AND DISCUSSION
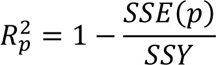
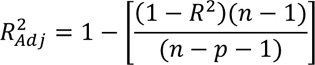
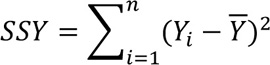
Regression models were developed, with a prediction goal, to estimate boarding and alight on different levels based on the bus infrastructure, population, and planning-related attributes. Multiple linear regression (MLR) analysis was chosen as it is a robust technique that can model the effect of continuous and categorical variables. The mathematical formulation of the MLR model (Equation 1) and various measures (Equations 2 to 4) are shown next. The analysis was conducted using a confidence interval of 95%.
 |
(1) |
 |
(2) |
 |
(3) |
 |
(4) |
Where,
R2p = Predictive ability of model with p variables
R2Adj = Adjusted R2 for the number of predictors in the model
SSE(p) = error sum of squares of the model with p variables
SSY = Total (corrected) sum of squares for the response Y
n = total number of observations
p = no of variables in selected model
k = total number of variables considered in the maximum model
Forward, backward, and stepwise selection methodologies were assessed. The stepwise selection procedure explained the data set better. The stepwise regression model development procedure first considered all the variables to see if their significance has been reduced below the specified tolerance level. The variables were eliminated one at a time, starting with the one that had the lowest correlation with the dependent variable. Elimination continued until only statistically significant variables were left in the model. The coefficients and t-statistic for the initial and best models developed using different input variables and selected using selection criteria are shown in Tables 3 to 6.
| Dependent Variable: Average Hourly Boarding | |||||||
| Variables | Unstandardized Coefficients | Standardized Coefficients | t | Sig. | 95.0% Confidence Interval for B | ||
| B | Std. Error | Beta | Lower Bound | Upper Bound | |||
| (Constant) | -153.084 | 186.289 | -0.822 | 0.411 | -518.753 | 212.586 | |
| Number of Shopping Places | 273.408 | 38.208 | 0.266 | 7.156 | 0 | 198.41 | 348.407 |
| Personal Business (Number) | 0.101 | 0.026 | 0.141 | 3.878 | 0 | 0.05 | 0.153 |
| Shopping Commuters | 0.121 | 0.019 | 0.38 | 6.243 | 0 | 0.083 | 0.159 |
| Total Residents | -0.147 | 0.03 | -0.216 | -4.89 | 0 | -0.206 | -0.088 |
| Number of Restaurant Commuters | -0.232 | 0.093 | -0.132 | -2.49 | 0.013 | -0.415 | -0.049 |
| R2 | 0.210 | ||||||
| Adj. R2 | 0.205 | ||||||
| Dependent Variable: Average Hourly Alighting | |||||||
| Variables | Unstandardized Coefficients | Standardized Coefficients | t | Sig. | 95.0% Confidence Interval for B | ||
| B | Std. Error | Beta | Lower Bound | Upper Bound | |||
| (Constant) | 420.533 | 171.743 | 2.449 | 0.015 | 83.415 | 757.65 | |
| Shopping Commuters | 0.101 | 0.012 | 0.512 | 8.714 | 0 | 0.078 | 0.124 |
| Number of Shopping Places | 165.667 | 23.221 | 0.266 | 7.134 | 0 | 120.086 | 211.248 |
| Total Residents | -0.062 | 0.02 | -0.153 | -3.144 | 0.002 | -0.101 | -0.023 |
| Personal Business (Number) | 0.071 | 0.016 | 0.162 | 4.477 | 0 | 0.04 | 0.102 |
| Number of Restaurant Commuters | -0.22 | 0.054 | -0.207 | -4.074 | 0 | -0.327 | -0.114 |
| Number of Mosques | -118.766 | 42.68 | -0.103 | -2.783 | 0.006 | -202.543 | -34.989 |
| Parking (m2) | -0.009 | 0.005 | -0.071 | -2.021 | 0.044 | -0.018 | 0 |
| R2 | 0.275 | ||||||
| Adj. R2 | 0.269 | ||||||
| Dependent Variable: Average Daily Boarding | |||||||
| Variables | Unstandardized Coefficients | Standardized Coefficients | t | Sig. | 95.0% Confidence Interval for B | ||
| B | Std. Error | Beta | Lower Bound | Upper Bound | |||
| (Constant) | -9.765 | -9.765 | -0.853 | 0.394 | -32.245 | 12.715 | |
| Number of Shopping Places | 16.637 | 2.338 | 0.258 | 7.116 | 0 | 12.049 | 21.226 |
| Personal Business (Number) | 0.006 | 0.002 | 0.139 | 3.902 | 0 | 0.003 | 0.009 |
| Shopping Commuters | 0.008 | 0.001 | 0.384 | 6.512 | 0 | 0.005 | 0.01 |
| Total Residents | -0.009 | 0.002 | -0.212 | -4.888 | 0 | -0.013 | -0.005 |
| Number of Restaurant Commuters | -0.014 | 0.006 | -0.129 | -2.504 | 0.012 | -0.026 | -0.003 |
| R2 | 0.206 | ||||||
| Adj. R2 | 0.201 | ||||||
| Dependent Variable: Average Daily Alighting | |||||||
| Variables | Unstandardized Coefficients | Standardized Coefficients | t | Sig. | 95.0% Confidence Interval for B | ||
| B | Std. Error | Beta | Lower Bound | Upper Bound | |||
| (Constant) | 13.895 | 9.148 | 1.519 | 0.129 | -4.06 | 31.85 | |
| Shopping Commuters | 0.006 | 0.001 | 0.452 | 7.7 | 0 | 0.004 | 0.007 |
| Number of Shopping Places | 10.2 | 1.527 | 0.251 | 6.681 | 0 | 7.203 | 13.197 |
| Total Residents | -0.003 | 0.001 | -0.116 | -2.413 | 0.016 | -0.006 | -0.001 |
| Personal Business (Number) | 0.004 | 0.001 | 0.124 | 3.538 | 0 | 0.002 | 0.005 |
| Number of Restaurant Commuters | -0.014 | 0.004 | -0.197 | -3.87 | 0 | -0.021 | -0.007 |
| Number of Mosques | -7.477 | 2.81 | -0.098 | -2.661 | 0.008 | -12.992 | -1.962 |
| R2 | 0.239 | ||||||
| Adj. R2 | 0.234 | ||||||
| Dependent Variable: Average Weekday Boarding | |||||||
| Variables | Unstandardized Coefficients | Standardized Coefficients | t | Sig. | 95.0% Confidence Interval for B | ||
| B | Std. Error | Beta | Lower Bound | Upper Bound | |||
| (Constant) | -9.409 | 10.333 | -0.911 | 0.363 | -29.69 | 10.871 | |
| Number of Shopping Places | 15.052 | 2.109 | 0.258 | 7.137 | 0 | 10.913 | 19.192 |
| Personal Business (Number) | 0.006 | 0.001 | 0.145 | 4.083 | 0 | 0.003 | 0.009 |
| Shopping Commuters | 0.007 | 0.001 | 0.39 | 6.634 | 0 | 0.005 | 0.009 |
| Total Residents | -0.008 | 0.002 | -0.204 | -4.72 | 0 | -0.011 | -0.005 |
| Number of Restaurant Commuters | -0.014 | 0.005 | -0.134 | -2.61 | 0.009 | -0.024 | -0.003 |
| R2 | 0.213 | ||||||
| Adj. R2 | 0.208 | ||||||
| Dependent Variable: Average Weekday Alighting | |||||||
| Variables | Unstandardized Coefficients | Standardized Coefficients | t | Sig. | 95.0% Confidence Interval for B | ||
| B | Std. Error | Beta | Lower Bound | Upper Bound | |||
| (Constant) | 12.759 | 8.518 | 1.498 | 0.135 | -3.96 | 29.478 | |
| Shopping Commuters | 0.005 | 0.001 | 0.458 | 7.824 | 0 | 0.004 | 0.007 |
| Number of Shopping Places | 9.402 | 1.422 | 0.248 | 6.614 | 0 | 6.612 | 12.193 |
| Total Residents | -0.003 | 0.001 | -0.11 | -2.295 | 0.022 | -0.005 | 0 |
| Personal Business (Number) | 0.003 | 0.001 | 0.128 | 3.672 | 0 | 0.002 | 0.005 |
| Number of Restaurant Commuters | -0.013 | 0.003 | -0.2 | -3.941 | 0 | -0.02 | -0.007 |
| Number of Mosques | -6.98 | 2.616 | -0.098 | -2.668 | 0.008 | -12.116 | -1.845 |
| R2 | 0.245 | ||||||
| Adj. R2 | 0.239 | ||||||
| Dependent Variable: Average Weekend Boarding | |||||||
| Variables | Unstandardized Coefficients | Standardized Coefficients | t | Sig. | 95.0% Confidence Interval for B | ||
| B | Std. Error | Beta | Lower Bound | Upper Bound | |||
| (Constant) | -12.905 | 18.35 | -0.703 | 0.482 | -48.922 | 23.111 | |
| Number of Shopping Places | 23.791 | 3.909 | 0.234 | 6.085 | 0 | 16.117 | 31.464 |
| Personal Business (Number) | 0.009 | 0.003 | 0.132 | 3.558 | 0 | 0.004 | 0.015 |
| Shopping Commuters | 0.011 | 0.002 | 0.345 | 6.185 | 0 | 0.008 | 0.015 |
| Total Residents | -0.016 | 0.003 | -0.229 | -5.097 | 0 | -0.022 | -0.01 |
| Number of Employees | -0.006 | 0.003 | -0.105 | -2.147 | 0.032 | -0.011 | -0.001 |
| R2 | 0.180 | ||||||
| Adj. R2 | 0.175 | ||||||
| Dependent Variable: Average Weekend Alighting | |||||||
| Variables | Unstandardized Coefficients | Standardized Coefficients | t | Sig. | 95.0% Confidence Interval for B | ||
| B | Std. Error | Beta | Lower Bound | Upper Bound | |||
| (Constant) | 20.643 | 13.041 | 1.583 | 0.114 | -4.953 | 46.239 | |
| Shopping Commuters | 0.008 | 0.001 | 0.426 | 7.13 | 0 | 0.006 | 0.01 |
| Number of Shopping Places | 14.94 | 2.176 | 0.262 | 6.864 | 0 | 10.668 | 19.212 |
| Total Residents | -0.005 | 0.002 | -0.139 | -2.841 | 0.005 | -0.009 | -0.002 |
| Number of Restaurant Commuters | -0.018 | 0.005 | -0.184 | -3.553 | 0 | -0.028 | -0.008 |
| Personal Business (Number) | 0.004 | 0.001 | 0.106 | 2.977 | 0.003 | 0.001 | 0.007 |
| Number of Mosques | -10.426 | 4.005 | -0.098 | -2.603 | 0.009 | -18.288 | -2.564 |
| R2 | 0.215 | ||||||
| Adj. R2 | 0.210 | ||||||
The analysis results revealed that the land use and population parameters were the most significant in terms of impact on the stop-level ridership. The most significant parameters were the number of shopping places, personal businesses, shopping commuters, total residents, number of restaurant commuters, and number of mosques. The most significant parameters against the average hourly, daily, and weekday boarding were the number of shopping places, personal businesses, shopping commuters, total residents, and restaurant commuters.
The shopping commuters, number of shopping places, number of residents, personal businesses, number of restaurant commuters, and number of mosques were the most significant parameters on the average hourly and daily alighting. In terms of the average weekday alighting, the most significant parameters were shopping commuters, number of shopping places, total residents, personal business, number of restaurant commuters, and number of mosques. While for the average weekend alighting, the most significant parameters are shopping commuters, number of shopping places, total residents, number of restaurant commuters, personal business, and number of mosques. In general, the most common significant parameters were the shopping commuters and the number of shopping places.
CONCLUSION
In this study, boarding and alighting data were collected and analyzed to understand the factors affecting the ridership of the rail service in Qatar. MLR models were used to estimate boarding and alighting on different levels based on the bus infrastructure, population, and planning--related attributes. The models included different parameters, including infrastructure, population, land use, and bus operation parameters. The data were collected from several agencies and compiled on a GIS map to understand the correlation between the parameters and to achieve a better presentation of the data.
The results revealed that most land use and population parameters significantly affected stop-level boarding and alighting. The population parameters include the number of persons available in the catchment area for residing, working, visiting restaurants, and shopping. Land use parameters include the number of shopping places, restaurants, and mosques. The road length and parking area were the most significant from the infrastructure parameters. This can be because there is no other mode of transport in Qatar that integrates with the bus service; as such, the use of passenger cars and taxis is needed to allow for this integration.
One of the study's limitations was not including information about other transport modes along the corridor, such as taxis and the new metro service, due to the difficulty of obtaining. Such parameters could affect the ridership and the parameters included in the study. This can be further assessed when such information is collected in the future. Future studies should also focus on studying the effect of future network expansion. In this case, the effect of the newly added routes, the passengers’ shift to these new routes, and passengers’ behavior should be investigated. Finally, the impact of other transport modes on bus operation should be explored in the future. Despite the limitations discussed, the results from the study can help and guide policymakers in determining how to promote public transportation in Qatar and other rich developing countries, such as Saudia Arabia, Bahrain, Kuwait, Oman, and United Arab Emirates.
LIST OF ABBREVIATIONS
| QSTM | = Qatar Strategic Transport Model |
| GIS | = Geographic Information System |
CONSENT FOR PUBLICATION
Not applicable.
AVAILABILITY OF DATA AND MATERIALS
Not applicable.
FUNDING
None.
CONFLICT OF INTEREST
Dr. Khaled Shaaban is the Associate Editorial Board Member of The Open Transportation Journal.
ACKNOWLEDGEMENTS
Declared none.

