All published articles of this journal are available on ScienceDirect.

Decoding Vehicle Motion Data on the Internal Network
Abstract
Background:
Encrypting functions of vehicle internal networks makes the lives of third parties more difficult since, in most cases, the meaning of messages carried by the CAN bus is not disclosed
Objectives:
This paper proposes a reverse engineering method to discover, to a large extent, the semantics of CAN messages in a vehicle internal network.
Methods:
A filtering mechanism has been applied that includes several statistical processes to interpret the codes of CAN messages. The speed change function of a vehicle has been chosen as an example to be followed in the development steps of this approach to predict the motion mechanism of the vehicle. The selected codes were verified by developing a multilevel model that relates the hierarchical relationship between the bytes and IDs and their impact on the speed factor.
Results:
The most influential IDs and bytes on vehicle speed functions were: ID 512, ID 520, ID 664, B2, B4, and B6, respectively.
Conclusion:
The selected codes used to model the observed speed do not mean they all share the speed function, but there is a good possibility that at least some fulfill this function. However, with some optimization, the same methodology can be applied to detect other semantic messages in the CAN network based on the expected data type.
1. INTRODUCTION
Today's vehicles have different electronic components networked together and responsible for monitoring and controlling the state of the vehicle. Modern automobiles can contain over 70 electronic component units (ECUs) [1]. Each ECU, from the engine, breaking, and steering controls to the modern Telematics module, is responsible for one or more functions in the vehicle. The ECUs are connected to a network that typically uses the Controller Area Network (CAN) bus protocol.
In-vehicle networks undoubtedly contribute to improved performance in terms of functionality, safety, comfort, etc. However, encrypting functions of vehicle internal networks make the lives of third parties more difficult since, in most cases, the meaning of messages carried by the CAN bus is not disclosed. Car manufacturers believe disclosing functional encryption could negatively affect the manufacturing race, not to mention the cyber penetration of car networks. Revealing the topological structure of the in-vehicle network can make them vulnerable to cyber-attack, which affects safety [1-3]. However, the goal is to help third parties (e.g., mechanics and scientists) decipher the functional processes of vehicle networks for understanding, development, and scientific research.
The decoding of software systems has attracted a lot of hackers and researchers, whether for research or subversive purposes [4, 5]. Most suggest a semi-automated technique that uses dynamic and static analysis to locate features in different parts of a program. Limited literature has been concerned with automotive systems. Hermans et al. [6] suggested a five-step approach to reverse engineering the CAN network. In his approach, the identifiers are linked to a specific subsystem. Then, the relation between IDs and control units is made by disconnecting the control units and observing the change in functional operations of the targeted ECU. Markovitz & Wool [7] developed an anomaly detection system for CAN bus traffic. The system uses a classifier to characterize the fields and build a model for the messages. The model is formulated as a database matched against messages efficiently in either software or hardware. Verma et al. [8] presented a CAN-D four-step modular pipeline using an optimization process and heuristics to identify and correctly translate signals in CAN bus data to their numerical time series.
On the other hand, the advent of self-driving technology and the increased reliance on a higher number of ECUs encouraged the acceleration of research in cybersecurity. Using the reverse engineering and decoding of the ECUs, Koscher et al. [9] controlled many automobile functions, such as stopping the engine and disabling the brakes. Similarly, academic researchers from the University of Washington and the University of California [10, 11] have shown that it is possible to control critical vehicle systems, such as computerized displays and locks and braking pedals. They have shown that such malicious codes can be injected remotely without physical access, as demonstrated by others [11–14].
Much research has been done to enhance the security of the CAN bus network [15], for instance, the security system proposed by Mayilsamy et al. [16] for automotive applications. This system is based on using a combination of cryptography and steganography to enhance the data security of the CAN network. Larson & Nilsson [17, 18] discussed five defensive layers to secure vehicles: prevention, detection, deflection, countermeasures, and recovery. Research surveys were conducted to investigate the difference in the level of security for different in-vehicle network topologies [2, 19, 20]. In some vehicular industries (i.e., trucks and buses), the semantics of CAN messages have been standardized [21]. This has not existed in most passenger car industries, where the in-vehicle network may have different topologies. The in-vehicle network topologies usually vary by car manufacturers [22] and are designed to balance efficiency, convenience, and cost with modern technological solutions.
However, understanding the hidden messages represented by these codes using similar systems is difficult as they are encrypted and protected by many security systems. In this paper, the methodology used aims to circumvent these systems by using statistical approaches to understand these codes' patterns and sequences. To our knowledge, no statistical methodology for decoding the semantics of vehicular messages has been described in the literature.
2. THE CASE STUDY
The internal network progressive codes have been tabulated for a test MIEV car in motion. The motion includes forward, stop, change gear, reverse, and stop conditions. The duration of the movement was about 4 minutes and resulted in 383,430 rows of operational data, including 52 unique identifiers (IDs) of the can network. Each has between 1 and 8 individual bit-fields (i.e. B0, B1, B2, B3, B4, B5, B6, B7) [23, 24]. The speed and acceleration of the vehicle have also been recorded during the operation. However, a single function may be represented by more than one code, which will be considered in the following methodology.
3. The Filtering Methodology
A large amount of data has to be gradually filtered using several steps and methods To find out the network operations (i.e., independent variables) related to specific car operations, such as speed (i.e. dependent variables). The speed change function has been chosen as an example of the methodology development processes in this approach. The following statistical methodology has been used to filter and mine for codes representing a specific function or operation in the internal vehicle network.
1- Manual filtering: Given that the cryptic codes of vehicle operations required to be estimated are almost movement operations, all IDs with constant oscillated values have been excluded from further analysis. This step was made manually; for every ID, a diagram has been built for each byte, and the data trend was noted.
2- Forward stepwise: In the methodology, the stepwise forward method was applied to select the best linear model with the best integrated independent variables.
3- The hierarchical multilevel modelling: In the simple model, a high correlation between the independent variable is not preferred for a strong model. The multilevel mixed model builds various interactions between predictors on different levels [25]. Multilevel modelling is a good approach for decoding the speed change function of the vehicle by revealing the hidden correlation between the bytes and IDs at both micro- and macro-levels and their effect on speed.
4. RESULTS
4.1. Manual Filtering
In the result of this filtering step, 11 IDs have been selected with 113,115 rows of data. The following table shows the general trend of the selected IDs and their bytes.
The numbers 0, 1, and 2 in Table 1 are only indicators representing the general pattern of bytes for each of the 11 selected identifiers. All cells with the number (1) have a constantly fixed byte value, while the number (2) represents an oscillating change in the value during the entire test regardless of the applied function. The number (0) indicates cells with irregular change values throughout the movement of the test vehicle. Therefore, the identifiers containing cells (0) will be the focus of the search in the following steps.
In the resulting filtering of this step, a regular sequence of IDs has also been observed. Fig. (1) shows the sequence of the ID’s operations with time for the first 80 rows.
| ID | B0 | B1 | B2 | B3 | B4 | B5 | B6 | B7 |
|---|---|---|---|---|---|---|---|---|
| 257 | 1 | - | - | - | - | - | - | - |
| 281 | 0 | 0 | 0 | 0 | 0 | 2 | 2 | 2 |
| 329 | 2 | 2 | 0 | 1 | 2 | 1 | 2 | 2 |
| 342 | 0 | 0 | 0 | 0 | 2 | 2 | 2 | 2 |
| 512 | 0 | 1 | 1 | 0 | 1 | 0 | 1 | 1 |
| 520 | 0 | 1 | 1 | 2 | 1 | 0 | 1 | 1 |
| 28 | 0 | 0 | 1 | 0 | 2 | 0 | 0 | - |
| 530 | 0 | 0 | 0 | 0 | 2 | 1 | 0 | 0 |
| 533 | 0 | 0 | 0 | 0 | 0 | 0 | 0 | 0 |
| 561 | 0 | 0 | 0 | 0 | 0 | 0 | 0 | 0 |
| 566 | 1 | 2 | 2 | 2 | 2 | 0 | 0 | 2 |
| 645 | 1 | 1 | 1 | 0 | 1 | 1 | 1 | 1 |
| 646 | 0 | 0 | 0 | 1 | 0 | 0 | 0 | 0 |
| 648 | 1 | 1 | 1 | 2 | 1 | 0 | 1 | 1 |
| 664 | 1 | 1 | 1 | 1 | 0 | 0 | 1 | 1 |
| 666 | 0 | 0 | 0 | 0 | 0 | 0 | 0 | 0 |
| 754 | 2 | 0 | 1 | - | - | - | - | - |
| 768 | 0 | 1 | 1 | 1 | 0 | 1 | 1 | 1 |
| 776 | 0 | 1 | 1 | 0 | 0 | 0 | 0 | 0 |
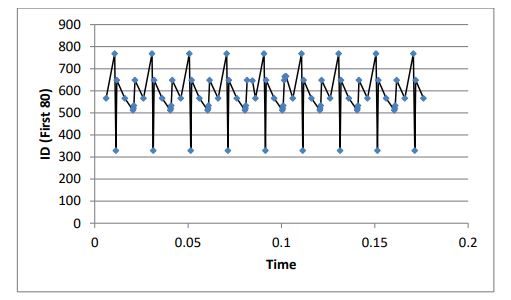
This filtering brings us closer to decoding the speed function, as the sequence of calling the IDs Fig. (1) shows an oscillating order indicating they perform the same single or multiple functions. A difference in byte values within these IDs indicates a different level of influence for the same function (e.g., a change in the speed function).
4.2. Forward Stepwise
This filtering is intended to apply a linear regression model to select the most influential bytes (for all IDs selected in step 1) as independent variables and on the observed car operation (i.e., speed) as a dependent variable. It is likely to depict a linear relationship between IDs and speed unless more than one ID or byte shares the same single function. Finally, two insignificant columns of bytes have been excluded from further analysis; B0 and B1. Although this method tests the linear relationship, it can be dispensed by the next step.
4.3. The Hierarchical Multilevel Modelling
The investigated data revealed a hierarchical relationship between the variables. This can be seen from the influence of the nested relationship between the byte values at the individual level and the IDs at the group level on the response variable (i.e., observed speed). This can be inferred by observing the change in byte values for each unique ID in different speed values (i.e., the time factor is not of concern in this case). The following Fig. (2) shows the shape of the hierarchical structure.
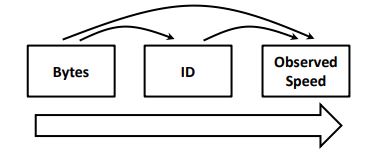
The multilevel model has been applied to check the hierarchical structure and filter the data, considering the speed as a responding variable and the bytes as a level-one predictor. At the same time, the IDs are a level-two predictor. The result gives the estimated values and the p-values for the nested relationship between each byte value with every ID, as presented in Appendix (1).
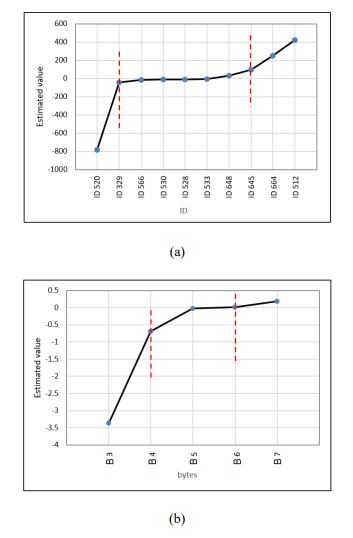
In the resulting table, most estimated values are significant to the 99% confidence level. The estimated values range from negative to positive but zero for non-significant variables. Since no clear reference is available, it is difficult to individually explain each number of the estimated value in the Appendix. The next step is selecting the predictors with the highest effect on the response value. The top absolute values (i.e., should also be significant) will be selected in this filtering strategy. The selection criteria follow the Elbow method [26], where a point is identified in the figure in which the variance between the estimated values becomes low. Therefore, ID 512, ID 520, and ID 664 have been chosen (Fig. 3a) from the group level. At the individual level, bytes B2 and B6 have also been selected (Fig. 3b).
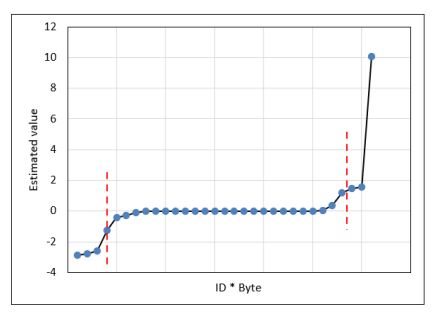
The last estimated values in Appendix (1) (i.e., No.
It can be noted that the selected combined variables include bytes and IDs that were chosen to support our variable filtering criteria. Table 2 summarizes the finally selected independent variables (i.e., codes) as the most influential on the observed speed according to the applied filtering methodology.
| ID | Bytes |
|---|---|
| 512 | B2 |
| 520 | B4 |
| 664 | B6 |
5. MULTILEVEL MODELLING OF THE OBSERVED SPEED
The finally selected independent variables have been used to develop a mixed multilevel model. The model includes level-one fixed effect variables, B2, B4, and B6, selected from the pre-identified IDs (Table 2), and a random intercept. Table 3 summarise the estimated fixed effect variable, while the random effect intercept is shown in Table 4.
| Parameter | Estimate | Sig. |
|---|---|---|
| Intercept | 230.102 | 0.036 |
| B2 | -0.621 | 0.000 |
| B4 | -0.394 | 0.000 |
| B6 | -0.552 | 0.000 |
The variance component output (Table 4) indicates the proportion of variance in the observed speed (dependent variable) that lies between IDs (group level) is 0.997. This can be calculated as follows:
| Parameter | Estimate | Std. Error | Sig. |
|---|---|---|---|
| Residual | 33.85 | 0.30 | 0.000 |
| Intercept (subject = ID) Variance | 12351.34 | 10185.77 | 0.225 |
High correlation values between the selected bytes in the model indicate they have approximately the same pattern, which could support the idea they may share the same function (Table 5).
However, the selected bytes and IDs used to model the observed speed do not mean they all share the speed function, but there is a good possibility that at least some do this function.
| - | B2 | B4 | B6 |
|---|---|---|---|
| B2 | 1.00 | 0.41 | 0.81 |
| B4 | - | 1.00 | 0.87 |
| B6 | - | - | 1.00 |
6. DISCUSSION
Statistical operations have been applied to filter out the many codes generated by vehicle operations and reveal their hidden functions. The speed change function has been selected as an example to be followed in the development steps of this approach. The filtering process started with a manual approach aimed at excluding IDs with constant or oscillating bytes value not often related to the function of speed change. In this filtering process, about a third of all data were excluded, and 11 IDs were selected. This is followed by applying stepwise and multilevel approaches to reveal the statistical relationships between the generated codes and vehicle speed. The investigated data revealed hierarchical relationships between the byte values at the individual level and the IDs at the group level on the response variable (i.e., observed speed). The most influential IDs and bytes have been selected using the Elbow method and found to be: ID 512, ID 520, ID 664, and B2, B4, and B6, respectively.
CONCLUSION
The main objective of this paper is to develop a statistical approach capable of decoding the internal vehicle network identifiers (IDs) and bytes and their relationship with real observed vehicle operations. The process is based on applying a sequence of statistical approaches for decoding network identifiers (IDs) and linking them to the observed operations of a real vehicle.
In the case study, the CAN bus progressive codes for a test MIEV vehicle in motion have been tabulated. The vehicle motion includes forward, stop, change gear, reverse, and stop conditions. The duration of the movement was around 4 minutes and resulted in 383,430 rows of operational data, including 52 unique IDs; each has between 1 and 8 individual bytes (i.e., B0, B1, B2, B3, B4, B5, B6, B7). The speed and acceleration of the vehicle have also been recorded during the operation.
The CAN message formats are practically proprietary and not publicly documented; therefore, it is difficult to verify this conclusion definitively. Car manufacturers fear disclosing the functional sequence of these codes since it often negatively impacts the cyber penetration of vehicle networks and the manufacturing race. The goal is scientific research. However, the revision process and the models developed indicate, to a large extent, the association of these selected codes in Table 4, or at least some, with the speed function of the test vehicle.
However, with some optimization, the same methodology can be applied to detect other semantic messages in the CAN network based on the expected data.
CONSENT FOR PUBLICATION
Not applicable.
AVAILABILITY OF DATA AND MATERIALS
The data supporting the findings of the article is available in the (Zenodo repository) at (https://doi.org/10.5281/zenodo. 7513367, reference number (Version 1).
FUNDING
None.
CONFLICT OF INTEREST
The author declares no conflicts of interest, financial or otherwise.
ACKNOWLEDGEMENTS
Declared none.

