All published articles of this journal are available on ScienceDirect.

Spatial Analysis of the Contribution of Parking Service Facilities to Traffic Crashes along Limited-access Roadways
Authors Info & Affiliations
Abstract
Background and Objective:
Parking service facilities (PSFs) are integral components of road networks and are typically designated to offer road users, stakeholders, and external entities various services and opportunities. However, the current literature manifests contradictions among studies regarding the contribution of PSFs to crashes in the mainline traffic stream. This study aims to assess the contribution of PSFs to traffic crashes on limited-access expressways using hotspot analysis of traffic crashes in GIS.
Methods:
Planar Getis-Ord Gi* and network KDE were used to detect crash hotspots along a study road based on five criteria: crash frequency of all vehicle types, frequency of all vehicles involved in crashes, frequency of heavy vehicles involved in crashes, injury severity index and iRAP star rating.
Results:
The study identified and ranked the safety hazard of PSFs along the study road via the interference and risk level of crash hotspots with influential segments of PSFs. Getis-Ord Gi* analysis showed that almost 65% of PSFs along the study road were potentially high-risk facilities, with their influential segments interfering with crash hotspots based on the five hotspot analysis criteria. On the other hand, network KDE identified that almost 100% of PSFs along the study road were potentially high-risk facilities of either serious, significant or moderate risk levels based on the same hotspot analysis criteria.
Conclusion:
The two spatial analyses indicated that crashes in proximity to PSFs may increase when the number of lanes of their influential road segments increases and traffic flow is interrupted by other road facilities. They also indicated that crash frequency and severity increase in the proximity to PSFs with high speed and high traffic volume. Furthermore, the two analyses indicated that heavy vehicle crashes are more likely to increase in proximity to PSFs in rural areas.
1. INTRODUCTION
Road traffic safety is a global socio-economic concern related to life threats and property damage [1]. Traffic crashes are a major public health issue resulting in approximately 1.30 million people dying, and up to 50 million are injured and disabled yearly worldwide [2]. In Malaysia, traffic road crashes are considered one of the primary causes of death [3]. Malaysia's fatal crash rate is considerably high for a developed country [4]. To illustrate, 33,049 people were killed, and 50,540 were injured in 2,661,061 crashes between 2015 and 2019 on Malaysia's Roads [5]. The report indicated that in 2019 crashes have increased by 3.34% from last year and by 13.73% in the past five years.
Roadside service facilities are integral components of road networks and are designated to offer various services and opportunities based on their specific function. In general, these facilities are classified into two categories: parking service facilities (PSFs) such as rest areas, lay-bys, fuel stations, park and ride, and truck stops; and enforcement facilities, also known as fixed weigh stations or inception stations [6, 7]. Although both facility types are used for parking activities proximate to the mainline, PSF is the most typical roadside service facility for parking and resting [8]. A PSF on the mainline benefits three main groups: road users, roadway stakeholders and other authorities, and external agencies (e.g., the tourism industry, local commercial businesses, etc.) [9]. Essentially PSFs are established to offer quick access from the mainline and provide road users with various amenities, such as a place to rest, sleep, eat, use the restroom, and inspect vehicles and cargoes [10, 11]. Roadside facilities are strategically placed along rural roadways, towns, state boundaries, and large metropolitan areas when road users need convenience and amenities [12]. In addition, fatigued and drowsy road users utilize PSFs as safe places to pull over and rest before resuming their journey [9]. Researchers agreed that PFS plays a primary role in reducing fatigue-related road crashes and mitigating shoulder parking issues along high-speed roadways [9, 13]. However, the contribution of those facilities to traffic crashes needs further investigation.
Investigating and comprehending the causes and patterns of traffic crashes related to PSFs are critical and should receive considerable research priority. Numerous researches have investigated the relationship between crash risks and parking facilities. Taylor et al. and SRF Inc. investigated the association between heavy vehicle crashes and the spacing distance between rest areas on US routes and interstate highways [14, 15]. Both reports indicated that the frequency of single-unit heavy vehicle crashes increased when the spacing distance between any two successive rest areas exceeded 48.3 km. A similar study in California indicated that the frequencies of fatigue-related and non-fatigue-related crashes were much greater within 16 km upstream than within 16 km downstream of rest areas; however, the frequency of fatigue-related crashes decreased immediately after rest areas and rapidly increased beyond 48.3 km from rest areas [16]. McArthur et al. [17] indicated that traffic volume and the proximity of rest areas substantially impact fatigue-related crashes within 32.20 km upstream and downstream of the facility locations. Another study found that increasing the distance between consecutive rest areas by 1 km increases the frequency of fatigue crashes, and the distance between consecutive rest areas should be shorter than 16 km [18]. Bunn et al. [19] indicated that the frequency of fatigue-related heavy vehicle crashes is substantially associated with the nearest PSF (i.e., rest area and truck stop) within 32.2 km from the crash locations. The relationship between the number of heavy vehicle parking spaces and crash severity was investigated by Lang [20]. He found that increasing the number of parking spaces on a thirty-minute drive is more likely to reduce the risk of suffering a severe injury in crashes involving a heavy vehicle. A before-and-after study examined installing a drowsy driving advisory (DDA) system on rural interstates in Alabama [21]. The results showed that rest areas and upstream segments equipped with the DDR system significantly reduced all crash types. Furthermore, many studies have indicated that the presence of PSFs proximate to the mainline help mitigates fatigue-related crashes [16, 17, 20, 22, 23].
Although the safety benefits of PSFs have been discussed in the literature, a few studies found that the presence of PSFs proximate to the mainline may create conflict areas in the proximate segments. For example, when vehicles attempt to enter or exit PSFs, they start maneuvering and changing lanes on the mainline, which may pose traffic safety risks around PSFs [6, 24, 25]. In addition, improper design, inadequate spacing distance between PSFs, or a lack of adequate parking supply contribute to crash incidences along their proximate segments [16, 17, 26-28]. Pigman et al. [29] discovered that heavy vehicle crash hotspots are directly related to the proximity and utilization of a PSF. McArthur et al. [17] found that the proximate segments to the PSFs entry ramps had a high crash frequency due to access issues. F Alkhatni [30] highlighted that the existence of fixed weigh stations and rest areas proximate to the mainline is more likely to increase crash frequency within their proximate road segments. Chiou & Fu [31] indicated that the presence of rest areas increased crash frequency and injury and PDO crash rates on freeways. Hernández & Anderson [32] found some hotspots of heavy vehicle crashes adjacent to PSFs and their proximate road segments. The researchers hypothesized that some roadway segments with high crash frequency involving heavy vehicles might be related to PSFs, although this relation is still ambiguous. A spatial analysis study on limited-access expressways found crash clusters where the traffic stream is interrupted by facilities such as rest areas, lay-bys, or interchange ramps [33]. A sensitivity crash analysis was conducted on Indonesian limited-access roads and reported that the presence of rest areas increased crash frequency on two-lane and specific toll segments [34]. However, the crash frequency decreased on three-lane segments, and no influence was reported on four-lane segments due to rest areas. Recently, a review article explored the characteristics and contribution of rest areas to traffic crashes on the mainline [13]. The study highlighted a gap in knowledge on the relationship between traffic crashes and rest areas, particularly in their proximate road segments.
Many studies have highlighted the traffic safety benefits of PSFs on the mainline [14-17, 19-22, 35, 36]. However, only a limited number of studies have barely indicated that the presence of a PSF may pose a safety hazard in the proximate road segments in their margin results [30-32, 34]. Despite the safety benefits of PSFs to road users, the location, design, and operation of PSFs may create a traffic conflict area along with their proximate road segments (in this paper called influential segments), leading to traffic crash risks. This potential negative impact of PSFs may result from additional maneuvers such as diverging, merging, and changing lanes before and after PSFs [6, 9, 30]. To the best knowledge of the authors, no study has investigated the contribution of such facilities to road crashes on limited-access roadways using spatial crash risk analysis. In addition, the contribution of PSFs to various types of road crashes is unknown on Malaysian routes. According to prior studies, there are different types of road crashes due to differences in driving styles, road conditions, and the surrounding environment [37]. Thus, the results from western countries may not be directly adaptable to other regions [38].
Understanding traffic crash patterns and identifying high-risk areas and their contributing factors are essential for reducing crash risk [39]. Road crashes may have detectable patterns since they are associated with geographical and temporal parameters such as roadway and geographic features, environmental conditions, time of day, and so on. Recently, data mining techniques have been widely employed in road safety analysis, such as classification and clustering, association rule mining, and decision tree-based techniques [40, 41]. Data mining techniques are designed to extract innovative, implicit, and concealed information from large datasets [41]. Geurts et al. [42] employed the approach of association rule mining to investigate the various circumstances that occur at frequent crash locations on Belgium roadways. Tesema et al. [43] developed a decision support system for Ethiopian road crashes using an adaptive regression tree model. Abellan et al. [44] built various decision trees to extract multiple decision rules to evaluate data from Spain's two-lane rural highways. They concluded that safety barriers and poor lighting have a negative impact on the severity of crashes. Depaire et al. [45] employed clustering to examine Belgium's road crash data and concluded that cluster-based analysis of road accident data could yield more accurate results than traditional data analysis. Hezaveh et al. [46] used a decision tree-based technique on Tennessee crash data to determine a relationship between pedestrian crash severity, geometric road features, and environmental factors. Comi et al. [47] used clustering and data mining techniques to investigate crash data of 15 districts in Roma Municipality. The clustering technique emphasized the safety concerns for pedestrians, cyclists, and motorcyclists, as well as the fact that unidentified vehicles are involved in the most dangerous crashes, while the data mining techniques determined environmental and temporal factors in crashes. The most effective hotspot identification methods that are currently have been developed in some nations, especially the more sophisticated methods like the Empirical Bayes method, where safety performance functions are derived, cannot be used in the context of developing countries [48, 49]. As a result, it is advised to properly assess and identify a suitable technique for identifying and prioritizing crash hotspot locations based on the available limited data. All prior prediction models employed only the estimated number of crashes or severities in a particular period, and spatial features are thus considered constant within a specific time frame [50]. The spatial sensitivity of traffic crashes is thus disregarded. Currently, Geographic Information System (GIS) has made a significant contribution to identifying high-risk locations. The combination of spatial features and statistical analysis provides superior methods for comprehending the patterns of traffic crashes along road networks. Spatial analysis methods are powerful tools that can transform raw statistical and geographical data into valuable information that can help mapping and identifying contributing factors to crashes [49, 51].
Traditionally, spatial analysis in road safety studies employs historical crash data. However, depending only on such data is not advised since it eliminates the confounding effect of regression to the mean, i.e., random variations around the long-term mean value [52, 53]. This study applies a unique approach by utilizing crash risk criteria based on historical crashes and International Road Assessment Program (iRAP) survey databases to obtain meaningful and complementing risk assessments. The iRAP is a proactive program that predicts crash occurrence and injury severity and measures the cost-benefit ratio for potential countermeasure programs [54]. Essentially, iRAP assesses roadway segments based on their design features and traffic characteristics to develop star ratings related to the inherent level of roadway infrastructure safety [55]. iRAP star rating criterion objectively assesses the crash frequency and injury severity probability [37, 56]. One to five stars are assigned depending on the safety performance of the roadway segments [56]. The risk of crash occurrence or serious injury is the highest for segments rated 1-star, while it is the lowest for segments rated 5-stars. Researchers indicated that crash frequency on a roadway segment generally increases as its star rating decreases [52, 55]. Therefore, the iRAP star rating criterion is a reliable indicator of crash risk and is often used when historical crash data is unavailable [37, 52].
To assess and understand the contribution of PSFs to traffic crashes in their proximity, this paper aims to analyze crash hotspots along the southern route (E2) of the North-South Expressway in Malaysia, which has many PSFs on the mainline, based on different criteria: crash frequency of all vehicle types, frequency of all vehicles involved in crashes, frequency of heavy vehicles involved in crashes, injury severity index, and iRAP star rating. To the best of the authors' knowledge, this approach has never been employed for this purpose earlier. The study's findings are expected to provide decision-makers and traffic safety professionals with meaningful implications for the planning and design of PSFs.
2. STUDY AREA AND DATA COLLECTION
2.1. Study Area
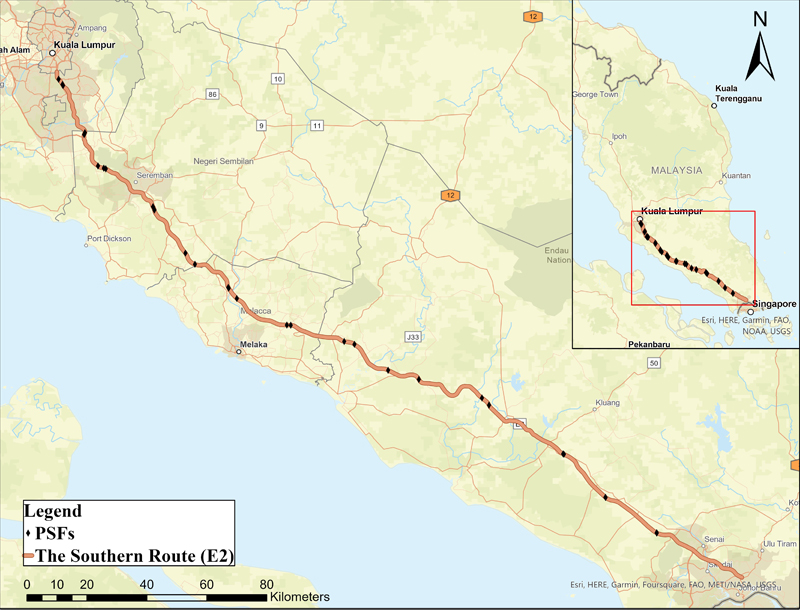
Malaysia has one of the best limited-access networks in South-East Asia [57]. Malaysian Roads are classified into three primary categories: expressways by 1,700 km, federal roads by 17,500 km, and state roads by 61,100 km [58]. However, expressways are considered the busiest roads, and almost 75% of heavy vehicle crashes occur on these routes [59]. The expressways were built per the R6 design standards of the Public Works Department of Malaysia, with a lane width of 3.5 m and a posted speed limit is 110 km/h, while for heavy vehicles, it is 80–90 km/h [60]. The study investigates the contribution of PSFs to traffic crashes on the southern route (E2) of North-South Expressways, with a total length of 310 km. It is an interstate limited-access route that passes through Peninsular Malaysia's four states: Selangor, Negeri Sembilan, Malacca, and Johor (Fig. 1). The study identified a total of 29 PSFs located and operating alongside the E2 route, including 8 rest areas, 18 lay-bys, and 2 fuel stations. The PSFs adjacent to a toll plaza, abandoned, or recently established were omitted from the analysis to ensure the consistency of PSFs existence with the timespan of collected crash data.
2.2. Crash and iRAP data
The study used databases in spatial analysis. The first database is the historical crash data along the E2 route for three years, from 2016 through 2018, obtained from the Malaysian Highway Authority (MHA). Each crash report provides information about crash details and conditions such as temporal information, location per 100 m, injury severity level, type of crash, type and class of vehicles involved, roadway geometric features, age and sex of the drivers, and environmental condition. The second database is iRAP survey data of the E2 route conducted by MIROS in 2016. This iRAP data includes information about roadway condition attributes, traffic characteristics, and iRAP star ratings for every 100-m road segment. In addition, the study used exported road network shapefiles from the Open Street Map. The linear referencing tool in ArcGIS was performed to geocode crash data for a 100-m-long segment in the map based on the stone marker information of each crash. The locations of crash data were projected using Rectified Skewed Orthomorphic (RSO) projection (meter) with 0.001 m of x, y tolerance.
3. METHODOLOGY
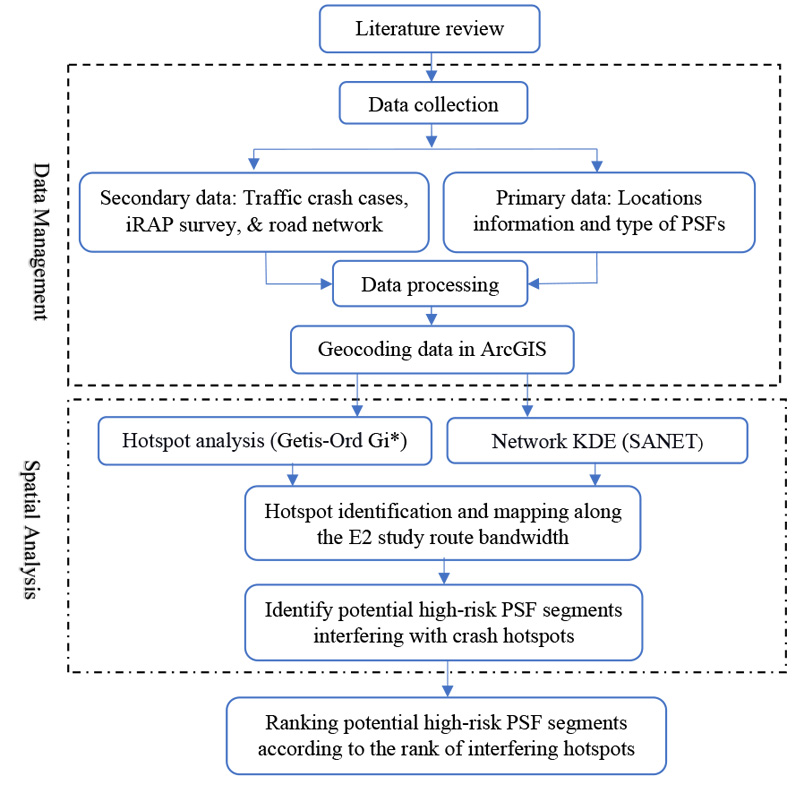
This section presents the methodology employed to achieve the study's aim. The first subsection explains the approach used to determine the critical length of the influential segments (i.e., conflict areas) of the PSFs. Then, the following subsection describes the two spatial analysis methods applied in the study, and the last subsection describes the adopted injury severity indices. Fig. (2) illustrates the overall methodology of this study.
3.1. PSFs Influential Segments
The literature manifests that most PSF studies did not fully focus on the interference of traffic crash hotspots with diverging and merging areas of the facility; instead, they investigated crash patterns along the entire route of the facilities. In general, PSF's ramps are similar to interchange ramps, except drivers have to park at a particular point in the facility. Due to the lack of studies conducted on the geometry of diverging and merging areas of PSFs, the authors assume that the geometric and operation characteristics of PSFs ramps are similar to those of interchange ramps. In other words, the PSF ramps can be regarded as special interchange ramps on the roadway. As a result, this study focused intensely on research conducted in the literature on diverging and merging areas of interchanges.
Essentially, ramps have two major safety concerns: diverging area, which is a specific segment along the exit ramp that splits up departing traffic from the mainline traffic stream; and merging area, which is a specific segment along the entrance ramp that connects merging traffic to the mainline traffic stream [6, 61]. Janson et al. [62] determined the influential ramp segments by assessing the variations in truck-related crash frequency in 80-meter-long segments upstream and downstream of the ramp. The results indicated that truck-related crash frequency stopped changing substantially beyond 402 m upstream of merging and diverging areas, and after 322 m and 242 m downstream of diverging and merging areas, respectively. Many researchers have suggested that the potential length of an influential segment of the interchange ramp is 762 m with two sub-segments: 457 m and 305 m upstream segment, and 305m and 457m downstream segment, from the diverging and merging gore's painted nose, respectively [36, 61, 63-66].
Barnett & Benekohal [67] adopted a distance of 762 m before and after the weigh station as an influential segment of the facility to assess the reduction in crash frequency after installing weigh-in-motion and automatic vehicle identification technologies at the weigh station.
On the other hand, the Manual on Uniform Traffic Control Devices (MUTCD) recommends that the weigh station or rest area's first advanced warning signs be placed 1000 m from the painted nose of the exit ramp [68]. An Alabama study assessed the implementation of a drowsy driving advisory system along Alabama's rural interstate routes [21]. The authors suggested that the influential segment of a rest area or interchange is within 1.67 km upstream and downstream of the facility. A recent study investigated the effects of merging vehicles on through-driver workload and traffic safety. Through a series of field experiments on speed variations, driver workload and behavior, the study developed a methodology for evaluating the level of safety in merging lanes [69]. The authors found that the higher the volume of merging vehicles, the higher the driver's workload that can reach a level exceeding the safety threshold, posing a safety concern. The study showed that the influential segment of the merging area, including the connection area of the merging ramp, is 1000 m from the painted entry nose downstream.
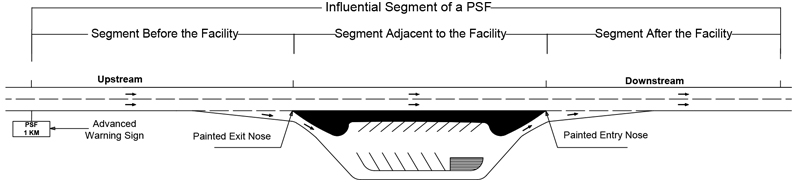
To determine the critical length of the influential segment or potential high-risk segment of a PSF, the proximate road segment to a PSF was divided into three main segments in this study, including the segment before the facility, the segment adjacent to the facility, and the segment after the facility. The segment before the facility is where a driver observes the PSF's advanced warning sign and then starts maneuvering to enter the facility as adopted in past studies [6, 7]. In other words, this segment represents the section between the advanced warning sign and the painted exit nose. The segment adjacent to the facility represents the road section between the painted exit and entry noses. The segment after the facility is the 1000-m section downstream of the painted entry nose, as adopted by Hu et al. [69]. As a result, each PSF has one influential segment in which traffic conflict may cause traffic crashes. Fig. (3) illustrates the typical layout of an influential segment around a PSF, as determined in this study.
The geometric features of the selected PSFs and their influential segments were identified utilizing Google EarthTM and ArcGIS and are listed along with their Annual Average Daily Traffic (AADT) in Table 1. It should be noted that the lengths of the segment before the facility and the segment adjacent to the facility vary among the facilities, with average distances equal to 1123 m and 700 m, respectively. It is worth mentioning that researchers in past studies on PSFs considered the segment composed of the downstream section of the diverging ramp area and upstream section of the merging ramp area a conflict area that equated to 610 m [36, 61, 63, 65]. This highlights the difference of this study to past studies in terms of considering PSFs influential segments.
| No. | Area Name | Facility Type | Route Type |
AADT (veh/year) |
Direction | No. Lanes | Location (km) | Nearest PSF Upstream (km) | Nearest PSF Downstream (km) | Segment Adjacent to Facility (km) | Segment Before Facility (km) |
|---|---|---|---|---|---|---|---|---|---|---|---|
| 1 | Kulai | Lay-By | sub-urban | 56562 | N | 2 | 33.1 | 18.9 | 21.05 | 0.64 | 1.28 |
| 2 | Kulai | Lay-By | sub-urban | 56562 | S | 2 | 33.2 | 21.05 | 18.9 | 0.64 | 1.1 |
| 3 | S. Renggam | Lay-By | Rural | 52706 | N | 2 | 54.15 | 21.05 | 20.65 | 0.65 | 1.11 |
| 4 | S. Renggam | Lay-By | Rural | 52706 | S | 2 | 54.25 | 20.55 | 21.05 | 0.57 | 0.87 |
| 5 | Machap | Rest Area | Rural | 48808 | N | 2 | 74.8 | 20.65 | 34.2 | 0.94 | 0.86 |
| 6 | Machap | Rest Area | Rural | 48808 | S | 2 | 74.5 | 31.1 | 20.25 | 0.97 | 0.76 |
| 7 | Y. Peng | Lay-By | sub-urban | 37476 | S | 2 | 105.6 | 29.5 | 31.1 | 0.59 | 1.05 |
| 8 | Y. Peng | Lay-By | sub-urban | 37476 | N | 2 | 109 | 34.2 | 37.5 | 0.61 | 0.98 |
| 9 | Pagoh | Rest Area | Rural | 37476 | S | 2 | 135.1 | 30.1 | 29.5 | 0.91 | 0.81 |
| 10 | Pagoh | Rest Area | Rural | 36494 | N | 2 | 146.5 | 37.5 | 15.1 | 0.86 | 1.19 |
| 11 | Tangkak | Lay-By | sub-urban | 36494 | N | 2 | 161.6 | 15.1 | 23.9 | 0.75 | 1.11 |
| 12 | Tangkak | Lay-By | sub-urban | 36494 | S | 2 | 165.2 | 19 | 30.1 | 0.8 | 0.97 |
| 13 | K. Bemban | Lay-By | Rural | 46457 | S | 2 | 184.2 | 25.8 | 19 | 0.78 | 1.07 |
| 14 | K. Bemban | Lay-By | Rural | 46457 | N | 2 | 185.5 | 23.9 | 19.8 | 0.74 | 2.27 |
| 15 | A. Keroh | Rest Area | Rural | 58050 | N | 3 | 205.3 | 19.8 | 4.4 | 0.84 | 1.1 |
| 16 | Ayer Keroh | Rest Area | Rural | 58050 | N | 3 | 209.7 | 4.4 | 15.5 | 0.78 | 1.05 |
| 17 | A. Keroh | Rest Area | Rural | 58050 | S | 3 | 210 | 20.3 | 25.8 | 0.76 | 1.07 |
| 18 | P. Linggi | Lay-By | Rural | 72373 | N | 3 | 225.2 | 15.5 | 23.4 | 0.73 | 1.13 |
| 19 | P. Linggi |
Lay-By | Rural | 72373 | S | 3 | 230.3 | 19.5 | 20.3 | 0.57 | 1.11 |
| 20 | Senawang | Lay-By | Rural | 76591 | N | 3 | 248.6 | 23.4 | 22.9 | 0.49 | 1.26 |
| 21 | Senawang | Lay-By | Rural | 76591 | S | 3 | 249.8 | 24.5 | 19.5 | 0.55 | 1.09 |
| 22 | Seremban | Fuel Station | sub-urban | 115269 | N | 3 | 271.5 | 22.9 | 0.7 | 1.34 | 0.85 |
| 23 | Seremban | Rest Area | sub-urban | 115269 | N | 3 | 272.2 | 0.7 | 15 | 0.8 | 1.39 |
| 24 | Seremban | Rest Area | sub-urban | 115269 | S | 3 | 274.3 | 12.2 | 24.5 | 0.77 | 1.26 |
| 25 | Nilai | Lay-By | sub-urban | 127596 | S | 3 | 286.5 | 19.2 | 12.2 | 0.6 | 1.38 |
| 26 | Nilai | Lay-By | sub-urban | 127596 | N | 3 | 287.2 | 15 | 18.9 | 0.59 | 1.3 |
| 27 | Serdang | Fuel Station | Urban | 142479 | S | 3 | 305.7 | 2.6 | 19.2 | 0.17 | 0.18 |
| 28 | Serdang | Lay-By | Urban | 142479 | N | 3 | 306.1 | 18.9 | 2.66 | 0.31 | 0.89 |
| 29 | Serdang | Lay-By | Urban | 142479 | S | 3 | 308.3 | 1.7 | 2.6 | 0.61 | 0.63 |
As mentioned previously, the designated influential segment of a PSF was defined as the sum of the segment before the facility, the segment adjacent to the facility, and the segment after the facility (Fig. 3). Before carrying out the spatial analyses, the influential segments of PSFs were delineated by buffering PSFs at two points. The first point is the painted exit nose with a distance of the segment before the facility, and the second point is the painted entry nose with a distance of the segment after the facility using the buffer tool in ArcGIS. It should be noted that there is no need to buffer segments adjacent to the facility since the buffered segments before and after the facility already overlapped and covered the adjacent segment. The buffering approach allowed for identifying the traffic crash hotspots that interfered with the influential segments of the facilities.
3.2. The Spatial Analysis Methods Identifying Crash Hotspot
Crash cluster patterns on roadway segments can be investigated by using spatial analysis. Several spatial methods have been applied to determine crash patterns and crash-prone locations (i.e., hotspots) along roadway segments. In recent years, numerous researchers have employed spatial techniques to detect traffic crash hotspots, such as Moran's I, Getis–Ord Gi*, kernel density estimation (KDE), and Kriging. Except KDE and Kriging, all these methods perform statistical significance testing of identified hotspots. These techniques are applied with a GIS-based system to identify high-risk segments or intersections [70]. Similarly, other methods employed in traffic safety engineering studies are Kriging method [71]; nearest neighborhood hierarchical (NNH) clustering [3, 72]; and K-mean clustering [73]. The Getis-Ord Gi* and KDE have been widely utilized to explore the spatial distributions of crashes and to detect hotspots [39, 48, 74-77]. In spatial analysis or incident pattern analysis, Getis-Ord Gi* and Moran's I are from the second-order effects, meaning they are associated with spatial dependency and include the relationship between the number of incidents in pairs across an area [78, 79]. In contrast, KDE belongs to first-order effects, i.e., the number of incidents per unit area at a particular point [78].
Y. Lu [80] compared KDE to other spatial analysis methods and found that KDE is more dependable and suitable for hotspot analysis. Erdogan et al. [81] employed KDE method to detect traffic crashes in the City of Afyonkarahisar in Turkey. The spatial analysis was able to detect high-risk segments which were highly concentrated at road intersections and junction points. Similarly, Blazquez & Celis [82] and Keskin et al. [83] observed the temporal patterns of hotspots along the road network using KDE and Moran's Index methods. Using the KDE method, Ha & Thill [84] studied the spatial variance of pedestrian crashes and unsafe bus stops. The research demonstrated the ability to address pedestrian and passenger safety concerns efficiently and economically. One of the advantages of the KDE technique over other clustering methods is that it is easy and simple to perform [71]. This could be one of the reasons why the KDE method is so prevalent in road safety. Manepalli et al. [75] illustrated that KDE and Getis-Ord Gi* yield comparable results for the same road crash data. The level of this similarity was not disclosed, however. Khan et al. [85] employed Getis-Ord Gi* to investigate the spatial distribution of weather-related crashes. A unique pattern was identified for each category of weather conditions, indicating the necessity to prioritize treatments depending on varying weather conditions and regional locations.
Because each spatial statistical method has a different computational process and detects different spatial hotspot patterns, it is recommended to conduct spatial analysis by employing a combination of spatial methods [74]. Comparable results can provide reliable hotspot patterns since using a single method may result in erroneous hotspots [48, 74]. Given the ubiquity of KDE and Getis-Ord Gi*, this study employed these two methods to detect crash hotspots, using five different criteria, along the E2 study route in Fig. (1). The interference between the influential segments of PSFs along the E2 route and the detected crash hotspots using each of the five criteria emphasizes the contribution of PSFs to different types of road crashes. The methodology for the two adopted spatial methods is described in the following subsections.
3.2.1. Planar Getis-Ord Gi* Hotspot Method
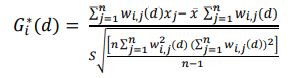
A hotspot is an area or a segment within a specified boundary where incidents are concentrated [74, 86]. Spatial statistical mapping is fundamental to comprehending incident points' spatial and temporal patterns [77, 78]. The Getis–Ord Gi* is a spatial autocorrelation method that was introduced by Getis and Ord [87] to determine the planar spatial hotspot patterns between the high and low feature values. The method examines each feature in the context of its neighbors within the same dataset [77, 88]. Although an intersection or segment has a high crash frequency, it may not be a statistically significant cluster. The statistically significant hotspot is obtained when the local sum of a feature and its surrounding neighbors differs significantly from the sum of all features or is too large to be due to random chance [77, 86, 87, 89]. Getis-Ord Gi* statistic can be computed using Equation (1) as follows:
 |
(1) |
Where: Gi* is the Getis-Ord z-score value at feature i; wi,j (d) is the linear spatial weight between feature i and j within distance band d; xj indicates the attribute value for feature j; n is the total number of features.
 |
(2) |
 |
(3) |
Equation 1 multiplies each feature's attribute values by the spatial weight matrix, wi,j, which depends on crash locations within the specified distance band, and sums the products. The sum of spatial weights was multiplied by the sample mean, and the product was subtracted from the aforementioned sum, representing the predicted value. This difference was then divided by the standard deviation to generate a standardized z-score for each site i [88]. Because the Gi* statistic is a z-score value, no additional computations are needed. A positive z-score value implies spatial clustering of features with high attribute values, and a negative z-score value implies clustering of features with low attribute values. A higher positive z-score value indicates higher intense clustering (i.e., hotspot). On the other hand, a lower negative z-score value indicates lower intense clustering (i.e., cold spot) [77, 90]. The Getis-Ord Gi* statistic is a spatial autocorrelation tool in ArcGIS pro.
3.2.2. Network Kernel Density Estimation (KDE) Method
The Kernel Density Estimation (KDE) method has become increasingly popular in traffic safety [91]. It has proven particularly useful in identifying the density of traffic crashes on network segments [92]. The KDE is a non-parametric estimation method that utilizes data to generate estimation density [39]. It can also visualize crash features' spatial distribution using a two-dimensional surface density map. The equation of density estimation at a location can be written as follows Equation (4):
 |
(4) |
Where: λ(s) is the density estimate at the location s, r is the selected bandwidth, dis is the distance from the location s to the location i, n is the number of observation points, k is a kernel function, k (dis/r) is the weight of ith point at a distance.
All crash point features are weighted according to their distance from location s and aggregated to estimate density at s. The kernel function or k contains information about decreased interaction between two locations as their distance increases. In other words, the farther the point is from site s, the less impact the point has on total density estimation [39]. The kernel function value is assigned to each cell as an individual cell value. The resultant cell density is calculated by summing the individual cell values [49]. The mean and standard deviation of the KDE were used to calculate the hotspot, and a raster map depicting the intensity of traffic crashes as continuous surfaces was also created. Locations with the lowest traffic crash density are represented by lighter shades, whereas locations with the highest traffic crash density are represented by darker shades [93, 94]. The KDE method's result is given in a raster format, consisting of a grid of cells. Bandwidth and cell size are essential parameters in a network KDE method. Its parameters literally depended on the size of the case study and the number of crashes to identify proper dense segments [95]. If the bandwidth is too small, the density pattern may be very sharp and only identify independent hotspot areas. Conversely, a larger bandwidth makes the density pattern too smooth, which will be hard to differentiate between hotspot areas [92]. The narrow bandwidths have generated patterns suited for depicting local impacts or hotspots at smaller scales [96]. It should be noted that there are no universal rules or standard bandwidth values to perform the hotspot analysis [71]. Selecting an appropriate bandwidth is entirely subjective [97]. Researchers have applied the trial and error approach to identify appropriate bandwidth and cell size [92, 98-100].
However, calculating the surface density may not be adequate to represent crash locations occurring in the one-dimensional linear space or the road network [101]. To avoid the biased density estimation of the planar KDE method in crash points, the network KDE method was developed to manifest the relevance of road networks and crashes or incidents that occurred along their segments [39]. In addition, planar KDE uses Euclidian distance between event locations, which may produce pseudo results in network spaces [95]. This is due to the fact that the distance between two points (dis) is calculated in terms of the shortest distance, which could be longer in a road network. In contrast, the network KDE method uses the actual distance between event locations in a road network [95]. For this purpose, Okabe et al. [102] developed Spatial Analysis along Networks (SANET), a network spatial analysis software to analyze spatial patterns in network space. Several studies have recently used this approach to determine the kernel density distributions for crash patterns [88, 91, 103, 104]. Okabe & Sugihara [105] extensively documented the computational details of SANET. The software requires a point shapefile of incidents that intersects with a polyline shapefile of the roadway centerline. The default kernel function uses the equal split continuous at nodes function on the network to provide an unbiased non-parametric continuous density estimate and reduce computation time in SANET [101, 105].
3.3. The Injury Severity Index
The injury severity index measures the severity or weight of a crash [70, 97]. Spatial crash analysis should be determined based on the injury severity index to increase the accuracy and validity of the analysis, as serious injury crashes are rarely distributed randomly [49, 104, 106]. As a result of the significant difference in social cost between different injury severity levels (i.e., fatal, serious injury, minor injury, and no injury), traffic crashes could not have an equivalent weight value [107]. Each injury severity level is attributed by a weighted value to detect the hotspot pattern of the injury severity index. The weighted values are calculated based on the proportion of severity levels in crashes concerning a country's level of development [108]. This study employs two weighting injury severity systems to conduct hotspot analysis by injury severity index and crash count hotspot analysis.
3.3.1. Road Engineering Association of Malaysia (REAM) System
The system was adopted as a guide for accident blackspot identification and road safety countermeasures by The Road Engineering Association of Malaysia (REAM). The Malaysian Institute of Road Safety Research (MIROS) used the system to identify prone crash segments to calculate their priority ranking values. According to the REAM system, weight values of 6, 4, 2, and 1 are provided for fatal crashes, serious injury, minor injury and property damage only (PDO) crashes, respectively [109]. The injury severity index for each segment can be calculated using Equation (5):
 |
(5) |
where X1 is the total number of fatal crashes, X2 is the total number of serious injury crashes, X3 is the total number of minor injury crashes, and X4 is the total number of PDO crashes.
3.3.2. Belgium System
The Belgium government adopted a weighted system as an official strategy for identifying hotspots by injury severity [110]. The system has been successfully employed to detect hotspots on different roads in India, Vietnam, and Brunei Darussalam [49, 78, 97]. Each crash incidence is assigned a weight value of 5 for fatality, 3 for serious injury, and 1 for minor injury and PDO under this system [110]. The injury severity index for each segment can be computed using Equation (6):
 |
(6) |
where X1 is the total number of fatal crashes, X2 is the total number of serious injury crashes, and X3 is the total number of minor injury and PDO crashes.
3.4. Parameter Selection for the Spatial Methods
3.4.1. Getis–Ord Gi* Hotspot Analysis
Crash data of all vehicle types, data of all vehicles involved in crashes and data of heavy vehicles involved that are located within a 10 m xy tolerance were integrated to produce aggregated event data. The Collect Events tool in ArcGIS was used to convert the aggregated event data to weighted point data. As a result, the shared feature boundary's integrity is maintained [104]. A new field for the weighted feature class was created and called ICOUNT, indicating the overall number of crashes at a unique location (e.g., an intersection or segment). As for hotspot analysis based on the injury severity index and iRAP star rating criteria, points were weighted according to their injury severity levels and star rating values, respectively, as mentioned previously in the methodology section. The weighted crash count values and weighted values of injury severity index and iRAP star rating examined their neighbors using a proposed bandwidth for each. Thus, determining an appropriate bandwidth is critical. The Incremental Spatial Autocorrelation (ISA) tool in ArcGIS was employed to choose a distance band or bandwidth associated with the highest z-score. The tool computes the spatial autocorrelation of a series of distance bands. Its results are provided in a line graph representing the relationship between different bandwidths and their associated z-scores for each of the five hotspot analysis criteria. The bandwidth is calculated so that each incident point should have at least one neighbor in the network. The distance associated with the highest z-score indicates that clustering is most pronounced for a hotspot analysis criterion.
The ISA tool failed to identify any peak for the weighted point data of crash frequency, frequency of all vehicles involved in crashes and frequency of heavy vehicles involved in crashes. No statistically significant peaks were found, and the values of the z-score keep increasing with the bandwidth because several spatial processes operate at different spatial scales [111]. This pattern indicates that on a smaller scale, the weighted crash points are not quite as close together as they are on a larger scale, but they still form statistically significant hotspots [112]. Alternatively, the distance that ensures each aggregated crash point has at least one neighbor was set as the proper bandwidth for the weighted count point data. However, this bandwidth may be overestimated when the crash type is less frequent and underestimated when the crash type is more frequent [113]. The Calculate Distance Band from Neighbour Count tool was performed to calculate the minimum, average, and maximum distances for the three hotspot analysis criteria with at least one neighbor in this study. The reported average values were selected as the bandwidth to eliminate overestimation or underestimation. The selection of conceptualization of spatial relationship (CSR) for spatial hotspot analysis should be based on understanding spatial interaction between features such as inverse distance, fixed distance band, and inverse distance squared. This selection was based on the performance of both CSR methods with aggregated point features data and their attribute values associated with using the Getis–Ord Gi* and KDE [49, 75, 88]. This study selected the inverse distance band to detect hotspots based on the crash frequency of all vehicle types, frequency of all vehicles involved in crashes and frequency of heavy vehicles involved in crashes. The fixed distance band was selected to detect hotspots based on the injury severity index and iRAP star rating. As a result, bandwidths of 110, 110, and 150 m were selected for crash frequency of all vehicle types, frequency of all vehicles involved in crashes and frequency of heavy vehicles involved in crashes, respectively. The ISA tool identified the bandwidth of 350 m for the injury severity index and iRAP star rating, in which the peak of z-scores was observed for both criteria. Since the average length of influential segments is 2800 m, those distance thresholds are suitable for understanding the distribution of crash patterns proximate to PSFs. In this analysis, hotspot locations (i.e., clustering) are denoted by a red colour code, whereas a blue colour code denotes cold spot locations (i.e., random). Both hotspots and cold spots are depicted at a statistical significance level of 0.10, 0.05, and 0.01 for confidence levels of 90%, 95%, and 99%, respectively.
3.4.2. Network KDE Analysis
The network KDE is performed to identify hotspots based on the five crash risk criteria along the E2 study route. The methodology used to select proper input parameters (i.e., bandwidth and cell size) in KDE function may differ between studies, as there is no universal definition of the optimal parameters [74, 97]. Whichever methodology is used, the primary controlling idea is to identify a set of segments with a higher level of safety risk [71]. The natural breaks (Jenks) classification was utilized to visualize the distribution of crash densities in various classes. This approach groups values that are similar and emphasizes the contrasts across classes. In other words, Jenks sets boundaries between classes where there are significant variations in data values [92]. Therefore, Jenks data classification was the best fit for the analysis. Crash risk densities were classified into four risk levels: minor in green, moderate in yellow, significant in red, and serious in Black. Since the network KDE analysis cannot directly estimate the density of weights of point features (i.e., injury severity index and iRAP star rating), the study developed an alternative technique by generating additional points at each crash point equivalent in number to the weight value of the crash point. Therefore, the analysis detected hotspots based on injury severity index and iRAP star rating by employing both the original crash points and the additionally generated points. It is worth mentioning that this alternative technique has not been applied in safety spatial studies to the best of the authors' knowledge.
Several bandwidths were examined separately to identify an optimal bandwidth for each hotspot analysis criterion that explains and visualizes incident points' spatial patterns. The cell size for each parameter was selected to be one-tenth of the chosen bandwidth, as recommended by Okabe et al. [102]. This study found that the optimal bandwidths estimating distinct density maps for the crash frequency, all vehicles involved, heavy vehicles crash frequency, injury severity index, and iRAP star rating criteria are 300 m, 350 m, 400 m, 350, and 400 m, respectively.
4. RESULTS AND DISCUSSION
The crash and iRAP survey data of the E2 study route were prepared and sorted for further analysis. According to crash reports, a total of 15529 vehicles were involved in 9736 crash cases with an average of 32 crashes/kilometer during the three years of the study, AADT with an average of 75,656 vehicles/year. Heavy vehicles were classified into three primary classes in crash reports: heavy vehicles with 2 axles and 5 or 6 wheels, heavy vehicles with 3 or more axles, and buses. In order to measure the contribution of PSFs to heavy vehicle crashes and due to their small sample size, crashes involving vehicle defects and unusual roadway conditions were omitted as they are not related to roadway features. After reviewing and filtering 2276 (23.38%) crashes involving heavy vehicles in crash data, only 1691 (17.37%) heavy vehicle crashes were considered in the study. It is worth mentioning that heavy vehicle crashes are considered the second-highest on average, 20-25% of the total traffic crashes in Malaysia [4], [114]. Furthermore, crash data revealed that the number of fatal crashes was 291 (2.99%), the number of serious injury crashes was 1575 (16.18%), the number of minor injury crashes was 1444 (14.83%), and the number of no injury/PDO crashes was 6426 (66.00%). The iRAP survey data contains 6218 segments for both directions of the E2 study route, and every segment holds an iRAP star rating value. Table 2 illustrates the distribution of the iRAP star rating values for 100 m segments along the E2 route. Almost 90% of the route is coded between 2 to 3-star ratings. The iRAP star rating value is affected by features and attributes directly associated with the presence of the PSFs, such as land use, passenger side object/distance, intersection type, intersection channelization, intersection quality, and intersecting road volume. ArcGIS Pro (ver. 10.8) was used for all analyses, and the network KDE analysis was conducted utilizing the SANET standalone (ver. 4.1) software. The following subsections present the results of spatial analyses based on Getis-Ord Gi* and network KDE methods.
| iRAP Star Rating Value | Number of Segments (%) |
|---|---|
| 1-Star | 355 (5.70%) |
| 2-Star | 2502 (40.24%) |
| 3-Star | 3109 (50%) |
| 4-Star | 241 (3.89%) |
| 5-Star | 11 (0.17%) |
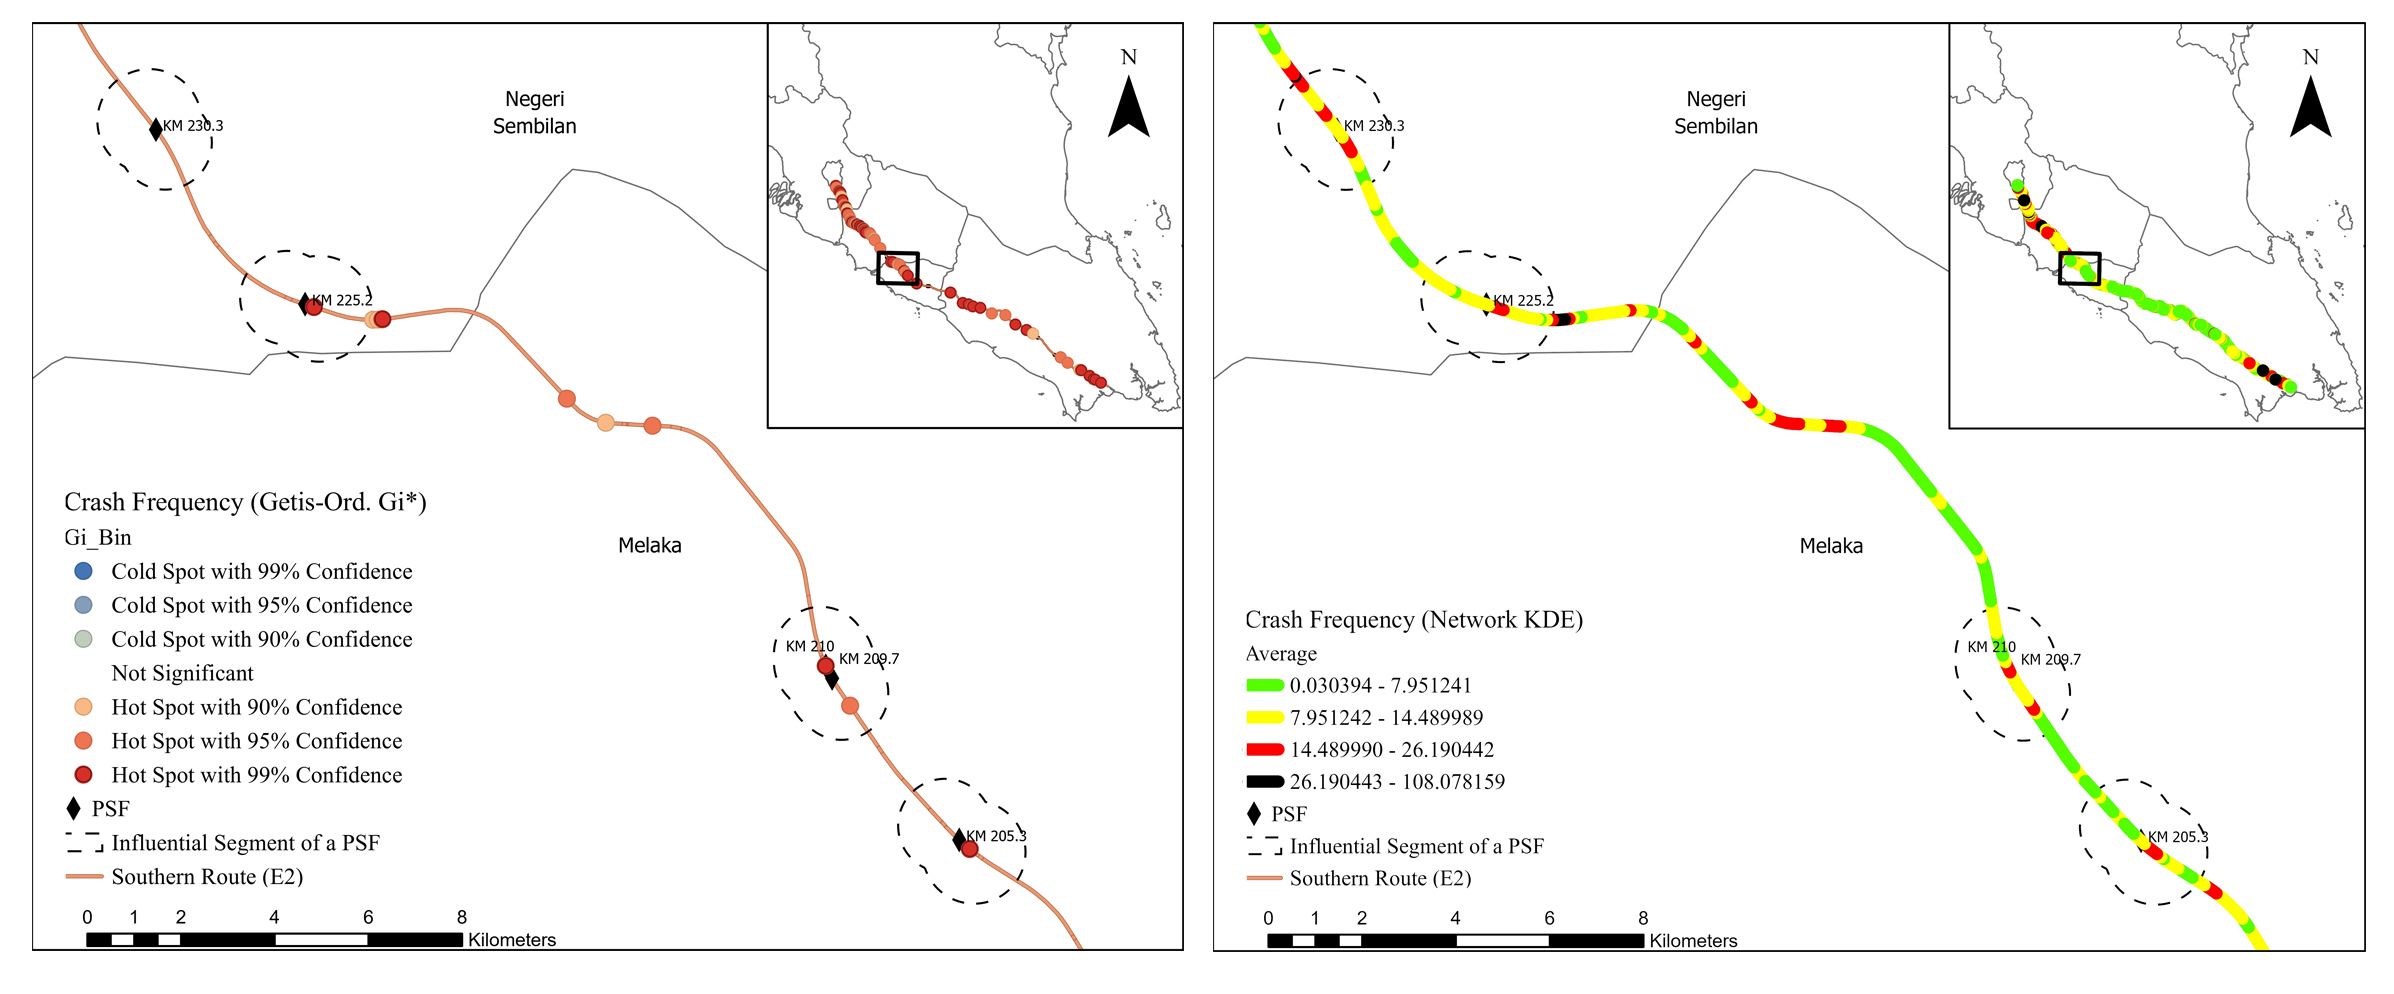
The results of the two spatial analyses for the different crash risk criteria were evaluated separately and presented in this section. Although the Getis-Ord Gi* method estimates the statistical significance of the hotspots (i.e., z-score), the network KDE method provides better visual identification of spatial clustering since the degree of each clustering is evaluated via four colors of risk levels (i.e., green, yellow, black, and red). The raster maps have a significantly higher level of linearity due to the network-based calculation.
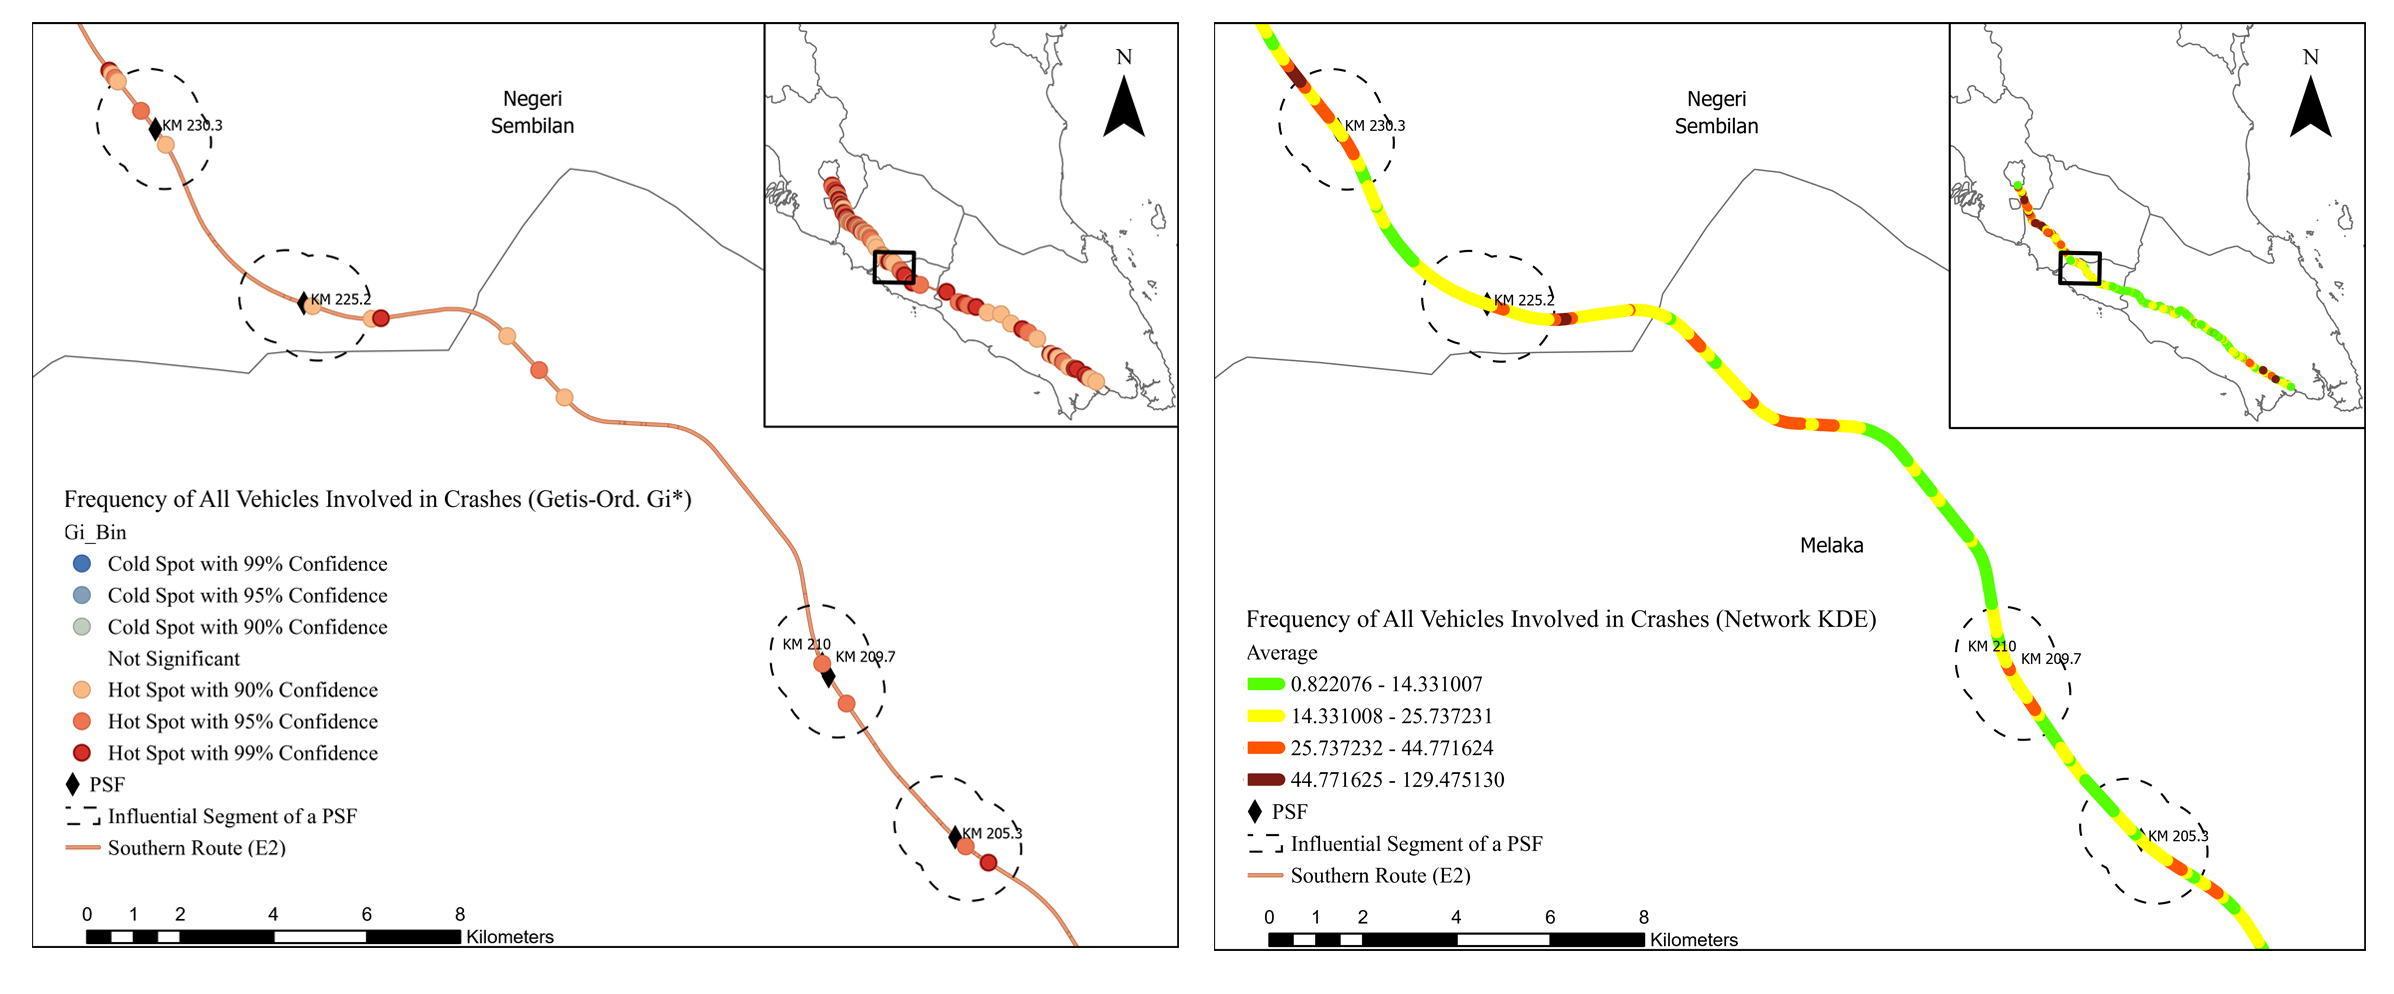
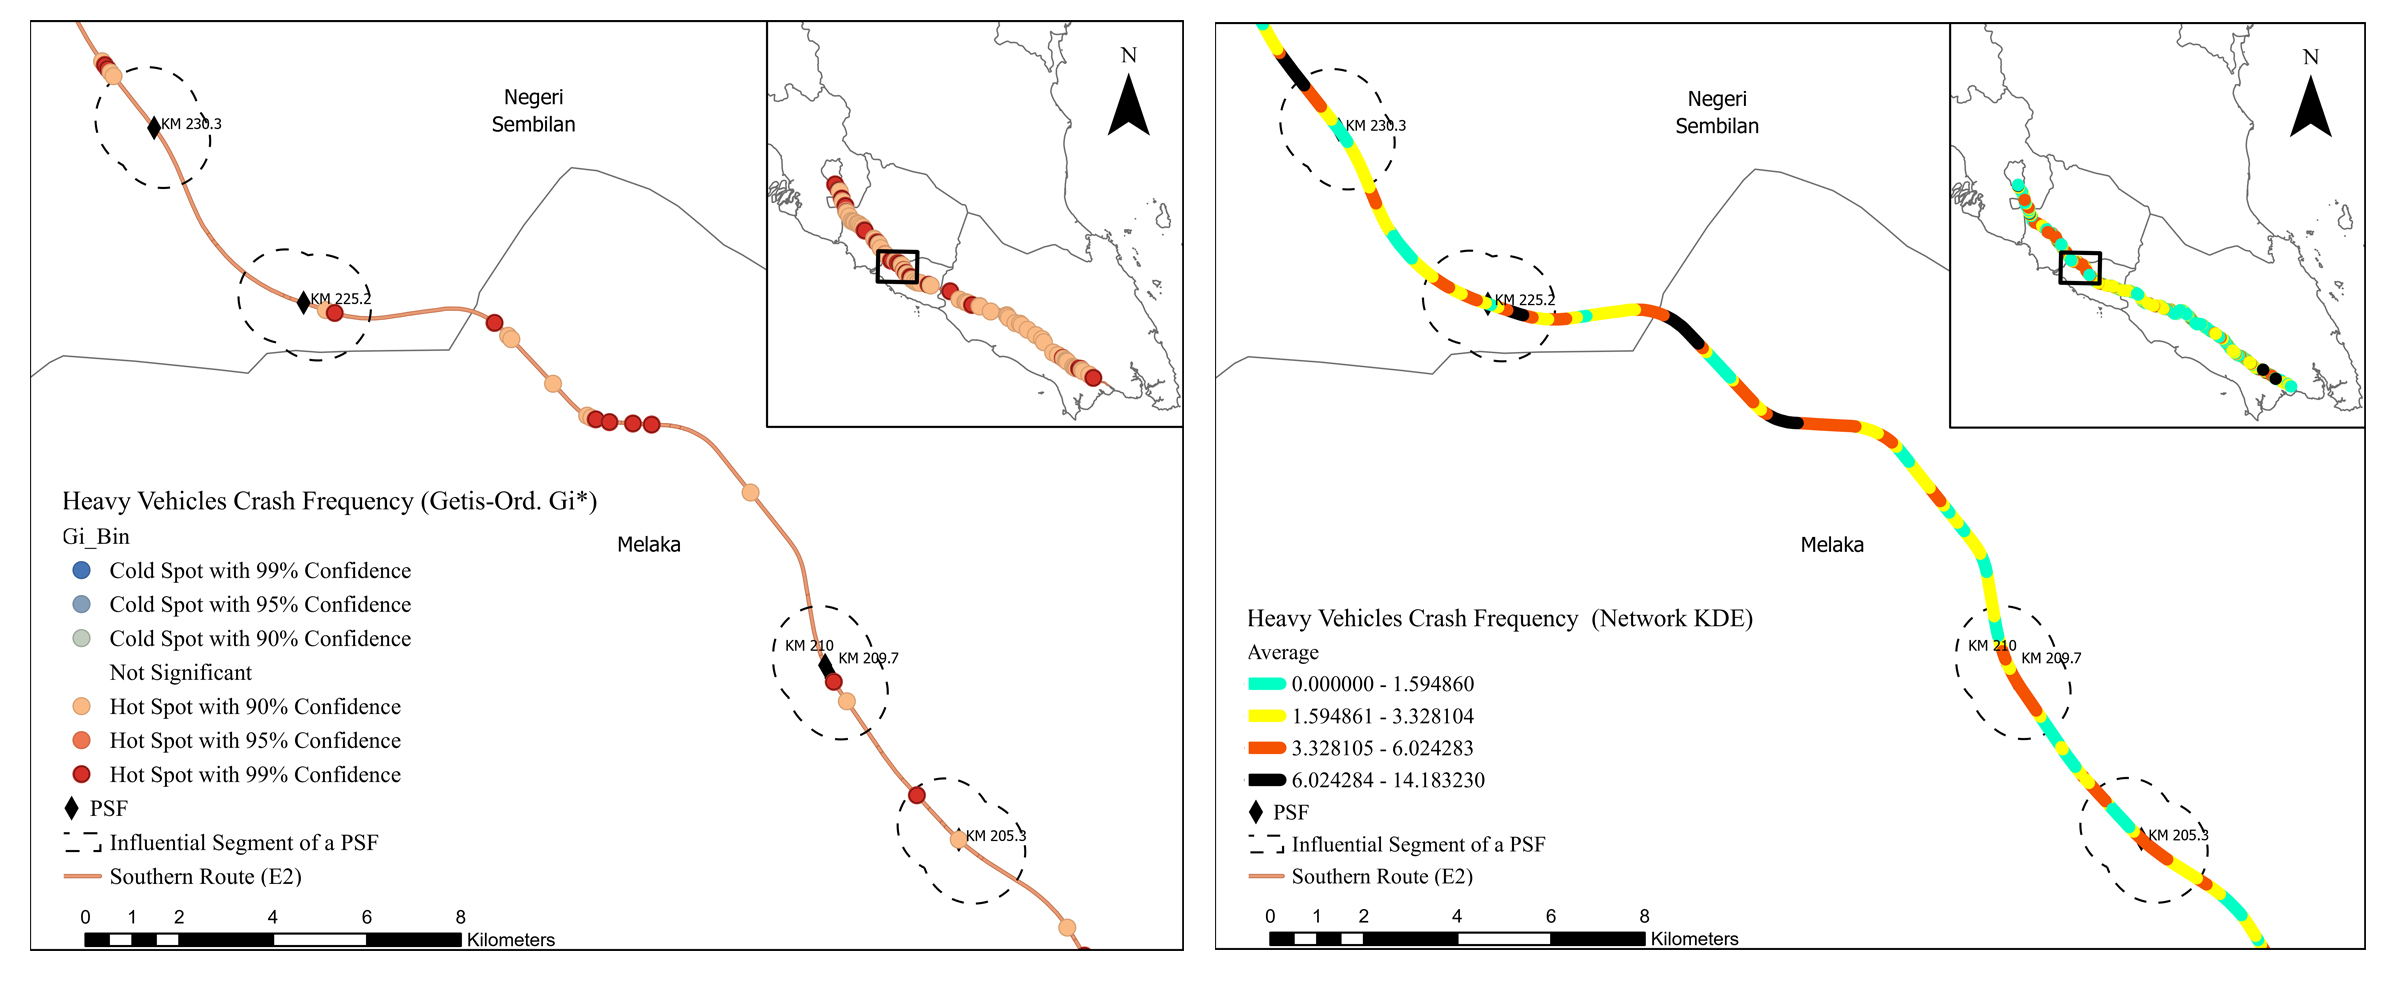
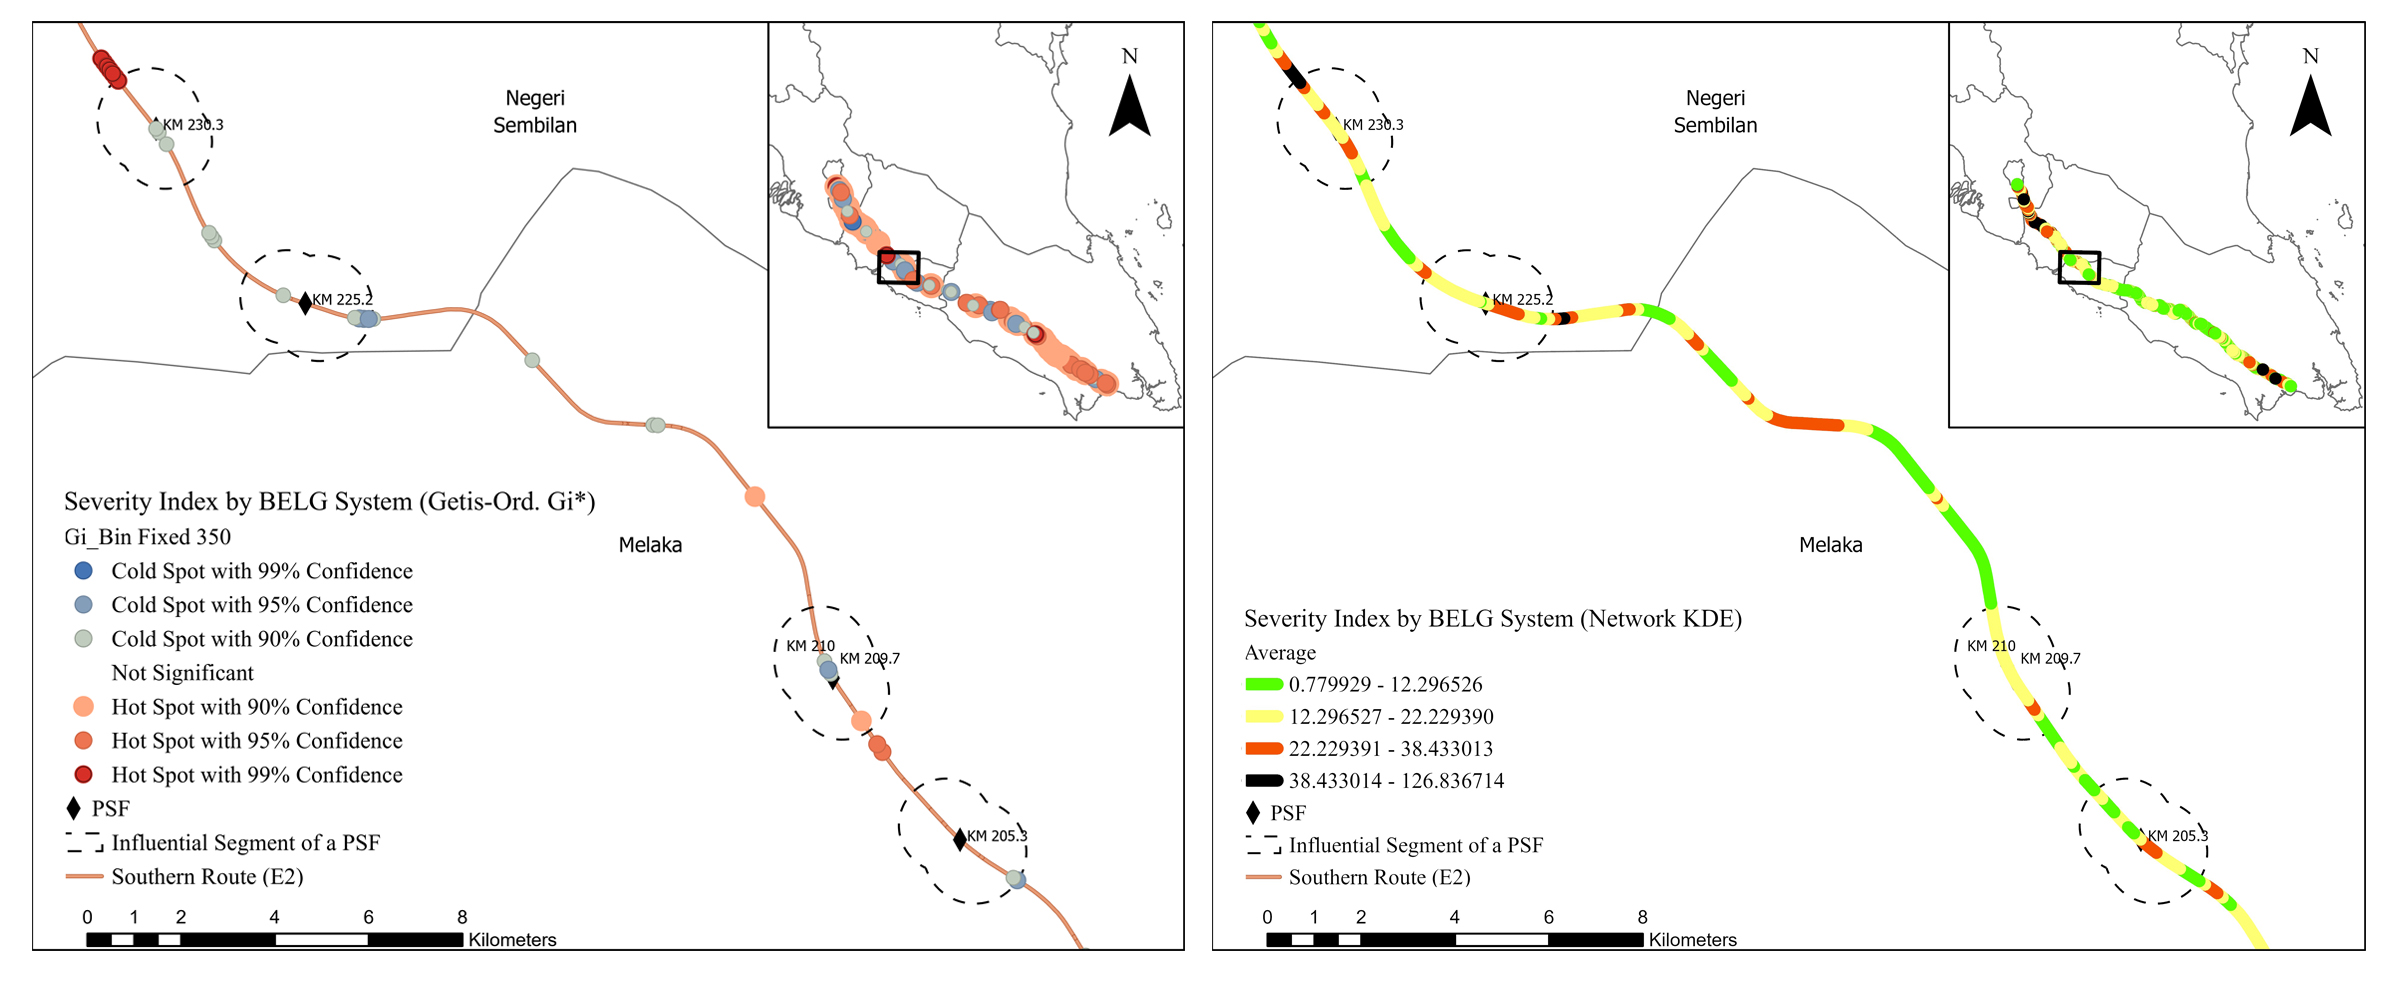
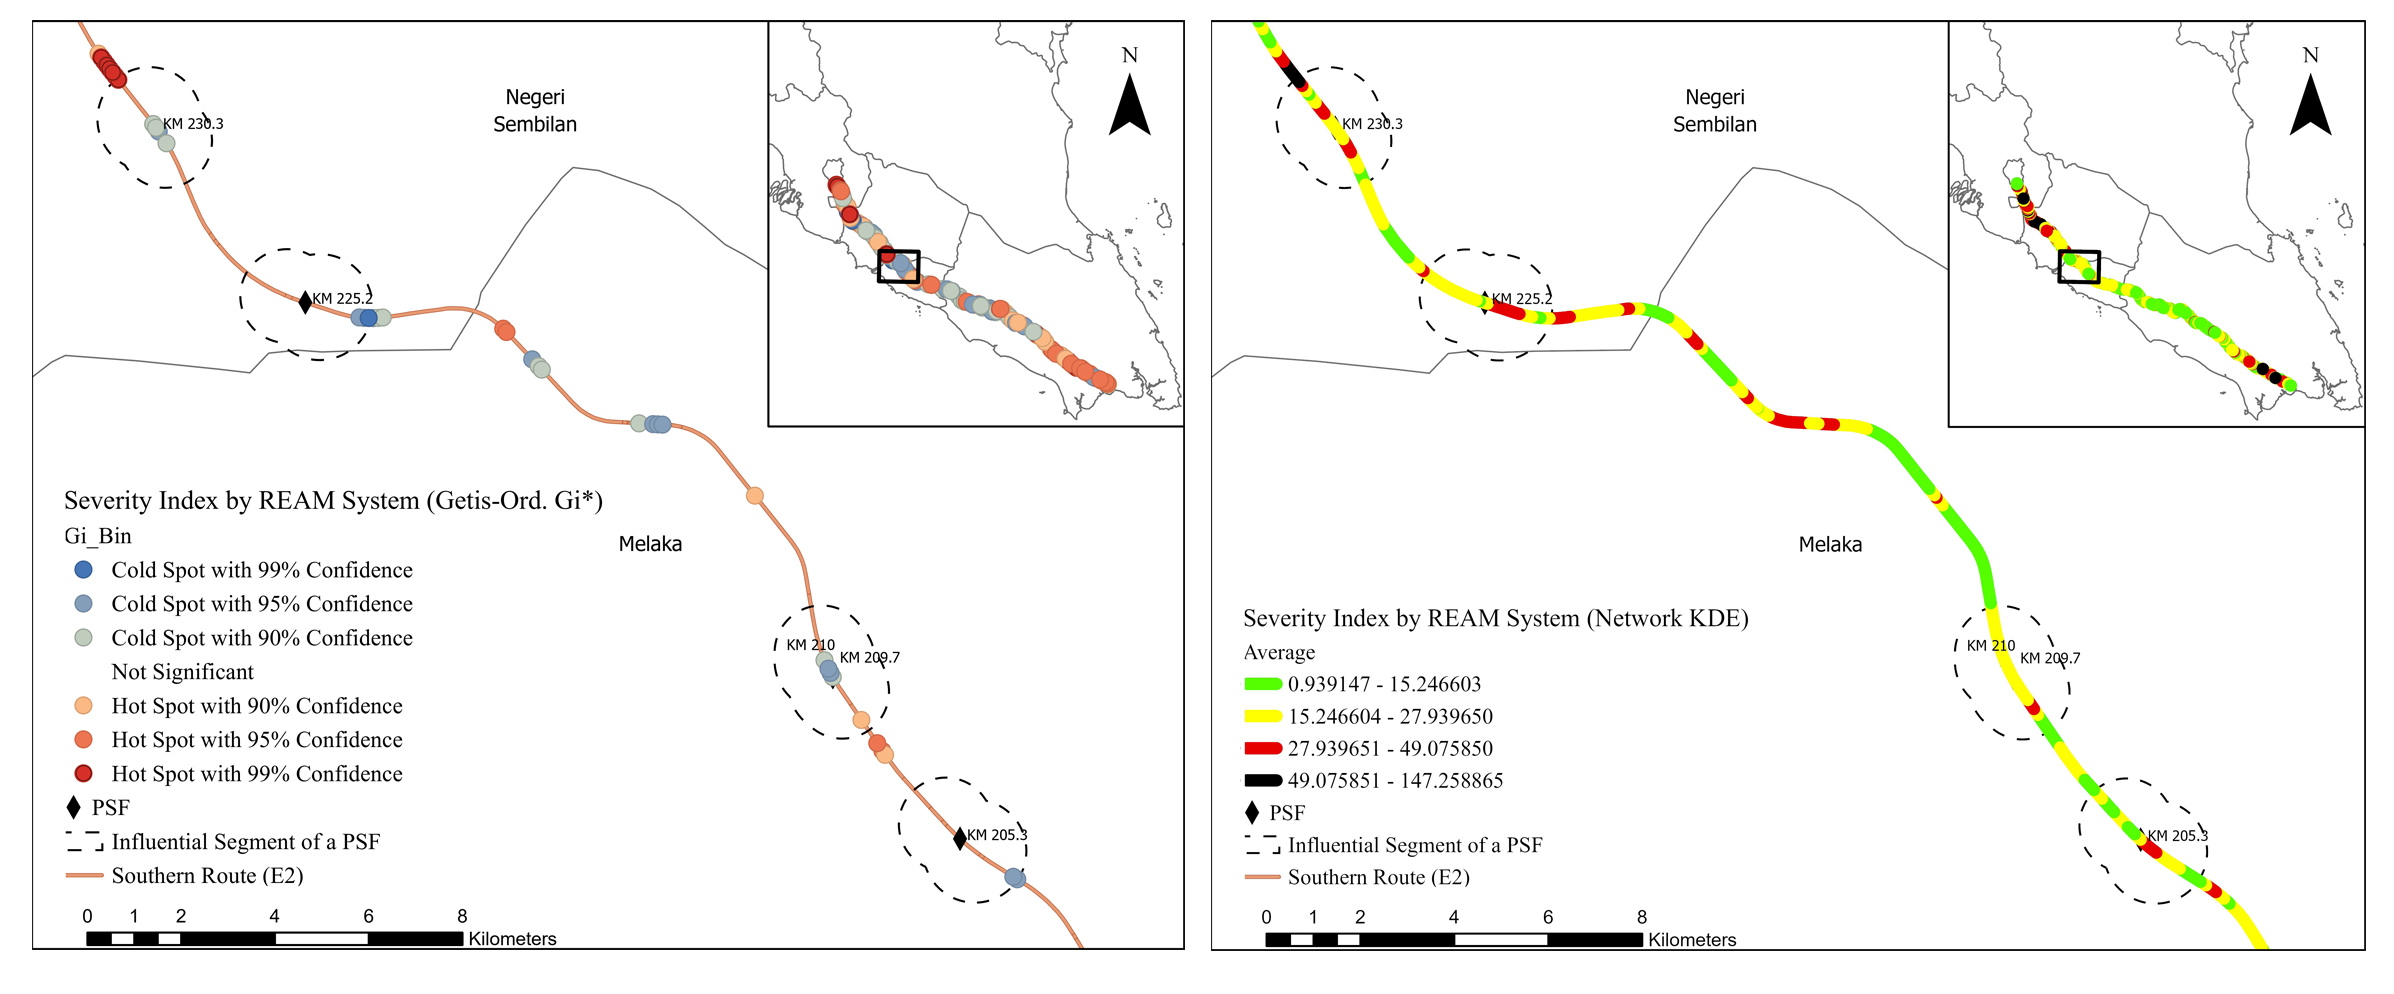
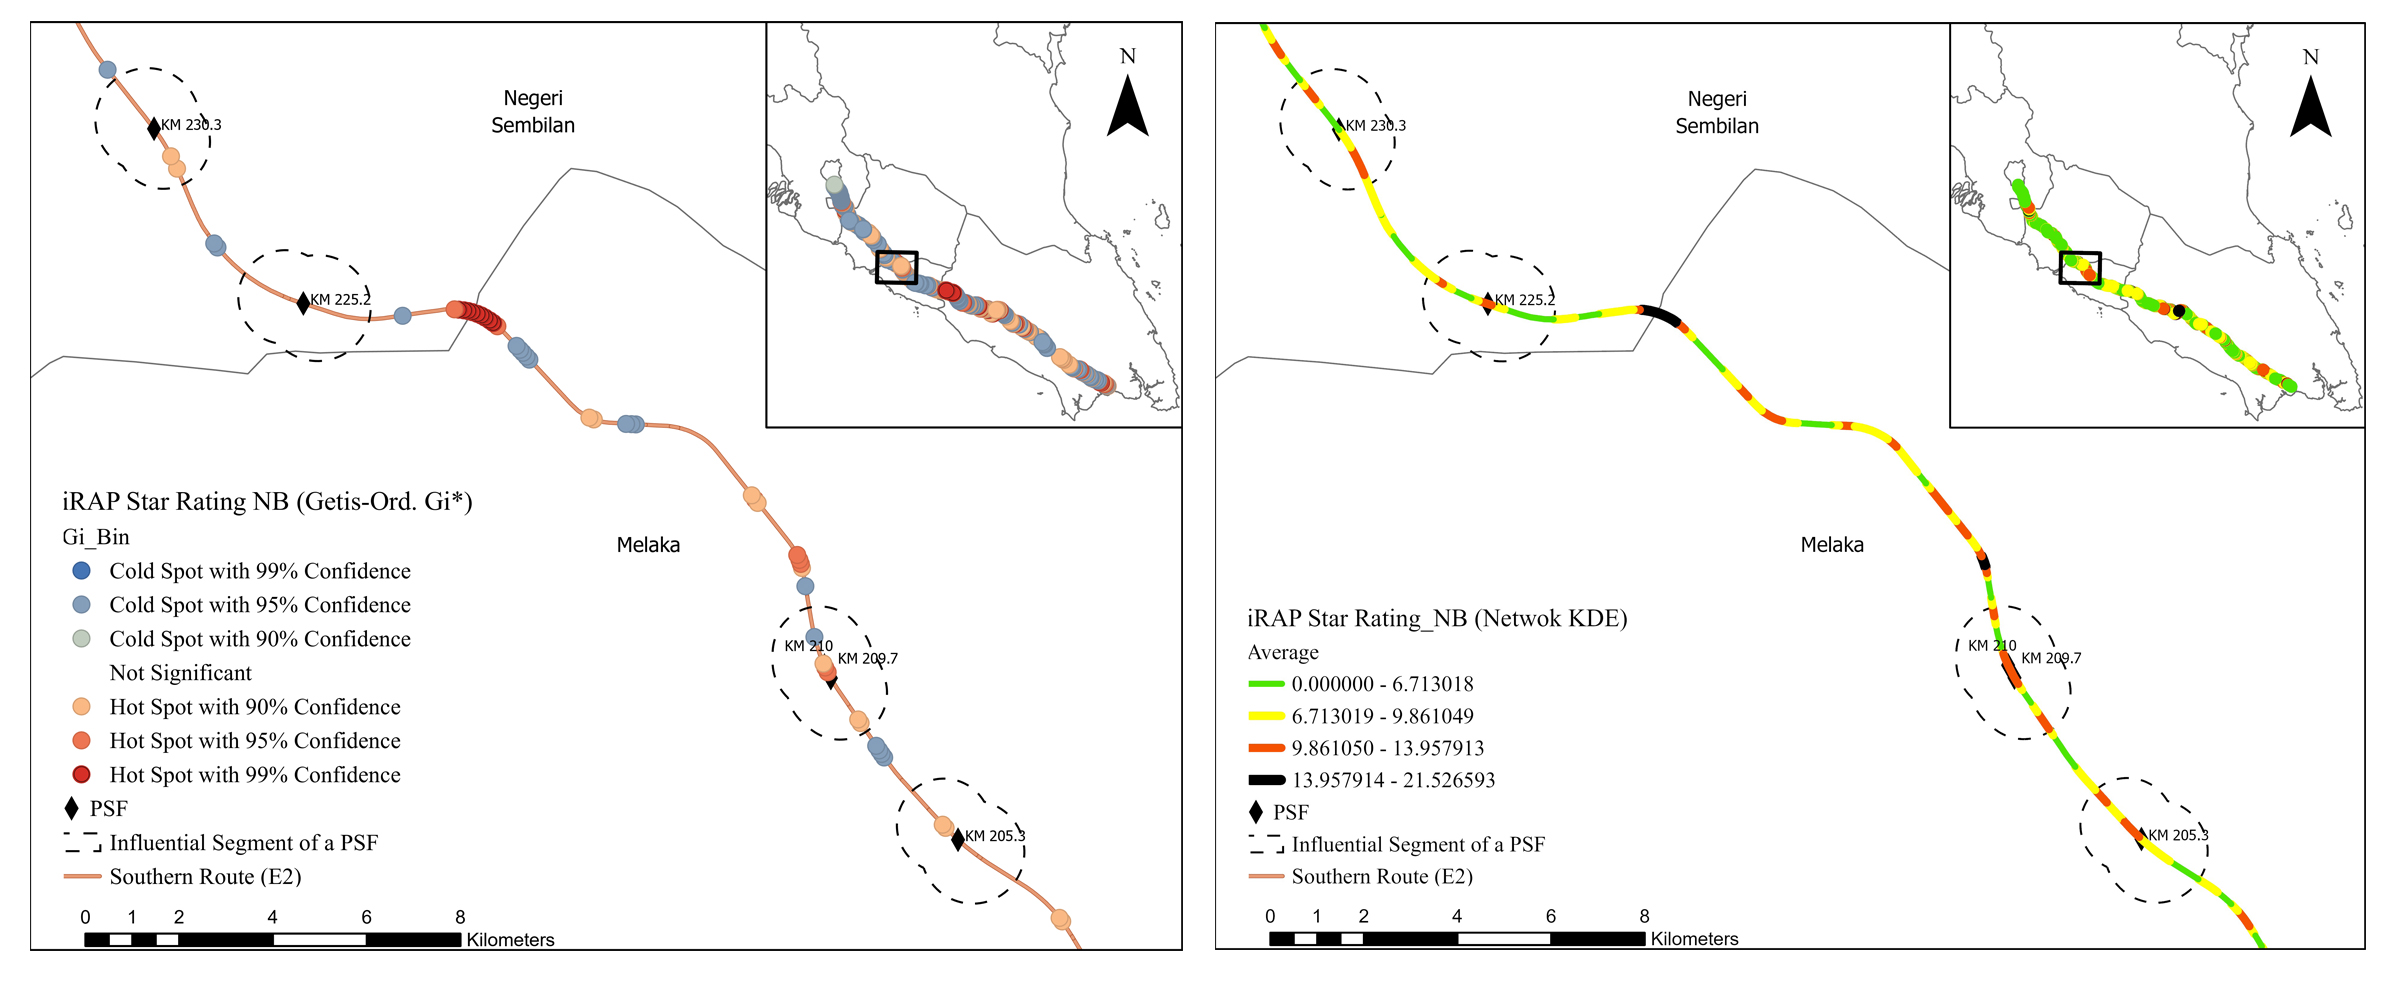
The hotspot results acquired from Getis-Ord Gi* and network KDE analyses determined by the five risk criteria were not always similar, as presented in Figs. (4-9). Although some hotspot patterns emerged in the network KDE analysis, they were not visible in the Getis-Ord Gi* analysis, and vice versa. For example, the Getis-Ord Gi* analysis did not detect any hotspot by crash frequency in the influential segments of Machap rest areas (N-S/B) at KM 74.5, K. Bemban lay-bys (N-S/B) at KM 185.5, and P. Linggi lay-by (S/B) at KM 230.3. In contrast, those segments were detected as hotspots with a significant risk level by the network KDE analysis (Fig. 4). Furthermore, the spatial distribution of hotspots detected by both analyses varies among the five hotspot analysis criteria, which conform to Gundogdu's [115] results. Figs. (4-9) show that the hotspots based on the crash frequency and frequency of all vehicles involved were highly overlapped, and relatively varied from the hotspots based on the frequency of heavy vehicles involved and injury severity index. The hotspots based on the severity injury indices using REAM and Belgium weighing systems show similar spatial patterns. However, the Belgium system yielded more hotspots and higher z-score values in the influential segments of PSFs using Getis-Ord Gi* analysis. Furthermore, hotspots based on iRAP star rating highly overlapped with the hotspots based on crash frequency and injury severity index.
Both analyses show that hotspots determined by the five crash risk criteria highly cluster along most of the influential segments of PSFs, indicating that they are potentially high-risk influential segments. Table 3 presents the percentages of potential high-risk influential segments of PSFs in the E2 study route for each risk criterion by the Getis-Ord Gi* and network KDE methods. Getis-Ord Gi* analysis shows that 62.07%, 72.41%, and 62.07% of the influential segments interfere with hotspot locations based on crash frequency, frequency of all vehicles involved, and frequency of heavy vehicle involved, respectively. Getis-Ord Gi* analysis shows that 65.52% and 62.07% of the influential segments interfere with hotspot locations based on REAM and Belgium injury severity indices, respectively. The Getis-Ord Gi* analysis of iRAP star ratings shows that almost 65.52% of influential segments are potential high-risk segments. Furthermore, the analysis shows that 27 of 29 (93.10%) influential segments interfered with hotspots based on either crash frequency, injury severity index, or/and iRAP star rating criteria. 21 of 29 (72.41%) influential segments interfered with significant hotspot locations detected by at least three hotspot analysis criteria. 77.78% of those potential high-risk segments were located on three-lane roadways with high AADT. Only five PSFs had their influential segments interfered with hotspots based on all hotspot analysis criteria and were located on three-lane roadways: A. Keroh rest areas (N-S/B) at KM 209.70 - 210, Seremban rest areas (N-S/B) at KM 272.2 - 274, and Seremban fuel station (N/B) at KM 271.5.
The network KDE analysis shows that the influential segments of PSFs interfered with hotspots of serious, significant and moderate risk levels, as shown in Table 3. For example, the hotspot analysis based on crash frequency shows that 24.14%, 62.07%, 13.79%, and 0.00% of the influential segments interfere with hotspots of serious, significant, moderate, and minor risk levels, respectively. It can be said that 86.21% of the influential segments are potential high-risk segments based on interference with crash frequency hotspots of serious and significant risk levels. Furthermore, 23 of 29 (i.e., 79.31%) influential segments interfered with hotspots of at least a significant risk level based on at least four hotspot analysis criteria. 16 of 29 (i.e., 55.17%) influential segments interfered with hotspots of at least a significant risk level based on all hotspot analysis criteria. Eight influential segments interfered with hotspots of a serious risk level based on at least three hotspot analysis criteria and were located on three-lane roadways. Even though some influential segments interfered with hotspots of a moderate risk level based on the crash frequency and injury severity criteria; however, their adjacent basic segments interfered with hotspots of a minor risk level or no hotspots for the same criteria. In addition, 77.78% and 76.00% of potential high-risk segments detected by Getis-Ord Gi* and network KDE analyses, respectively, are located within 4 km of other road facilities, e.g. interchange, horizontal curve, fuel station, slip road, and toll plaza. This consistency in the results manifests that the influential segments of PSFs are more likely to experience crashes and severe injuries. Overall, the findings indicated that those influential segments are potentially high-risk locations compared to their adjacent basic segments.
| Risk Criterion | Hotspot (Gi*) | Risk Level (Network KDE) | |||
|---|---|---|---|---|---|
| Serious | Significant | Moderate | Minor | ||
| Crash frequency | 62.07% | 24.14% | 62.07% | 13.79% | 0.00% |
| Number of all vehicles involved | 72.41% | 20.69% | 51.72% | 27.59% | 0.00% |
| Heavy vehicle crash frequency | 62.07% | 31.03% | 48.28% | 20.69% | 0.00% |
| Injury severity index by REAM system | 65.52% | 24.14% | 65.52% | 10.34% | 0.00% |
| Injury severity index by Belgium system | 62.07% | 31.03% | 58.62% | 10.34% | 0.00% |
| iRAP star rating | 65.52% | 34.48% | 51.72% | 10.34% | 3.45% |
| Hotspot Analysis by Crash Criterion | Gi* Z -score | Gi* P-value | Risk Level | Approx. KM-Post | Facility Name | Facility Type | Area Type | No. of Lanes | Direction |
|---|---|---|---|---|---|---|---|---|---|
| Crash frequency | 4.77 | 0.000 | Serious | 272-271 | Seremban | Rest Area/Fuel Station | Sub-urban | 3 | N |
| 3.68 | 0.000 | Significant | 146 | Pagoh | Rest Area | Rural | 2 | N | |
| 3.14 | 0.002 | Significant | 165 | Tangkak | Lay-By | Sub-urban | 2 | S | |
| 3.13 | 0.002 | Significant | 205 | Ayer Keroh | Rest Area | Rural | 3 | N | |
| 2.89 | 0.004 | Serious | 274 | Seremban | Rest Area | Sub-urban | 3 | S | |
| All vehicles involved in crashes | 3.79 | 0.000 | Serious | 272-271 | Seremban | Rest Area/Fuel Station | Sub-urban | 3 | N |
| 3.62 | 0.000 | Serious | 286 | Nilai | Lay-By | Sub-urban | 3 | S | |
| 3.22 | 0.001 | Significant | 205 | Ayer Keroh | Rest Area | Rural | 3 | N | |
| 3.05 | 0.002 | Serious | 274 | Seremban | Rest Area | Sub-urban | 3 | S | |
| 3.02 | 0.002 | Significant | 54 | S.Renggam | Lay-By | Rural | N | N/S | |
| Heavy vehicle crash frequency | 3.10 | 0.00 | Significant | 205 | Ayer Keroh | Rest Area | Rural | 3 | N |
| 3.09 | 0.00 | Significant | 210-209 | Ayer Keroh | Rest Area | Rural | 3 | N/S | |
| 3.09 | 0.00 | Significant | 165 | Tangkak | Lay-By | sub-urban | 2 | S | |
| 3.09 | 0.00 | Significant | 184-185 | K. Bemban | Lay-By | Rural | 2 | N/S | |
| 3.09 | 0.00 | Serious | 225 | P. Linggi | Lay-By | Rural | 3 | N | |
| Injury severity index (Belguim System) | 4.63 | 0.00 | Serious | 308 | Serdang | Lay-By | Urban | 3 | S |
| 3.11 | 0.00 | Serious | 230 | P. Linggi | Lay-By | Rural | 3 | S | |
| 3.05 | 0.00 | Significant | 33 | Kulai | Lay-By | sub-urban | 2 | N/S | |
| 2.99 | 0.00 | Significant | 286-287 | Nilai | Lay-By | sub-urban | 3 | N/S | |
| 2.86 | 0.00 | Significant | 184-185 | K. Bemban | Lay-By | Rural | 2 | N/S | |
| iRAP Star Ratings | 3.920 | 0.01 | Serious | 308 | Serdang | Lay-By | Urban | 3 | S |
| 3.918 | 0.00 | Serious | 274.3 | Seremban | Rest Area | sub-urban | 3 | S | |
| 3.699 | 0.00 | Serious | 161.6 | Tangkak | Lay-By | sub-urban | 2 | N | |
| 2.992 | 0.00 | Serious | 286.5 | Nilai | Lay-By | sub-urban | 3 | S | |
| 2.690 | 0.01 | Significant | 146 | Pagoh | Rest Area | Rural | 2 | N |
The potential high-risk segments were ranked based on their statistical significance of z-score values and checked with their density risk levels for each hotspot analysis criterion, as presented in Table 4. Due to the limited space of the paper, the table presents the five highest-risk segments of PSFs for each hotspot analysis criterion. The crash hotspots by injury severity index based on the Belgium weighting system were presented in Table 4, excluding hotspots based on the REAM system, since the former provides higher z-scores in the Getis-Ord Gi* analysis than the latter. The table can also help prioritize actions to mitigate traffic crashes in proximate segments to PSFs.
It is evident from table 3 and 4 that hotspot analyses based on the crash frequency and all vehicles involved yield similar results in terms of hotspot locations and ranks. This result is consistent with the fact that the crash frequency data is directly related to the data of all vehicles involved in crashes. Most potential high-risk segments of PSFs detected by the five hotspot analysis criteria, excluding the frequency of heavy vehicles involved, are located in three-lane roadways with high AADT and urban or sub-urban area type. Furthermore, the hotspots that were determined using the frequency of heavy vehicle crashes tend to interfere with influential segments of PSFs existing in rural areas with low AADT. These results indicate that heavy vehicle crashes are more likely to interfere with influential segments of PSFs in rural areas, conforming to Dong et al. [117]. Driving through these road segments is monotonous and may cause fatigue to heavy vehicle drivers [118]. Hotspots based on the Injury severity index interfered with influential segments of PSFs with high-speed and heavy traffic volume because when crashes occur in these segments, occupants are more likely to sustain severe injuries [119].
CONCLUSION
Even though PSFs offer various benefits to road users, stakeholders, and external entities, this study sheds light on their contribution to traffic crashes on limited-access roadways, which could assist decision makers and road planners in designing and planning safer PSFs. This study applied Getis-Ord Gi* and network KDE methods to detect traffic crash hotspots along the E2 study route with 29 PSFs. The two methods used five different hotspot analysis criteria, crash frequency of all vehicle types, frequency of all vehicles involved in crashes, frequency of heavy vehicles involved in crashes, injury severity index, and iRAP star rating. Interference between crash hotspots and the influential segment of any of these PSFs indicated the contribution of this PSF to traffic crashes and marked it as a potential high-risk PSF of a safety rank based on the risk level of interfering crash hotspot. Getis-Ord Gi* analysis showed that 62.07%, 72.41%, 62.07%, 65.52%, 62.07% and 65.52% of PSFs were potentially high-risk facilities based on crash frequency, frequency of all vehicles involved, frequency of heavy vehicle involved, REAM injury severity index, Belgium injury severity index and iRAP star rating, respectively. On the other hand, network KDE identified that almost 100% of PSFs were potentially high-risk facilities of either serious, significant or moderate risk levels, based on the same hotspot analysis criteria. 77.78% and 76.00% of potential high-risk PSFs of three-lane influential segments detected by Getis-Ord Gi* and network KDE analyses, respectively, are located within 4 km from other road facilities, e.g., interchange, horizontal curve, fuel station, slip road and toll plaza. This indicates that crashes in proximity to PSFs may increase when the number of lanes increases and traffic flow is interrupted by other road facilities. Hotspots based on crash frequency, injury severity index, and iRAP star rating interfered with the influential segments of PSFs with high speed and heavy AADT. This indicates that crash frequency and severity increase in proximity to PSFs with high speed and high traffic volume. Hotspots based on heavy vehicle crashes interfered with two-lane influential segments of PSFs with low traffic volume in rural areas. This indicates that heavy vehicle crashes are more likely to increase in proximity to PSFs in rural areas.
LIMITATIONS AND FUTURE RESEARCH
The network used in this study was attributed to the centerline, and crash locations were geocoded along this line, neglecting the nature of two-directional traffic flow. A two-directional roadway dataset will help acquire a precise spatial relationship between crash locations and the proximity to PSFs. The study explored crash data between 2016 and 2018 only. Since this data is out of date and may cover a short period, the detected hotspots may vary if the PSFs were constructed or improved after 2018. Additionally, this analysis could be enhanced in terms of depth and findings. The spatiotemporal pattern can be investigated further to study the contribution of various seasons to crashes occurring in proximity to PSFs. The prioritized locations should have used 3-D density maps of the hotspot crashes on the network. Crash hotspots interfering with the influential segments could be associated with crash contributory factors other than the existence of PSFs, such as road geometry, weather conditions and traffic characteristics. A further study is recommended to identify and evaluate countermeasures to traffic crashes near PSFs. These countermeasures may comprise enhancing drivers' awareness by installing raised pavement markers at exit and entry ramps from and to PSFs to increase their visibility and installing speed cameras near PSFs to force drivers to reduce their speed [103, 120].
LIST OF ABBREVIATIONS
| PSFs | = Parking service facilities |
| GIS | = Geographic Information System |
| MUTCD | = Manual on Uniform Traffic Control Devices |
CONSENT FOR PUBLICATION
Not applicable.
AVAILABILITY OF DATA AND MATERIALS
The data set used during this study are available from the corresponding author [S.Z.I] upon reasonable request.
FUNDING
None.
CONFLICT OF INTEREST
The authors declare no conflict of interest, financial or otherwise.
ACKNOWLEDGEMENTS
The authors would like to thank the Malaysia Institute of Transport (MITRANS) at the University Teknologi MARA (UiTM), Malaysia for their financial support.

