All published articles of this journal are available on ScienceDirect.

Policies and Models for Efficient and Eco-sustainable Ports
Abstract
Introduction
The port system is one of the main sources of national and international trade; it is essential for the transfer of freight and people, but at the same time it is a critical site in relation to energy consumption and greenhouse gas emissions. For this reason, some management strategies are developed to optimize the freight terminal activities using innovative technologies to limit the negative environmental impacts.
Objective
This study focuses specifically on vehicle management on the landside of a container port and aims to evaluate the impacts and performance of the system, in which the traditional handling units are replaced by green and automated ones. The study is part of a framework of actions to be undertaken to pursue the target “to make a port more competitive and sustainable”.
Methods
This study deals with the assessment of the handling time, energy consumption, and gas emission deriving from the innovative vehicular technologies capable of making the port more competitive and sustainable. A modeling approach is used to understand the possible impacts generated by new technologies on port performance. The models have been calibrated on the basis of a large database carried out by a specific survey of port operators and specialized companies.
Results
A case study is proposed about the container port of Gioia Tauro (Italy), an important port in the center of the Mediterranean area in terms of transshipment. Some specific indicators are analyzed by quantitative models, such as energy consumption for efficiency and harmful gases for ecology, considering the current port configuration and some project scenarios in which green and automated handling units are used. The analysis has been performed using a spreadsheet, with automatic calculation. The input data related to the actual port configuration have been provided by the port management company; those related to the scenarios have been taken from specialized companies. Data included refer to the last 5 years.
Conclusion
The study highlights the advantages of green and automated handling means; the use of these solutions represents a fundamental step to making a port more competitive and sustainable. This research could stimulate policymakers and port managers towards innovative technological solutions to make a port more competitive and sustainable. The proposed approach can be applied and extended to other contexts.
1. INTRODUCTION
Ports play a key role in economic and social development at the local and national levels; they affect the GDP and produce employment. Several research works have highlighted the importance of ports in regional and national development trends [1-6]. Port activity is no longer limited to the movement of goods, but it represents a key role in the supply chain, thus becoming a fundamental part of international trade [7].
In 2018, in the Italian context, the sea economy produced 46.7 billion of added value, which equaled 3.0% of the total national economy. These results are due to the work of 885 thousand employees in the whole sector, which accounts for 3.5% of the total employment in the country. In this context, containerized goods are of great importance, representing 22.6% of the total traffic. The intermodal container traffic (ship-truck and ship-train) is particularly important for Italy, representing 38% of import-export; it is the second preferred type of transport for foreign trade (after road transport) [8].
The logistic and economic processes of the ports have to guarantee both the environmental protection of the terminal areas and the environmental impacts on the surrounding space, especially in a context where sustainability is one of the main goals of the international, European, and national policies. Sustainable development actions in ports should be supported with the aim of providing adequate services and infrastructures. It is essential to investigate the impacts on the sustainability of the ports by considering the importance of social, economic, and environmental components.
The main aim of this study is to analyse the impacts generated both by the use of green handling means (hybrid and electric) and by providing for the automation of operations (automated vehicles) in a container port. The attention is on the assessment of some indicators of efficiency and ecology, such as handling time, energy consumption, and air pollutants emission. The adoption of innovative vehicular technologies could make the container port smarter, more competitive, and sustainable, if some economic, social, and environmental conditions, closely related to the port system, are satisfied. However, this study does not consider the impacts generated by ships.
This study aims, by a modeling approach, to understand the possible impacts generated by new HU technologies on port performance. The models have been calibrated on the basis of a large database carried out by a specific survey of port operators and specialized companies.
This study is organized into four parts. The first one proposes a literature review concerning the topics of interest. The second section describes the typical freight handling in a container terminal and equipment performance; specific attention is dedicated to innovative vehicular technologies. In the third section, a simulation methodological approach is proposed, based on specific models for carrying out the quantitative impacts and advantages consequential to the adoption of advanced handling technologies, related to engine type (hybrid and electric vehicles) and automation (driverless vehicles, use of intelligent control systems). The proposed methodology has been tested with reference to a specific case study and a discussion is finally proposed (section four). The obtained results allow to compare the current scenario, in which traditional handling systems operate, with some project scenarios, in which smart technologies are applied, and to assess the economic impacts from the point of view of a port manager and related environmental impacts. The evaluation of the performance of the container port has been carried out by considering models able to give the travel time, energy consumption, and harmful gas emissions of the handling units (HUs) operating in the terminal (leaving out the impacts produced by the vessels). The economic aspect related to innovative and automated systems in the port containers has already been investigated [9].
2. LITERATURE REVIEW
There are studies in the sector literature that suggest the adoption of intelligent solutions in the organization and operation of a port to positively affect efficiency. A “smart port” can provide economic and environmental benefits and contribute to the sustainable development of the territory [10]. Smart ports try to improve efficiency, communication among stakeholders, and employee satisfaction [11] and move towards the improvement of competitiveness, shaping the market dynamics and policies [12, 13].
The performance of smart ports has been analyzed by several researchers [14-16]. Yen et al. [10] proposed state-of-the-art classifying studies into three classes: studies concerning indicators to measure quantitative aspects of smart ports, such as productivity and level of automation [17, 18], studies with particular attention to the methods of measuring the qualitative aspects [19], and studies based on mixed methods integrating indicators and models [20] such as those based on a DEA approach to measure performance efficiency [21-24] or regression models, such as the Tobit [25-27].
Many literature research works have addressed the analysis of port performance by considering only specific factors, such as economic impacts [1, 28-31], operation [32], environment [33], energy [34, 35], safety [36, 37], and security [35, 38].
In this study, the focus has been on some specific impact indicators, such as the operational efficiency (time, monetary cost, energy consumption) related to HUs and emissions of air pollutants produced by the same vehicles.
Energy efficiency is becoming more interesting for ports and terminals; the decision makers realize that substantial energy savings can be obtained through rationalization of operation, adoption of new technologies, and use of renewable energy sources [39-42]. According to some research works, automated HUs may be the key to improving the energy efficiency of port systems [43]. The energy consumption can be evaluated in relation to 6 clusters: quay cranes, lighting, buildings, horizontal handling, cooling, others [44]. A study related to 31 container terminals in 16 different countries [45] reported that horizontal handling activities, carried out mainly by diesel vehicles, represent the largest and fastest-growing share of energy consumption. In fact, the average level of energy consumption per container, for horizontal mobility, is about 4.7 lt equivalent of diesel (about 54% of the total amount of energy used); the ship loading/unloading activities carried out by special quay cranes consume on average 11% (1 lt equivalent of diesel) of the total; the other consumption rates are due respectively to unknown and undefined sources (25%), buildings (9%), and lighting (1%).
The emission of air pollutants in ports is another important research topic; the introduction of green means is a step towards a sustainable low-carbon economy that will require radical changes in energy delivery systems [46, 47]. Many studies concern ship emissions [48, 49]; Barberi et al. [50] offered a comprehensive yet technical review of the latest
related technologies, explaining and covering aspects that link ports with emissions, i.e., analyzing, monitoring, assessing, and mitigating emissions in ports. Some studies [51, 52], related to 5 US ports (Los Angeles, Long Beach, New York, Houston, Oakland), demonstrated that about 38% of air emissions are related to ships, about 24% to the handling activities among the different areas of the terminal, 36% to intermodal activities (4% rail; 32% road), and the remaining 2% to other vehicles operating in the terminal.
3. MATERIALS AND METHODS
3.1. A Container Port and the Related Equipment
Container ports are ports specialized in cargo handling in containers. These terminals play an important role in the interface between intercontinental/international and national/regional traffic, allowing the container handling among ship-ship, ship-truck, and ship-train.
The main operational functions in a container port can be summarized in the following points:
• Loading/unloading of ships by special quay cranes (Gantry Crane),
• Containers handling among different areas of the terminal (quay - yard - intermodal area) with dedicated equipment,
• Any containers handling operations in areas defined as Container Freight Stations (CFS) generally located close to the yard,
• Freight loading/unloading from/to road and rail carriers.
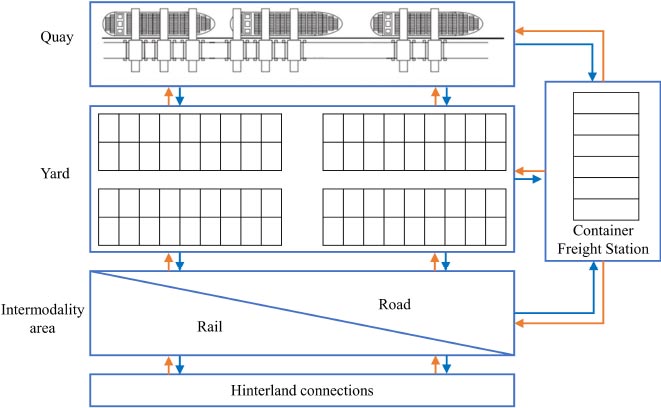
The terminal can be divided into sub-systems in relation to these operations: the quay, the yard, the intermodal area for interchange (with rail/road transport modes and the related in/out gates), and the freight handling area (Fig. 1).
The yard layout schemes depend on the type of the HUs used, for example, if the transtainer cranes are used, the yard layout is block type, while if vehicles, such as straddle carriers, are used, the yard layout is ribbon type.
HUs are dedicated means used at cargo interchange sites in order to transfer the cargo units from one area to another, and from one means of transport to another [53]. It is possible to distinguish three classes of HUs in relation to the terminal area (Quay-Q; Yard-Y; Intermodal space-I) the power system (Diesel-D; Electric-E; Hybrid-H, Natural gas-NG; etc.), and the level of automation (Table 1). Six different levels associated with the development of automation [54-57] can be identified: level 0 corresponds to the absence of automation, levels 1-3 have increasing automation components, and level 4 is the full automation in terms of technology, but a driver can operate in specific cases; at level 5 (autonomous), the vehicle is controlled only in remote and the technology is fully automated.
The most common HUs used in the yard are straddle carriers (SCs), fork lifts (FLs), reach stackers (RSs), and transtainers with wheels (RTGs). The attention to environmental and energy-saving issues has led to the
| Handling Unit | Terminal Area | Power | Autom. Level | ||||||
|---|---|---|---|---|---|---|---|---|---|
| Q | Y | I | D | E | H. | NG | 0 | 1-5 | |
| Gantry Crane (GC) | X | - | - | X | X | - | - | X | 5 |
| Mobile Crane (MC) | X | - | - | - | - | - | - | X | - |
| Straddle Carrier (SC) | - | X | - | X | X | X | - | X | 5 |
| Rubber Tyred Gantry Crane (RTG) | - | X | X | X | X | - | - | X | 5 |
| Rail Mounted Gantry Crane (RMG) | - | X | X | X | X | - | - | X | 5 |
| Reach Stacker (RS) | - | X | X | X | X | X | - | X | 4 |
| Fork Lift (FL) | - | X | X | - | - | - | - | X | - |
| Multi Trailer Train (MTT) | - | X | - | X | X | - | X | X | - |
| Automated Guided Vehicle (AGV) | - | X | - | - | - | - | - | - | 5 |
| - | SCs | RSs | RTGs | FLs | |||||||
|---|---|---|---|---|---|---|---|---|---|---|---|
| - | D | H | E | D | H | E | D | H | E | D | E |
| Length (m) | 9-12 | 11-14 | 20-38 | 6.7 | 4.6-6.0 | ||||||
| Width (m) | 4-6 | 4-5 | 13-14 | 3.4 | 2.4-2.9 | ||||||
| Height (m) | 13-16 | 4-5 | 12-20 | 3.5 | 2.8-3.0 | ||||||
| Max stacking height | 3-5 | 3-5 | 3-6 | 3-5 | - | ||||||
| Tare (t) | 64 | 45 | - | 70 | - | ||||||
| Travel, empty (km/h) | 25-30 | 25-30 | 20-30 | 4.21 | 28 | 20 | |||||
| Travel, loaded (km/h) | 25-26 | 20-30 | 20-30 | 4.21 | 25 | 18 | |||||
| Lifting, empty (m/min) | 24 | 30 | 25 | 56 | 21 | 21-30 | |||||
| Lifting, loaded (m/min) | 15-20 | 13-20 | 15 | 28 | 18 | 21-30 | |||||
| Power (kW) | 135-142 | 77 | 235 | 190 | 2.2 | 2 x 37 | |||||
| Capacity under spreader (t) | 40-50 | 40-60 | - | 41-45 | 30 | 9-18 | |||||
| Service weight (t) | 66-70 | 66-72 | 65-80 | - | 39 | 18-30 | |||||
| Energy consumption (lt/h) | 31.9 | 23.3 | - | 10-15 | - | 2.22 | 0.92 | - | 14 | - | |
| Energy consumption (kWh/h) | - | - | 80 | - | - | 55 | - | - | 3.03 | . | - |
2 lt/move;
3 KWh/move. Source: Our elaborations based on technical data sheets of Kalmar and Konecranes 5960
development of technological solutions able to improve energy efficiency and reduce emissions of air pollutants. In many maritime container terminals, the traditional diesel SCs, RSs, and RTGs are being replaced by hybrid and fully electric models that offer better performance, guaranteeing a significant reduction in consumption and air and noise emissions. Table 2 presents some technical, operational, and cost characteristics of the most common HUs. The means are differentiated by the kind of engine (diesel-D, hybrid-H, and full electric-E). The data have been obtained by specific research in the sector manufacturers. The energy consumption data refer to average values found in specialized literature documents.
Alongside conventional diesel, hybrid, and electric HUs, fully automated HUs are operating in many terminals, characterized by very high levels of automation. An automated HU is able to operate without a driver, guaranteeing significant savings in operating expenses (labour and maintenance costs). However, each vehicle must be remotely controlled by a specialized operator. An automated terminal requires specific navigation infrastructures, such as radars installed on lighting towers and buildings around the port hub or magnetic indicators embedded in the apron flooring. For each automated vehicle, it is necessary to accurately measure the position, using specific localization systems; in addition, a wireless network must be installed for communication between the control area and HUs. An automated terminal also gives greater efficiency (due to the reduction of downtime), predictability of operations, safety, and longer equipment life.
The automated HUs currently most used in container shipping ports are Automated Guided Vehicles (AGVs), Automated Straddle Carriers (ASCs), and Automated Rubber-Tyred Gantry cranes (ARTGs), also named “Automated Transtainer”.
The AGVs and Lift-AGVs (Table 3), used in the ports of Rotterdam, Hamburg, and Singapore, are optically guided vehicles and allow the horizontal handling of containers from the quay to the yard and vice versa; they are simple, flexible vehicles with low mass, low fuel consumption and high load capacity (about 60 t).
| - | - | AGV | Lift-AGV |
|---|---|---|---|
| Dimensions | Length (m) | 14.8 | 14.8 |
| Width (m) | 3.0 | 3.0 | |
| Load Piano Height (m) | 1.7 | 2.2 | |
| Tare (t) | 25.0 | 34.0 | |
| Technical Data | Positioning Accuracy (mm) | +/-25 | +/-25 |
| Fuel Tank Capacity(lt) | 1,400 | 1,400 | |
| Consumption (lt/h) | 8 | 10 | |
| Load Mass | Single Container (t) | 40 | 40 |
| Two Containers (t) | 60 | 60 | |
| Max Towing Capacity (t) | - | - | |
| Speed | In Straight Layout (m/s) | 6 | 6 |
| In Curved Layout (m/s) | 3 | 3 | |
| During Steering (m/s) | 1 | 1 | |
| Average Driving (km/h) | 4 | 4 |
| - | ASC |
Automation Effect (Δ%) |
ARTG |
Automation Effect (Δ%) |
|---|---|---|---|---|
| Travel speed, loaded (km/h) | 27 | +12.5 | 4.6* | +9.5 |
| Lifting speed, loaded (m/min) | 20 | +17.6 | 31 | +10.7 |
With reference to an ASC and an ARTG, their typical technical and dimensional characteristics are quite similar to those of the corresponding not-automated means. The main difference lies in the equipment; the automated vehicles are equipped with a system of devices and sensors that allow safe and agile movements, without driver presence.
The automated HUs are very flexible and give higher travel and coupling, lifting and lowering speeds, with the same technical, engine, and dimensional characteristics of not-automated vehicles [58, 59] (Table 4). The precision ensured by the sensors and by the control and management systems allows an increase in productivity and operational capacity, but also in travel safety.
The ASCs and ARTGs are controlled by advanced computer systems; their unit cost increases considerably (about 2.2M€ for ARTG), but driverless operation gives attractive lower running costs and offers greater operational efficiency.
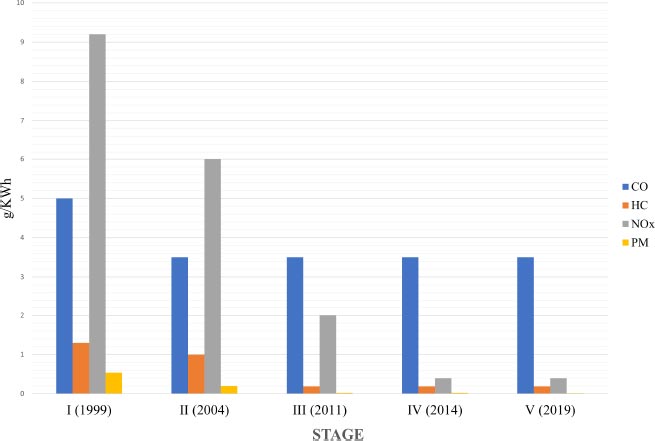
The emissions of air pollutants resulting from the use of diesel or hybrid HUs (automated or not) vary according to the type of vehicle, the year of construction, and the type of fuel. Since 1997, the European Union has adopted a series of 7 directives aimed at regulating the air emissions of Not-Road Mobile Machinery (NRMM) through the definition of specific emission standards (or emission factors). These standards have been structured as gradually stricter levels known as Stages (Fig. 2). The legislative process that led to the definition of emission standards has now reached Stage V proposed in 2014 [60, 61].
3.2. Methodological and Simulation Approach
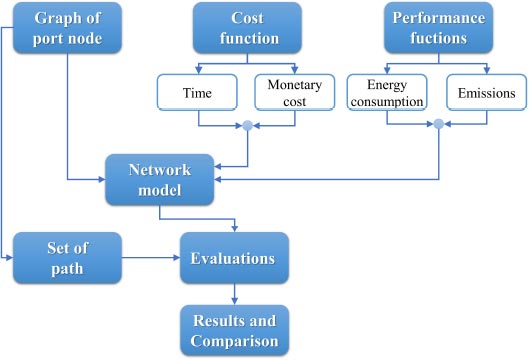
The methodological approach used in the study for the performance evaluation of a container port is schematized in Fig. (3).
Starting from the current configuration of the terminal, a graph of the port network is built. Specific models expressed in terms of cost and performance functions are applied to the network links in order to calculate reference variables, such as movement time, monetary cost, energy consumption, and emissions of air pollutants. A set of paths, followed by the HUs in the network, has to be defined. It is, therefore, possible to calculate the performance related to the whole terminal in a desired temporal window (e.g., a day).
The next step concerns the scenario design. The application of the models to the different supply scenarios allows to have results that, when compared, could address the best terminal asset.
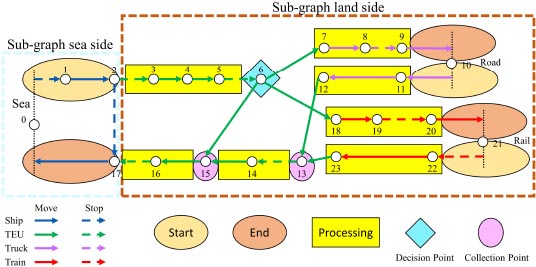
The structure of a freight interchange terminal can be functionally illustrated in a schematic way by a graphical model of the routes; the graph is identified by a set of N nodes and a set of L links. The nodes are physical and/or time points representing the beginning/end of a simple operation in the freight transport cycle, and the links represent the handling and/or treatment operations. The network model is carried out by associating specific quantitative characteristics (i.e., cost functions) to each link and node of the graph.
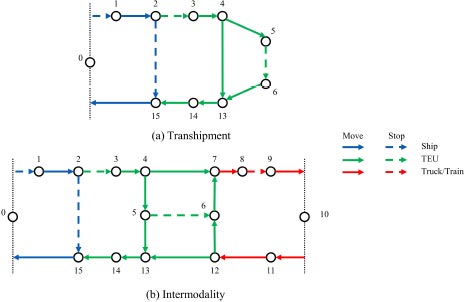
The links can be classified into 2 classes: moving links and stop links. The first category includes handling/moving activities from one terminal area to another; the second category includes downtime steps, such as storage in the yard or waiting in the intermodal area for the train or truck loading/unloading operations. Fig. (4) shows an example of a graph for a container port. Fig. (5) shows the reference sub-graphs for transshipment and intermodal activities. Table 5 presents the description of the links.
| Link | Graph | Description |
|---|---|---|
| 0-1 | All | Waiting at anchor |
| 1-2 | All | Piloting, towing, berthing |
| 2-3 | All | TEU standby on the ship |
| 3-4 | All | TEU positioning in buffer crane |
| 4-13 | Transshipment | Direct transshipment |
| 4-5 | All | Transfer to the yard |
| 5-6 | All | Waiting in yard |
| 6-13 | All | Transfer to berth |
| 13-14 | All | Loading into ship |
| 14-15 | All | Waiting for loading operations |
| 15-0 | All | Unberthing, piloting, towing, exit |
| 6-7 | Intermodality | Transfer to train/TIR area |
| 7-8 | Intermodality | Load on train/TIR |
| 8-9 | Intermodality | Check train/TIR |
| 9-10 | Intermodality | Exit train/TIR |
| 10-11 | Intermodality | Arrive on train/TIR |
| 11-12 | Intermodality | Unload train/TIR |
| 12-13 | Intermodality | Transfer to berth |
| 13-14 | Intermodality | Transfer to yard |
The cost functions can be expressed in terms of time (time to carry out an activity, storage time, etc.), in terms of monetary cost (cost for handling a container, etc.), or by a generalized cost, which is a linear combination of the time and monetary costs.
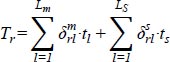
The travel time on a specific r path, followed to move a container within the terminal area, can be calculated using the following expression:
 |
(1) |
Where:
 is a shadow variable that is 1 if the lm moving link is in the r path, it is 0 otherwise;
• tl is the travel time (min) on the lm moving link that depends on the s length (m) of the link and vH average speed (m/min) of the HU operating on the lm link:
 |
(2) |
 is a shadow variable that is 1 if the ls stop link is in the r path, it is 0 otherwise;
• ts is the stop time (min) on the ls stop link.
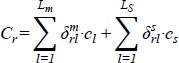
In a similar way, the monetary cost can be expressed as:
 |
(3) |
Where:
is a shadow variable that is 1 if the lm moving link is in the r path, it is 0 otherwise;
• cl is the monetary cost (€) related to the lm moving link given by the product between the s link length (m) and a unit cost parameter aH (€/m) variable in relation to the HUs considered:
 |
(4) |
is a shadow variable that is 1 if the ls stop link is in the r path, it is 0 otherwise;
• cs is the monetary cost (€) on the ls stop link (for example waiting or storage) evaluable as the product of the time on the tl link (min) and the cw stop/waiting monetary cost (€/min):
 |
(5) |
The energy consumption resulting from the actions of HUs to move the containers within the terminal can be associated with the moving link and calculated using the following formulation:
 |
(6) |
Where:
 is a shadow variable that is 1 if the lm moving link is in the r path and is used by the H HU, it is 0 otherwise;
• tl,H is the time (h) taken by the H HU on the lm link;
• βH is a unitary consumption parameter (lt/h) for the H HU.
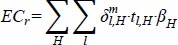
Specific performance functions can be used for assessments relating to the impacts of emissions [62-64]. The estimate of the air emissions of a given q pollutant along the r path can be calculated using the formula:
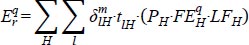 |
(7) |
Where:
 is a shadow variable that is 1 if the lm moving link is in the r path and is used by the H HU, it is 0 otherwise;
• tlH is the time (h) taken by the H HU on the lm link belonging to the r path;
• PH is the engine power (kW) of the H HU;
•
• LFH is the load factor of the H HU given by the ratio of the average load used during normal operations and the transportable load at maximum power.
The analysis has been addressed to assess the impacts of vehicular technology enhancement in terms of operational efficiency (mobility time, energy consumption) and air pollutants emissions. In particular, an increase in terms of efficiency (times, consumption, etc.) and a reduction in emissions of air pollutants are expected.
4. RESULTS
A case study was proposed about the port of Gioia Tauro (Italy), which specializes in transshipment and is located in a strategic position in the Mediterranean Sea.
The HUs currently used in the port of Gioia Tauro are:
• 19 RMGs for handling containers between ship and quay;
• 128 SCs for handling containers between quay and yard, yard and intermodal areas;
• 12 RSs for loading/unloading of trains and heavy trucks;
• 12 MTTS for simultaneous handling containers and yard rearrangement operations.
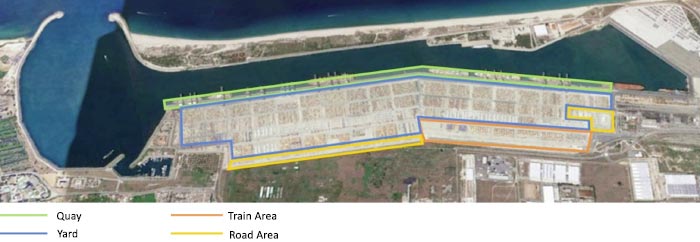
The container quay extends for 3,391 m (8 berths) and can simultaneously accommodate 4 Ultra Large Container Vessels (14,000 TEUs of capacity). The yard is organized into 69 sectors separated by orthogonal corridors; each block has a ribbon layout to ensure container handling with SCs. In the yard, there are 2,300 reefer sockets and two distinct intermodal areas, one is near the railway tracks for sea-rail interchange and one is for sea-road interchange (Fig. 6).
The graph of Gioia Tauro port and the possible routes has been defined considering that the handling of containers is carried out by SCs. It has been assumed that SCs move in a loop mode on a closed circuit.
Three different types of paths were analysed (short, medium, long); hypothetically, 1 TEU of 25 t was handled on each path. During the analysis, reference was made only to handling activities; therefore, downtime (storage in the yard) was not considered in the assessment of time. The analysis was performed using a spreadsheet, with automatic calculation. The data used was provided by the port management company (Mediterranean Container Terminal) and, in part, derived from previous studies or provided by specialised companies (for scenario design).
Four different scenarios were built and compared through performance indicators after simulation:
• Scenario 0: current state.
• Scenario 1: use of hybrid HUs and rearrangement of the train area by using RTGs for loading/unloading activities.
• Scenario 2: improvement of Scenario 1 by using full electric HUs.
• Scenario 3: improvement of Scenario 2 by using automated HUs.
The results of analysis are reported in Table 6; the results are related to the handling of 1 TEU but they can be generalized in relation to the number of moves considered in a given reference period.
Scenario 0 and Scenario 1 were compared, considering costs, in terms of handling times, and performance, in terms of energy consumption and pollutants emissions. The use of hybrid SCs allowed a reduction in handling times of 1 TEU for direct and indirect transshipment activities, between 1% and 3% in relation to the type of path (short, medium, and long); energy consumption was reduced by approximately 28% and emissions of air pollutants were halved on all the routes considered. With regard to the sea-rail intermodal activities, Scenario 1, in addition to the use of hybrid SCs, provides for the rearrangement of the railway area with the use of RTGs for loading/unloading the train. The combined action of these two measures allowed the reduction of handling times of 1 TEU by about 25% on all routes, assuring the direct transfer of the container from the platform to the train area; it also determined an average reduction of 39% of energy and 73% of emissions of air pollutants. In the case of indirect transfer between the quay and train area with a stop in the yard, the reduction in handling times varied between 32% (short route) and 14% (long route); the decrease in energy consumption was between 35% and 50%, while emissions of air pollutants reduced on average by 58%. Finally, the handling activities to ensure the sea-road interchange (direct and indirect) presented an average reduction of 2% of times on single routes, i.e., 24% of energy and 48% of air emissions.
| Activity | Route | Length |
Total Handling Time (min) |
Energy Consumption (lt) |
Total Pollutant Emission (g) |
|||||||||
|---|---|---|---|---|---|---|---|---|---|---|---|---|---|---|
| (m) | Sc. 0 | Sc. 1 | Sc. 2 | Sc. 3 | Sc. 0 | Sc. 1 | Sc. 2 | Sc. 3 | Sc. 0 | Sc. 1 | Sc. 2 | Sc. 3 | ||
| Direct Transshipment |
Short | 561 | 2.90 | 2.84 | 2.84 | 2.37 | 1.54 | 1.10 | 0.41 | 0.34 | 13.41 | 5.58 | 0.00 | 0.00 |
| Medium | 1,706 | 5.76 | 5.59 | 5.59 | 4.91 | 3.06 | 2.17 | 0.81 | 0.71 | 26.66 | 10.98 | 0.00 | 0.00 | |
| Long | 2,360 | 7.39 | 7.16 | 7.16 | 6.36 | 3.93 | 2.78 | 1.04 | 0.93 | 34.23 | 14.07 | 0.00 | 0.00 | |
| Indirect Transshipment |
Short | 490 | 4.21 | 4.16 | 4.16 | 3.33 | 2.24 | 1.62 | 0.61 | 0.48 | 19.50 | 8.18 | 0.00 | 0.00 |
| Medium | 1,212 | 6.02 | 5.90 | 5.90 | 4.93 | 3.20 | 2.29 | 0.86 | 0.72 | 27.85 | 11.59 | 0.00 | 0.00 | |
| Long | 2,573 | 9.42 | 9.16 | 9.16 | 7.96 | 5.01 | 3.56 | 1.33 | 1.16 | 43.60 | 18.01 | 0.00 | 0.00 | |
| Direct Sea-rail Intermodality |
Short | 613 | 4.63 | 4.23 | 4.23 | 3.63 | 1.94 | 1.41 | 1.39 | 1.32 | 30.24 | 7.32 | 0.00 | 0.00 |
| Medium | 1,519 | 6.70 | 6.38 | 6.38 | 5.61 | 2.88 | 2.13 | 1.59 | 1.51 | 42.54 | 11.22 | 0.00 | 0.00 | |
| Long | 2,334 | 8.91 | 8.38 | 8.38 | 7.44 | 4.20 | 2.69 | 1.68 | 1.59 | 50.34 | 14.49 | 0.00 | 0.00 | |
| Indirect Sea-rail Intermodality | Short | 742 | 6.43 | 6.14 | 6.14 | 5.37 | 2.88 | 1.82 | 1.35 | 1.29 | 38.83 | 18.28 | 0.00 | 0.00 |
| Medium | 1,570 | 8.39 | 8.28 | 8.28 | 7.11 | 3.84 | 2.87 | 1.87 | 1.73 | 49.33 | 15.12 | 0.00 | 0.00 | |
| Long | 2,328 | 10.29 | 9.80 | 9.80 | 9.31 | 4.85 | 3.58 | 2.01 | 1.86 | 58.11 | 27.22 | 0.00 | 0.00 | |
| Direct Sea-road Intermodality | Short | 530 | 4.47 | 4.42 | 4.42 | 3.95 | 1.89 | 1.48 | 0.56 | 0.50 | 28.88 | 13.17 | 0.00 | 0.00 |
| Medium | 811 | 5.15 | 5.07 | 5.07 | 4.57 | 2.24 | 1.72 | 0.66 | 0.58 | 32.31 | 21.41 | 0.00 | 0.00 | |
| Long | 1,324 | 6.39 | 6.27 | 6.27 | 5.69 | 2.87 | 2.17 | 0.83 | 0.74 | 38.60 | 25.70 | 0.00 | 0.00 | |
| Indirect Sea-road Intermodality | Short | 828 | 6.70 | 6.62 | 6.62 | 5.74 | 3.08 | 2.33 | 0.89 | 0.76 | 39.24 | 17.51 | 0.00 | 0.00 |
| Medium | 1,260 | 7.76 | 7.64 | 7.64 | 6.68 | 3.63 | 2.72 | 1.03 | 0.89 | 44.42 | 19.66 | 0.00 | 0.00 | |
| Long | 1,996 | 9.57 | 9.38 | 9.38 | 8.30 | 4.55 | 3.38 | 1.28 | 1.12 | 53.29 | 23.36 | 0.00 | 0.00 | |
The comparison between the first two scenarios, related to 1 TEU move showed how a far-sighted management of the terminal and the attempt to introduce greener systems could lead to an improvement in the performance of the port and a reduction in costs. Furthermore, the introduction of innovative systems combined with a reorganization of areas and activities could further optimize the efficiency of the system.
Scenario 2 provided for an improvement of Scenario 1 by using electric vehicles. The handling times did not change, but the emissions of air pollutants became negligible and the energy consumption was significantly reduced (Fig. 7); there was an average reduction of 65% compared to Scenario 0 and an average reduction of 51% compared to Scenario 1. In order to compare the energy cost of different engines, 1 lt of diesel fuel was considered equivalent to 9.17 kWh.
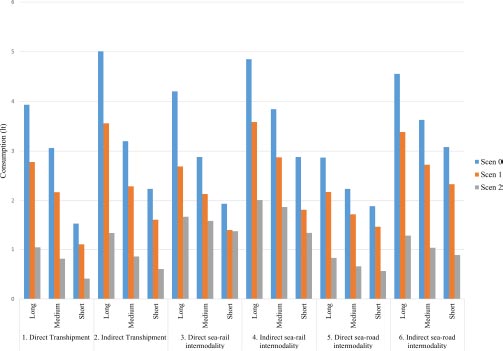
The use of fully electric HUs allows for a breakdown in air emissions and a significant impact on energy consumption. The newly manufactured machines are able to respect the environment and also limit energy consumption; this makes it possible to further improve the performance of the ports by more sustainable technological solutions in HUs.
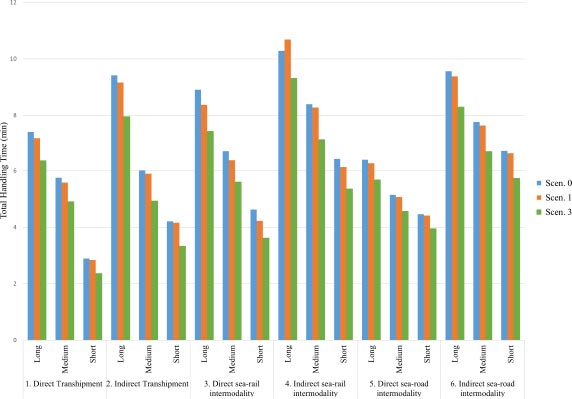
To understand how automation affects the handling of goods in a terminal, Scenario 3 can also be considered. The introduction of fully automatic HUs in Scenario 3 allowed, in comparison to Scenario 0, a reduction in handling times between 9% and 22% in relation to both the type of activity and the length of the route. Comparison with Scenario 1 revealed an average time reduction of 13%. In correspondence with the reduction in handling times, a decrease in energy consumption was derived. The full automation of the terminal brings obvious advantages; however, it should be considered that the evaluations refer to performances indicated by the manufacturers.
The results showed that the introduction of automation in the handling of goods has a significant impact on costs and in particular on handling times (Fig. 8).
Analyses were carried out to evaluate times and performance (energy consumption and air emissions) for specific activities, such as the unloading of a ship or the composition of a train. The following hypotheses have been adopted:
• Unloading 204 TEUs from a ship, using 10 SCs for displacement in the yard;
• A convoy of 25 wagons (50 TEUs) using 6 SCs for the yard-train area transfer and 2 RSs (scenario 0) or 2 RTGs (scenario 1) for the train loading.
Table 7 summarises the simulation results. Making a comparison between scenarios 0 and 1, in the case of ship unloading activities, the use of hybrid SCs allowed a minimum reduction in handling times (-1.53%), but considerable reductions were recorded in energy (-8%) and emissions of air pollutants (-44%).
The composition of a freight train inside the terminal in Scenario 0 required a total time of approximately 8 hours (net of downtimes such as those relating to any staff shift changes). These times in Scenario 1 were reduced by about 1 hour due to more efficient and faster HUs. In terms of energy and air emissions, the comparison between the two scenarios showed a decrease of 28% and 48%, respectively.
| Activity | Scenario |
Total Handling Time (min) |
Energy Consumption (lt) |
Total Pollutant Emission (g) |
|---|---|---|---|---|
| Displacement in yard | 0 | 985 | 524 | 5,067 |
| 1 | 970 | 377 | 2,555 | |
| 2 | 970 | 141 | 0 | |
| 3 | 791 | 141 | 0 | |
| Train composition | 0 | 496 | 234 | 2,997 |
| 1 | 468 | 168 | 1,630 | |
| 2 | 468 | 105 | 0 | |
| 3 | 406 | 105 | 0 |
The introduction of electric HUs (Scenario 2) allowed an energetic reduction of 73% compared to Scenario 0 and 63% compared to Scenario 1 for displacement of containers in the yard. The train composition resulted in a relevant reduction of 55% in energy compared to Scenario 0 and 38% with respect to Scenario 1.
HUs automation (Scenario 3) allowed a reduction of 20% and 18% in handling times compared to Scenario 0 and Scenario 1, respectively, related to displacement activities. Even train composition activities resulted in a reduction in times (-18% compared to Scenario 0 and -13% compared to Scenario 1).
5. DISCUSSION
The research results reported that the introduction of green and automated technologies leads to a substantial improvement in the service structure and a corresponding increase in the operational efficiency of the HUs (handling times and energy consumption), as well as a significant reduction in air pollutants emissions [9].
The use of more ecological means has benefits on the environment but it does not translate into significant efficiency gains [65, 66]. A higher level of automation corresponds to an increase in efficiency in terms of time savings [67, 68]. The use of technologies that foresee improvements in motorisation and automation implies a substantial generalized improvement both in terms of efficiency and safety of the environment.
The introduction of green and automated HUs represents a step towards sustainable development but requires radical changes to the whole port system in order to provide innovative energy supply systems and other services. This also involves changes to energy use practices; innovation and the diffusion of innovative systems with low air emissions produce global changes and have an impact on local, national, and international economies. These changes must help maintain and expand economic prosperity in a socially equitable way while ensuring that these socioeconomic systems remain within ecological bounds [46].
The impacts of the green and automated HUs should also be evaluated from an economic point of view; from some analysis carried out by the authors, it emerged that the introduction of these new vehicles leads to an increase in costs, including maintenance costs; however, personnel costs are reduced as there is no driver for each HU but just an operator who controls and supervises several HUs in shift work; however, the costs are largely compensated by high productivity [9]. In contexts in which a green and automated port has been realized (e.g., the port of Rotterdam), the investment and operating costs have been covered by the advantages that these new technologies have brought. The transition to another type of energy, in particular electricity, can have significant repercussions in economic and global terms as long as it is energy from renewable sources.
The proposed model focuses on environmental and energy impacts; the analysis from an economic point of view, considering all aspects related to the presence of systems powered by a new fuel (including production and transport), requires an extension of the field of study to a regional/national scale.
The research results demonstrated that it is possible to improve the performance of a port by introducing innovative, green, and automated solutions; the use of these systems is part of a general framework of actions that should be undertaken, thus leading to making a port more competitive and sustainable.
The port configuration and layout should adapt to container traffic in order to facilitate the handling operations and freight loading/unloading; the introduction of innovative solutions in the port also involves the realization of material and immaterial infrastructures that guarantee the correct implementation of HUs and dedicated spaces for the intelligent management of activities.
The port managers should be suitably directed toward the best strategies to adopt; the implementation of new configurations of a port involves considerable economic investments that must be borne by the managers. Government bodies and regional administrations should propose incentives to direct ports towards more competitive and sustainable configurations because there are important economic impacts reflecting on the whole country in which the ports operate, a port can be a source of employment and has decisive social implications, and because the international community is working hard to ensure that the sustainability goals are pursued [69].
CONCLUSION
The trend in container ports around the world shows a general trend to adopt advanced HUs technologies and automation in order to reduce energy consumption and emissions of air pollutants and to improve operational efficiency. The analyses done have allowed some assessments about the impacts generated both by the use of green HUs (hybrid and electric) and by providing automation for the operations (fully automated vehicles). The main objective of the research was to highlight the advantages of the new technologies through a simulation approach applied to a port container context able to give a quantitative assessment of the impacts in terms of handling time, energy consumption, and gas emission reduction, making the container port more competitive and sustainable. This research target can only be achieved if there is economic and social support for sector managers to undertake actions that transform the physical and organizational structure of the port.
The introduction of green and automated technologies requires that the whole port system be changed to provide for the installation of energy supply systems, material, and immaterial infrastructures to realize smart ports, specialized operators to carry out innovative tasks, etc. The proposed analysis covered many research topics; the goal of this study was to assess some impacts deriving from the introduction of innovative HUs; it did not investigate the costs that have to be incurred to introduce and maintain technologies powered by a new fuel in the logistics node as this type of analysis would require an extension of the study field to another territorial scale.
The current study focused on the landside of a container port, not considering the impacts linked to the vessels. The analyses concerned both the movement of a single container and the mobility of a large group of containers, managing a specific HUs fleet. Whether the effect of each action appears significant, the combined effect of the different measures allows even more important reductions in terms of energy consumption and harmful air emissions and a substantial improvement in efficiency performance (handling times).
It should be noted that the methodological approach proposed in this study is suitable and transferable for all ports, and the strategies based on technological innovation in HUs should give impacts more sustainable for the community and more efficient for the port managers.
CONFLICT OF INTEREST
Dr. Domenico Gattuso is te editorial board member of the hournal TOTJ (The Open Transportation Journal).
CONSENT FOR PUBLICATION
Not applicable.
AVAILABILITY OF DATA AND MATERIALS
Not applicable.
FUNDING
None.
LIST OF ABBREVIATIONS
| CFS | = Container Freight Stations |
| GC | = Gantry Crane |
| MC | = Mobile Crane |
| SC | = Straddle Carrier |
| RTG | = Rubber Tyred Gantry Crane |
| RMG | = Rail Mounted Gantry Crane |
| RS | = Reach Stacker |
| FL | = Fork Lift |
| MTT | = Multi Trailer Train |
| AGV | = Automated Guided Vehicle |
ACKNOWLEDGEMENTS
Declared none.

